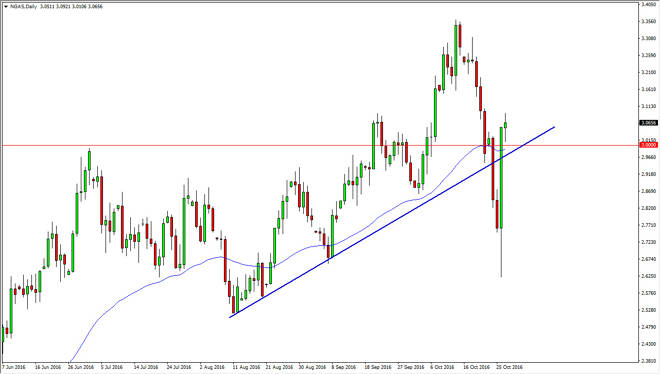
The natural gas markets formed a massive green candle at the end of the day on Wednesday, and then on Thursday ended up initially falling to the $3 level,
The natural gas markets formed a massive green candle at the end of the day on Wednesday, and then on Thursday ended up initially falling to the $3 level, but bounced enough to form a supportive looking hammer. Quite frankly this is a bit of a surprise as this explosive move certainly has quite a bit of momentum behind it. With this, we can break above the top of the candle for the Thursday session, it looks as if the longer-term uptrend will continue. However, one thing you can count on is that the natural gas markets will be very volatile.
Chris is a proprietary trader with more than 20 years of experience across various markets, including currencies, indices and commodities. As a senior analyst at FXEmpire since the website’s early days, he offers readers advanced market perspectives to navigate today’s financial landscape with confidence.