The S&P 500 went back and forth during the course of the session on Tuesday, forming a slightly negative looking shooting star type of candle.
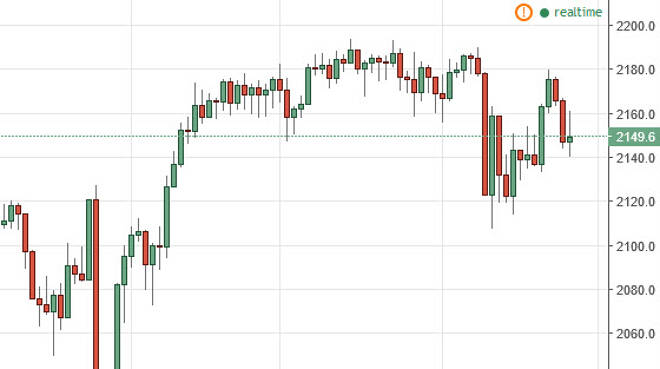
The S&P 500 went back and forth during the course of the session on Tuesday, forming a slightly negative looking shooting star type of candle. Ultimately though, I think there is more than enough support below to keep this market going higher, so I have no interest whatsoever in selling this market. With this, a supportive candle below should be a buying opportunity just as a break above the top of the shooting star would be. I have no interest in selling because of the massive amount of support just below, extending down to the 2120 level.
Chris is a proprietary trader with more than 20 years of experience across various markets, including currencies, indices and commodities. As a senior analyst at FXEmpire since the website’s early days, he offers readers advanced market perspectives to navigate today’s financial landscape with confidence.