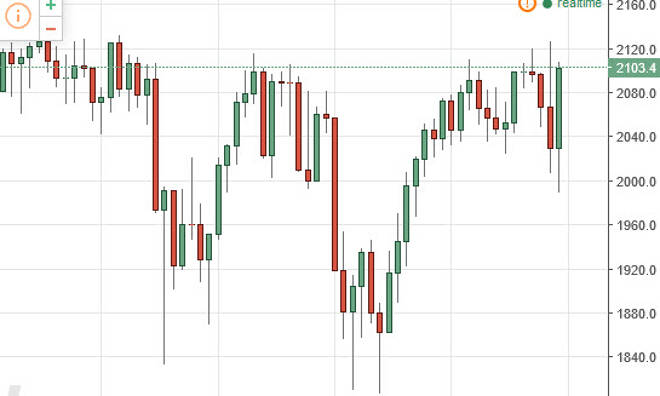
The S&P 500 fell during the course of the week, testing the 2000 support level. The index turned right back soaring to the upside and break above the
The S&P 500 fell during the course of the week, testing the 2000 support level. The index turned right back soaring to the upside and break above the 2100 level. If the 2120 level will get broken to the upside , then it would offer a longer-term “buy-and-hold” scenario. Having said that, Monday is Independence Day in the United States, so liquidity will be in shortage. Eventually, market does look as if it is going to continue higher.Therefore, sentiment is bullish with cautions steps ahead.
Chris is a proprietary trader with more than 20 years of experience across various markets, including currencies, indices and commodities. As a senior analyst at FXEmpire since the website’s early days, he offers readers advanced market perspectives to navigate today’s financial landscape with confidence.