
Advertisement
Advertisement
Crude Oil forecast for the week of September 19, 2016, Technical Analysis
Published: Sep 17, 2016, 05:08 GMT+00:00
WTI Crude Oil The WTI Crude Oil market initially tried to rally during the course of the week, but turn right back around to fall rather significantly. We
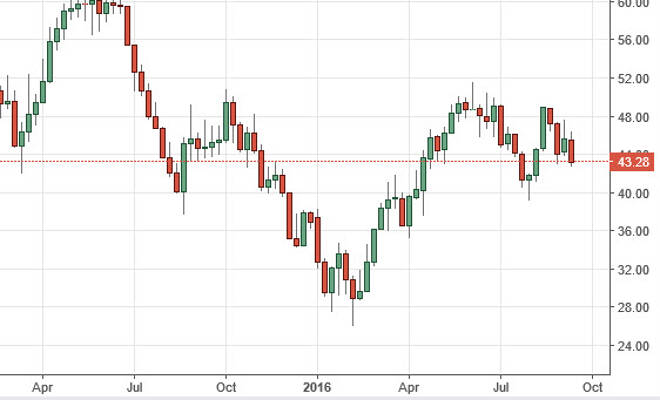
WTI Crude Oil
The WTI Crude Oil market initially tried to rally during the course of the week, but turn right back around to fall rather significantly. We are below the $44 level now, and as a result it’s likely that the market should reach towards the $40 level. That’s an area that I believe will offer support, so we could get a bit of a bounce as we grind down there. However, it’s probably be easier to do this on the daily chart, or perhaps even shorter-term charts. Ultimately, this is a market that looks as if it is trying to roll over at this point in time and of course with the IEA suggesting that there is going to be a glut in supply all the way through 2017, that’s yet another reason to think that oil markets will continue to look overly soft going forward.
Brent
Brent markets also trying to rally during the course of the week, but struggled at the $48 handle in order to turn things back around and form a negative candle. I believe that if we break down below the bottom of the range for the week, we should reach down to the $44 level, and then eventually the $40 level. However, I think if we find quite a bit of negative pressure, we will not only test that $40 level, I believe that we will break down even lower than that. Ultimately, we could grind our way all the way down to the $28 level given enough time.
Pay attention to the US dollar of course, because a stronger US dollar will typically work against the value of the Brent market as well as the WTI Crude Oil market. With this being the case, I think that both of these markets will have to be paid attention to, along with the currency issues. With this, I am starting to get more bearish again, but realize we could see quite a bit of volatility in the meantime as we are most certainly in the middle of a consolidation area.
About the Author
Christopher Lewisauthor
Chris is a proprietary trader with more than 20 years of experience across various markets, including currencies, indices and commodities. As a senior analyst at FXEmpire since the website’s early days, he offers readers advanced market perspectives to navigate today’s financial landscape with confidence.


Advertisement