S&P 500 went back and forth during the course of the week, as we continue to see quite a bit of support at the 2120 level below. Ultimately, I feel
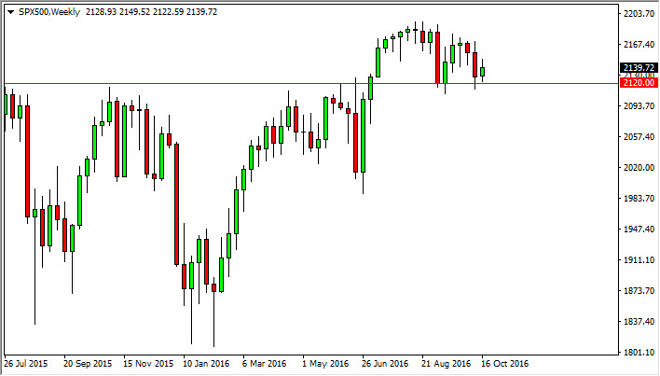
S&P 500 went back and forth during the course of the week, as we continue to see quite a bit of support at the 2120 level below. Ultimately, I feel that the market will bounce, because I think there is a significant amount of support down to the 2100 level. Any supportive candle at this point in time would be reason enough to me go long. It would be very choppy though, so it might be easier to take this market approach from the daily chart or perhaps even shorter time frames than that.
Chris is a proprietary trader with more than 20 years of experience across various markets, including currencies, indices and commodities. As a senior analyst at FXEmpire since the website’s early days, he offers readers advanced market perspectives to navigate today’s financial landscape with confidence.