The US dollar initially fell during the course of the week against the Japanese yen that the 100 level continues to offer quite a bit of support. By doing
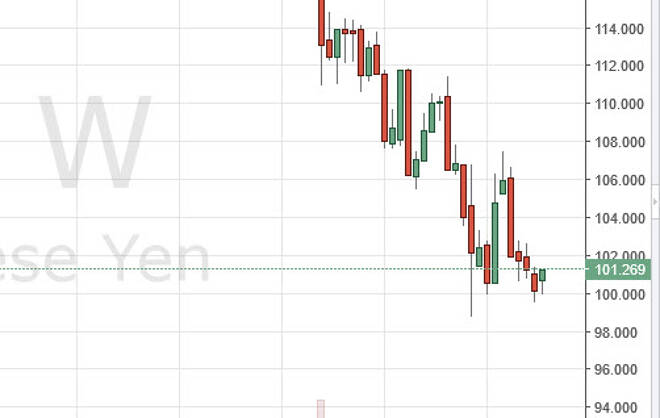
The US dollar initially fell during the course of the week against the Japanese yen that the 100 level continues to offer quite a bit of support. By doing so, we ended up offering the market a hammer by the end of the week. That of course is a bullish sign in a break above the top the hammer could send buyers back into the marketplace and aiming for the 104 level. There will be a bit of resistance of the 102.50 level, but at this point I’m not willing to test the Bank of Japan.
Chris is a proprietary trader with more than 20 years of experience across various markets, including currencies, indices and commodities. As a senior analyst at FXEmpire since the website’s early days, he offers readers advanced market perspectives to navigate today’s financial landscape with confidence.