The Fed could come across as dovish by suggesting it may pause rate hikes because of recession fears.
Gold futures were up sharply on Wednesday, supported by a plunge in Treasury yields and a retreat by the U.S. Dollar. The moves were fueled by the thought of slower Fed rate hikes at its policy meeting next week. As of the close, the odds of a 50 basis point rate hike sit at 74.7%, while the chances of a 75 basis point rate hike are at 25.3%.
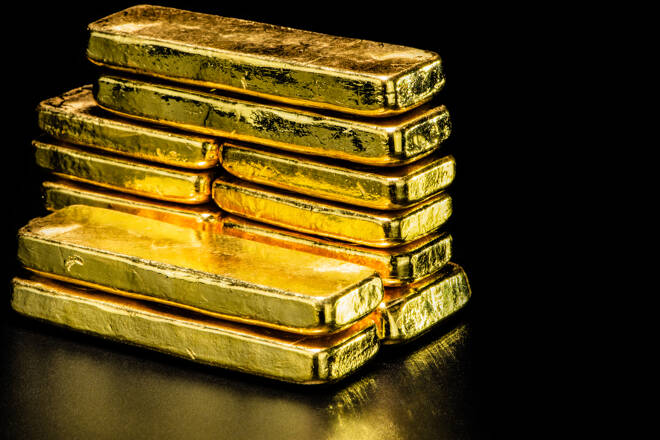
On Wednesday, December Comex gold futures settled at $1798.00, up $15.60 or +0.87% and the SPDR Gold Shares ETF finished at $166.34, up $1.50 or +0.91%.
The benchmark U.S. 10-year Treasury yield dropped to a near three-month low, driving down demand for the U.S. Dollar, which fell a half a percent against a basket of currencies.
Lower yields tend to lower the opportunity cost of holding gold, which pay no interest. A weaker greenback tends to drive up foreign demand for dollar-denominated gold.
The main trend is up according to the daily swing chart. However, momentum could shift to the downside if $1778.10 fails as support.
A trade through $1822.90 will signal a resumption of the uptrend. A move through $1752.90 will change the main trend to down.
The nearest resistance is a long-term Fibonacci level at $1804.30. The nearest support is a pair of 50% levels at $1778.20 and $1771.50.
Trader reaction to $1790.60 is likely to determine the direction of February Comex gold on Thursday.
A sustained move over $1790.60 will indicate the presence of buyers. The first upside target is $1804.30. Overtaking this level will indicate the buying is getting stronger. This could trigger an acceleration into the minor top at $1822.90.
A sustained move under $1790.60 will signal the presence of sellers. This could lead to a test of the support cluster at $1778.20 – $1771.50.
Look for a technical bounce on the first test of the support cluster. However, a failure to hold $1771.50 could trigger an acceleration into the main bottom at $1752.90.
Gold could tread water for several days until the Fed meets on Dec. 13-14. Looking ahead, if the Fed comes across as dovish by suggesting it may pause rate hikes because of recession fears, gold prices could soar another $100 over the near-term.
James Hyerczyk is a U.S. based seasoned technical analyst and educator with over 40 years of experience in market analysis and trading, specializing in chart patterns and price movement. He is the author of two books on technical analysis and has a background in both futures and stock markets.