Natural Gas Futures Test Key Support as Weather and Supply Weigh on Sentiment
U.S. natural gas futures fell to their lowest levels since late August on Tuesday, driven by a combination of soft weather-driven demand and strong supply fundamentals. November futures tested the psychological $3.00/MMBtu mark, placing technical support levels at $2.986 and $2.938 firmly in traders’ sights.
At 17:30 GMT, U.S. Natural Gas Futures are trading $3.028, down $0.090 or -2.89%.

Is Weather Failing to Support a Seasonal Rally?
Mild weather patterns continue to suppress national demand. According to NatGasWeather, the Oct. 13–19 forecast features only moderate cooling across the West and Northeast, with widespread warmth elsewhere — including 90s in Texas.
The 8–15 day forecast also lacks any aggressive cold signals, keeping demand projections on the lighter side. While cooling trends are on the map, they aren’t strong enough to spark a meaningful shift in sentiment, and the limited presence of 90s across the South fails to drive late-season cooling demand.
Production and Inventory Keep Pressure on Prices
Despite prices testing the lower end of recent ranges, the broader fundamentals remain bearish. U.S. production, though slightly below its 30-day average, remains elevated.
Marketed natural gas output is now forecast to exceed 118 Bcf/d by 2026, with stronger-than-expected contributions from Appalachia, the Permian, and Haynesville.
Natural Gas Price Forecast
Every new Natural Gas analysis as it publishes, today's technical signal and key levels, live price — on one page.
See all Natural Gas forecastsRecent additions like the Mountain Valley Pipeline are also unlocking growth potential in the Northeast, improving takeaway capacity and enabling producers to bring more volumes to market.
Strong LNG Demand Isn’t Offsetting Domestic Bearishness
LNG feed gas demand remains near record levels, but that bullish input is failing to outweigh bearish weather and production sentiment. While U.S. export activity has been strong, domestic balances continue to favor oversupply.
Additionally, analysts have adjusted Henry Hub price forecasts lower, now projecting $4.10/MMBtu for January — down almost 50 cents from earlier estimates. This revision reflects stronger production expectations, especially from the three key shale regions.
Will Resistance at the 50-Day MA Cap Any Rally?
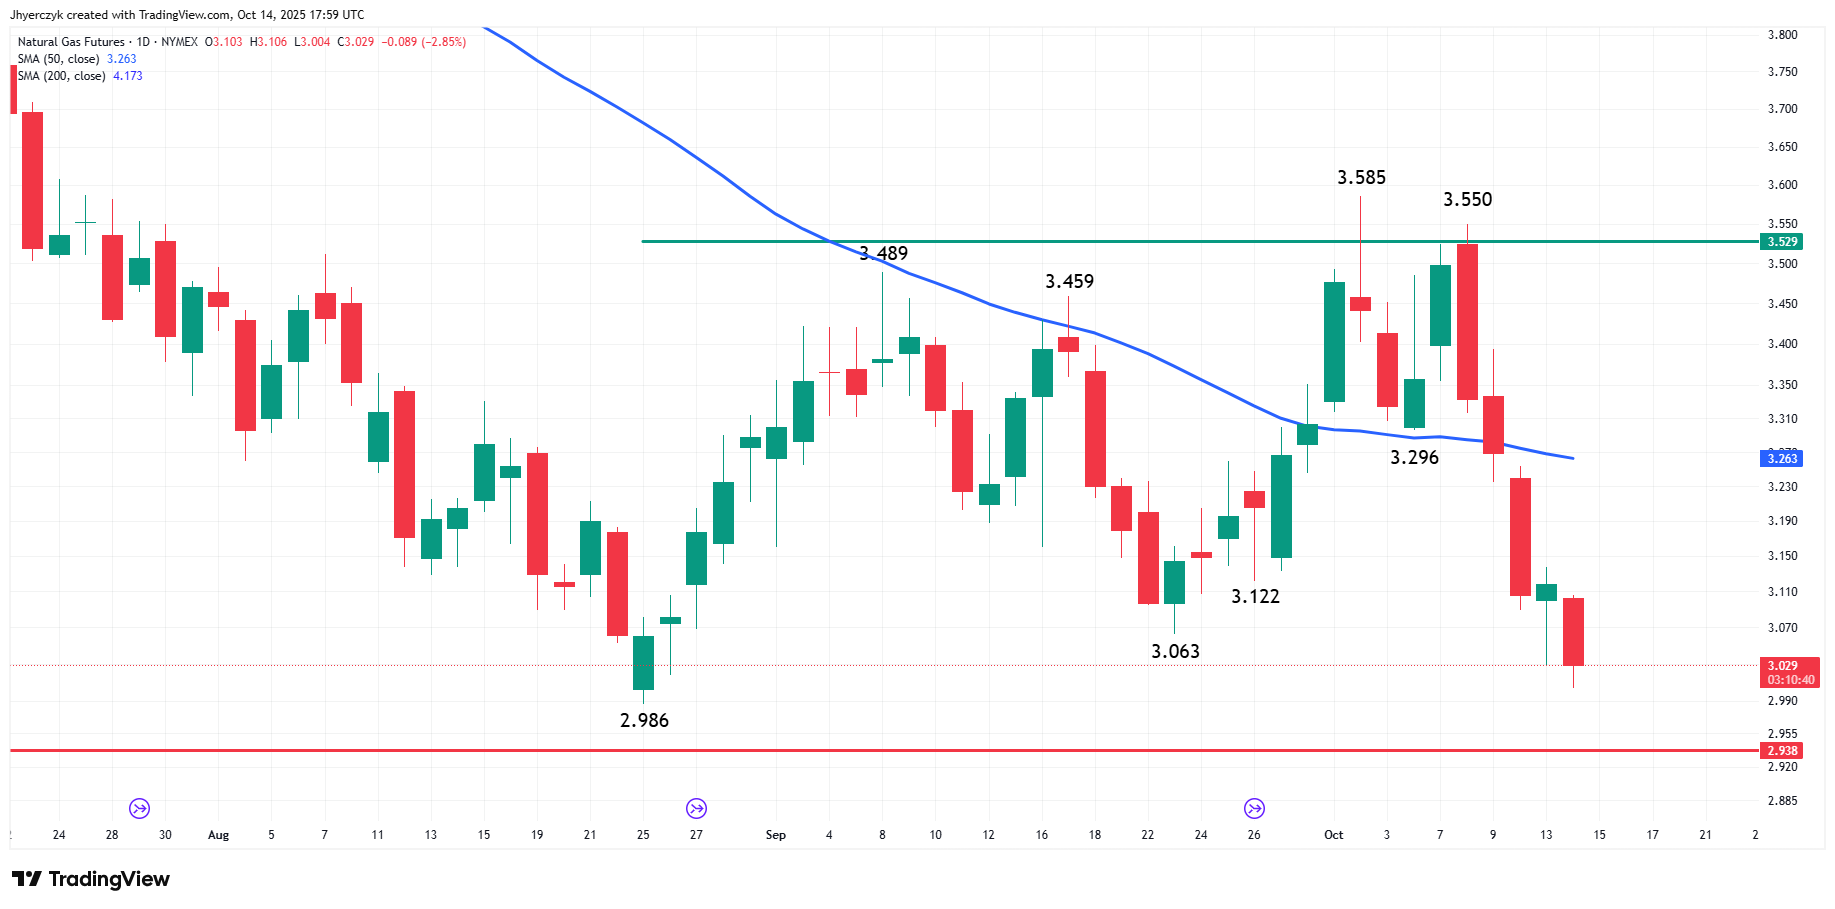
Technically, even if a reversal forms off recent lows, the 50-day moving average near $3.262 represents a major resistance zone. Traders are likely to sell into rallies approaching this level, limiting the upside unless supported by a material weather or demand shift. Unless colder temperatures emerge or production drops meaningfully, rallies may remain capped.
Market Forecast: Bearish Near-Term Outlook Holds
With mild weather on tap, ample production, and waning price support, the near-term outlook remains bearish. Traders should watch for support near $2.986 and $2.938, but without a significant shift in demand or a supply disruption, the market lacks a clear bullish catalyst.
More Information in our Economic Calendar.