



Market Overview
During the Asian session, the U.S. dollar initially climbed following a stronger-than-expected June Nonfarm Payrolls (NFP) report but later eased to 96.88.
The data briefly reduced expectations of a July rate cut, though fiscal imbalances and geopolitical uncertainty continue to limit the dollar’s upside.
Labour Market Remains Resilient, Fed Outlook Shifts
The U.S. economy added 147,000 jobs in June, exceeding forecasts of 110,000 and slightly above May’s revised 144,000. Unemployment fell to 4.1%, while weekly jobless claims dropped to 233,000, a six-week low. Wage growth slowed to 0.2%, easing concerns about inflation.
In response, the 10-year Treasury yield rose six basis points to 4.34%, reflecting firmer confidence in the economic outlook and diminishing the likelihood of a near-term Fed cut.
Trade Developments Offer Mixed Signals
While global trade tensions persist, a recent U.S.–Vietnam deal helped calm markets ahead of the July 9 tariff deadline.
Early signs of improvement in U.S.–China relations, including eased tech restrictions and relaxed rare earth controls, also provided modest support.
GBP/USD Price Forecast
Every new GBP/USD analysis as it publishes, today's technical signal and key levels, live price — on one page.
See all GBP/USD forecastsHowever, ongoing pressure on key U.S. trade partners sustains broader market uncertainty.
US Dollar Index (DXY) – Technical Analysis
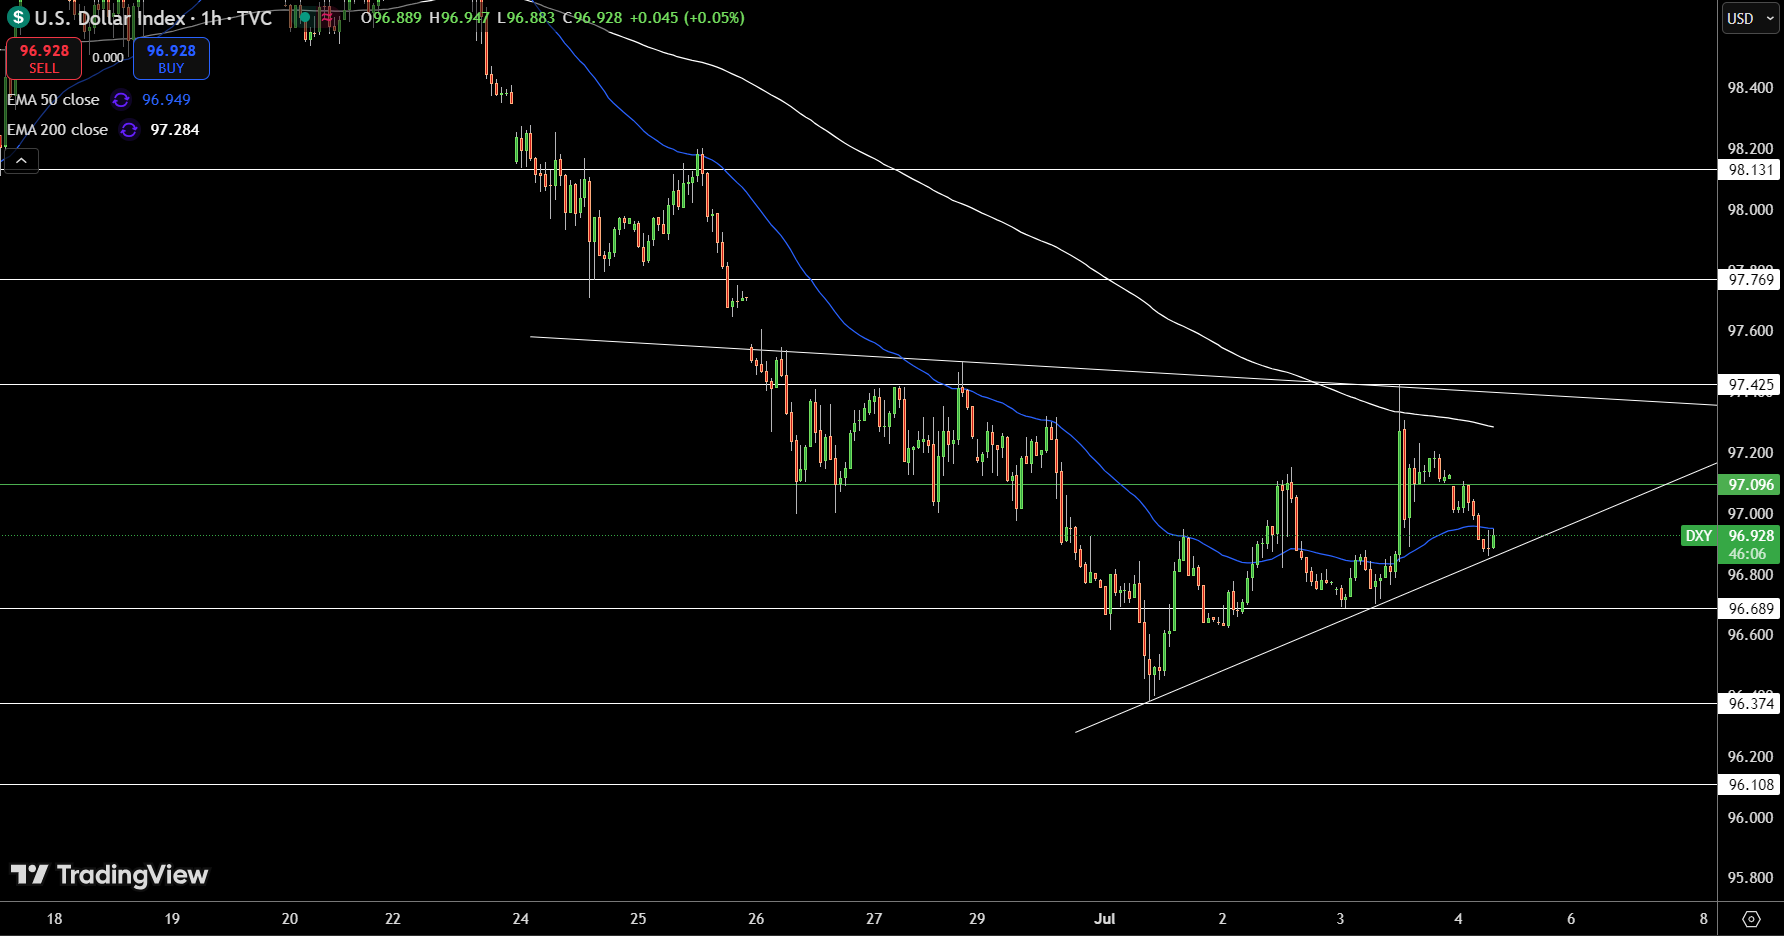
The U.S. Dollar Index (DXY) is currently trading near 96.93, consolidating just above the ascending trendline support drawn from the July low. Despite a short-lived spike toward 97.42, the index has failed to hold above the 50 EMA (96.94), and continues to trade below the 200 EMA (97.28)—a signal that bears still have control in the broader trend.
Momentum has slowed as DXY approaches the apex of a tightening wedge. If bulls manage a breakout above 97.10–97.42, the next resistance sits at 97.76 and 98.13. However, a break below 96.80 and trendline support could drive the index down toward 96.37 and 96.10.
GBP/USD Technical Analysis
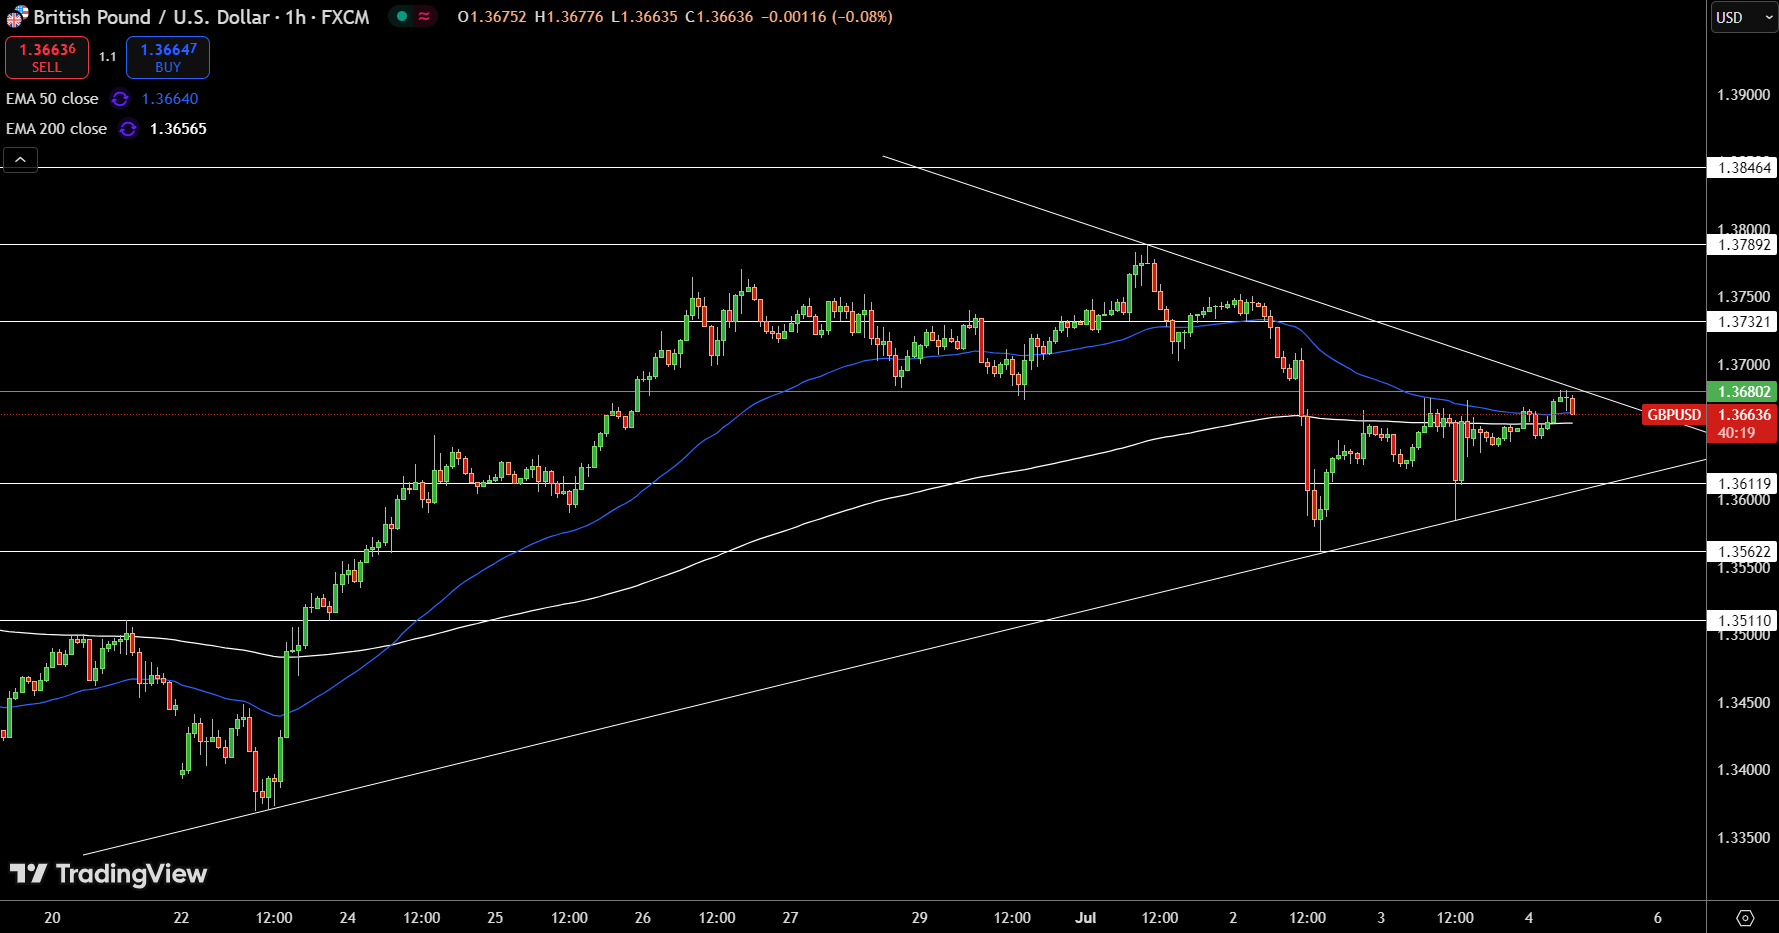
The GBP/USD pair is trading around $1.3663, testing the upper boundary of a symmetrical triangle pattern that has been forming since mid-June. Price is hovering just above the 50 EMA ($1.3664) and slightly above the 200 EMA ($1.3656) on the 1-hour chart—creating a narrow zone of consolidation with breakout potential.
A decisive move above $1.3680 could trigger bullish momentum, targeting $1.3732 and $1.3789, with further upside potential if momentum accelerates. On the other hand, a failure to break out may pull the price back toward $1.3611 or $1.3562, key support levels within the triangle.
EUR/USD Technical Forecast
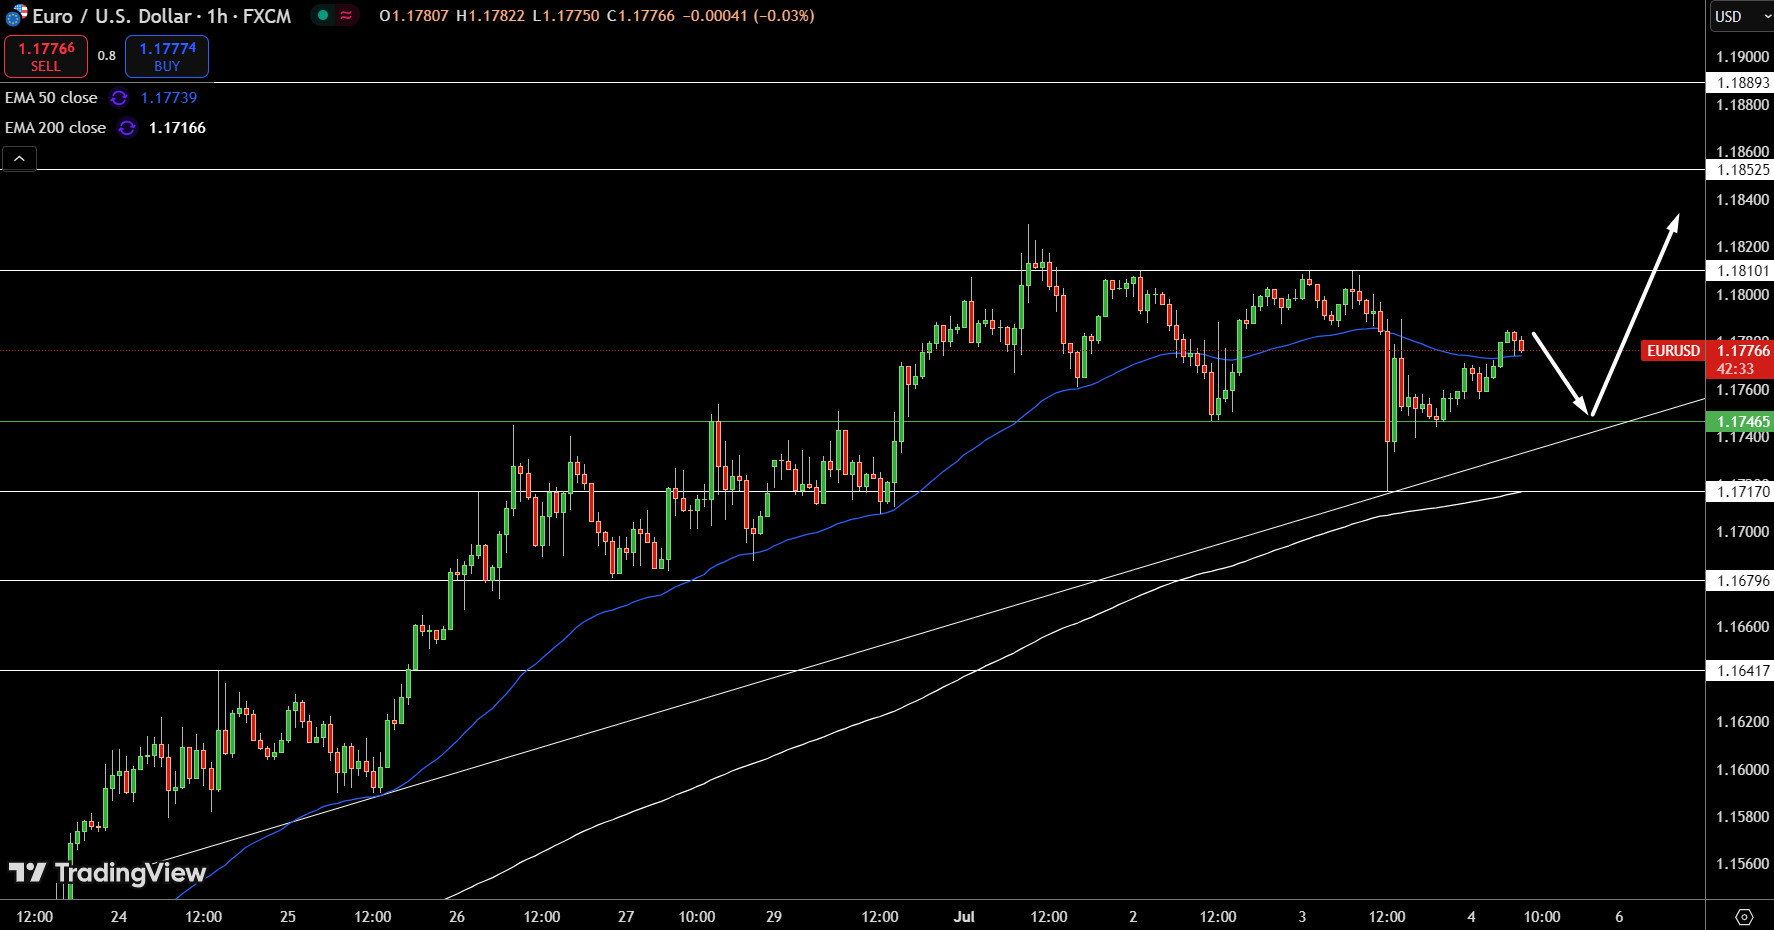
The EUR/USD pair is trading around $1.1777, facing immediate resistance at the 50 EMA ($1.1774) and holding just above short-term support at $1.1746. Price action suggests indecision, as buyers and sellers battle around the confluence of the 50 EMA and the horizontal support zone.
The pair maintains a broader bullish bias, supported by the ascending trendline and the 200 EMA, which is currently located at $1.1716. If price breaks below $1.1746, the rising trendline around $1.1720 will be critical to watch for a bounce.
A bullish continuation scenario requires a decisive close above $1.1810, targeting $1.1852 and potentially $1.1889. Meanwhile, failure to hold above $1.1746 could drag the pair down toward $1.1710 and $1.1679.