
Advertisement
Advertisement
What Really Drives Gold, Silver, and Precious Metals Prices (And How to Find Your Edge)
By:
Key Points:
- Precious metals prices ultimately come down to supply and demand, but each metal has its own unique drivers
- Gold behaves primarily as a monetary asset, responding to interest rates, inflation, and financial uncertainty
- Silver and platinum group metals have significant industrial demand, creating different price patterns and opportunities

I’ve got a confession to make.
Back in 2012, I was absolutely convinced gold was going north of $3,000 an ounce. The Fed was printing money like crazy, inflation seemed inevitable, and the European debt crisis was spiralling. I went all-in on gold miners, certain my macroeconomic brilliance would make me rich.
Instead, gold topped out under $2,000 that year, then spent the next four years in a brutal bear market. My mining stocks got absolutely crushed.
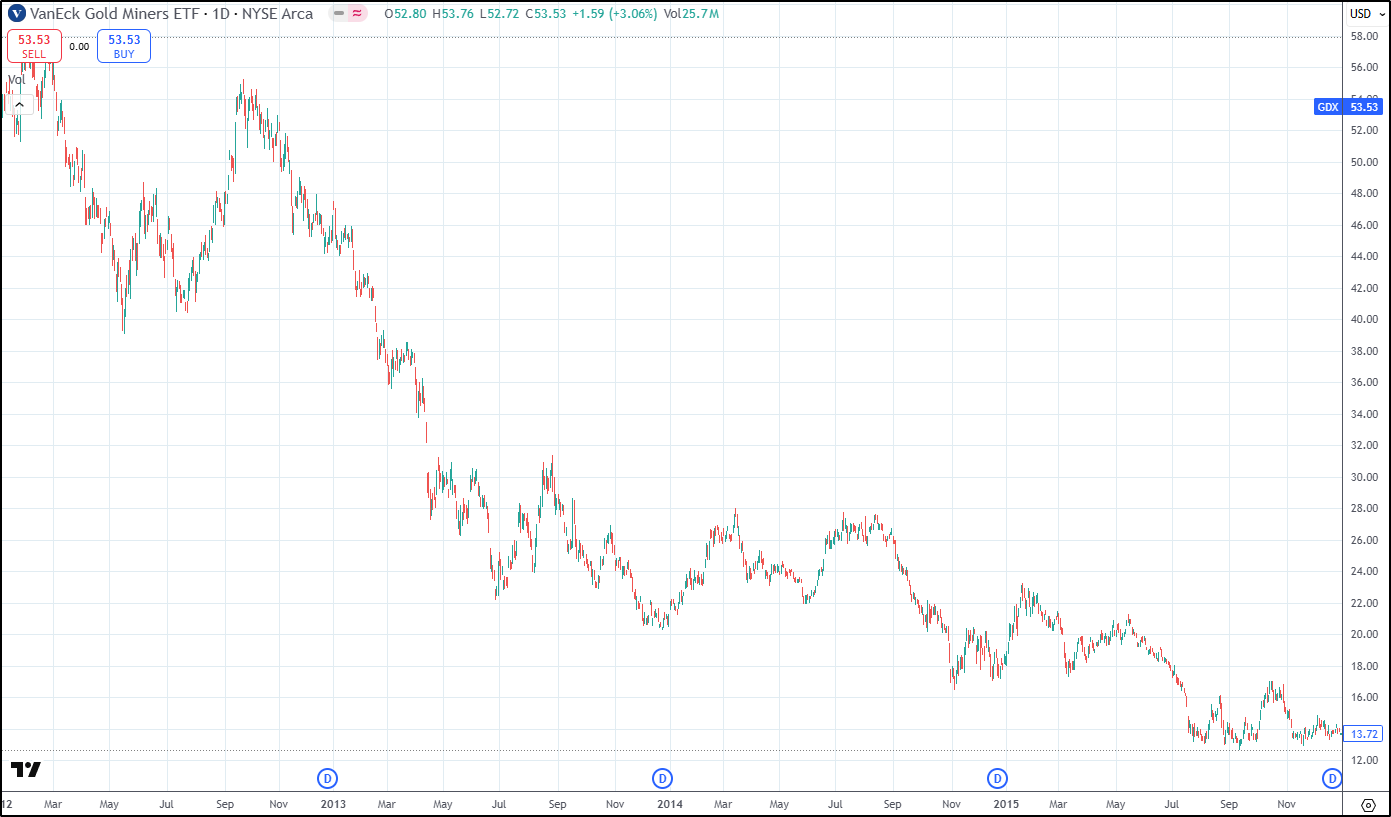
Gold mining stocks in the aftermath of my 2012 bet. Chart: TradingView
The humbling lesson? I wasn’t smarter than the market. Not even close.
This experience taught me something crucial about trading: understanding the fundamentals is important, but thinking you can out-predict a market with billions in institutional money is delusional.
So let’s talk about what actually drives gold, silver, and platinum group metals (PGMs) – and more importantly, how you might find a genuine edge in these markets.
It’s Always About Supply and Demand
Strip away all the complexity, and precious metals prices – like everything else – come down to supply and demand.
If more people want to buy gold than sell it at a given price, the price goes up. If more want to sell than buy, the price goes down.
Every factor we’ll discuss, from interest rates to industrial applications to geopolitical tensions, ultimately influences prices by changing how much people want to buy or sell.
This is important to remember because it’s easy to get lost in complex analysis and forget this fundamental truth.
Gold: The Monetary Metal
Unlike almost every other commodity, gold’s primary purpose isn’t industrial – it’s monetary. Only about 10-15% of gold demand comes from industrial applications. The rest is investment, jewelry (which in many countries is a form of investment), and central bank purchases.
This gives gold some unique price drivers:
1. Real Interest Rates
This is by far the most important factor for gold prices. Not nominal interest rates, but real rates – nominal rates minus inflation.
Why? Because gold pays no yield.
When you own gold, you’re giving up the interest you could earn from bonds or cash deposits. When real interest rates are high, this opportunity cost is significant. When real rates are low or negative, this opportunity cost disappears or even reverses.
The data shows a strong, albeit imperfect, inverse correlation between real yields (especially the 10-year TIPS yield) and gold prices.
Look at 2020-2021 – when real 10-year Treasury yields turned negative, gold surged. As the Fed started hiking rates aggressively in 2022, gold temporarily stalled.
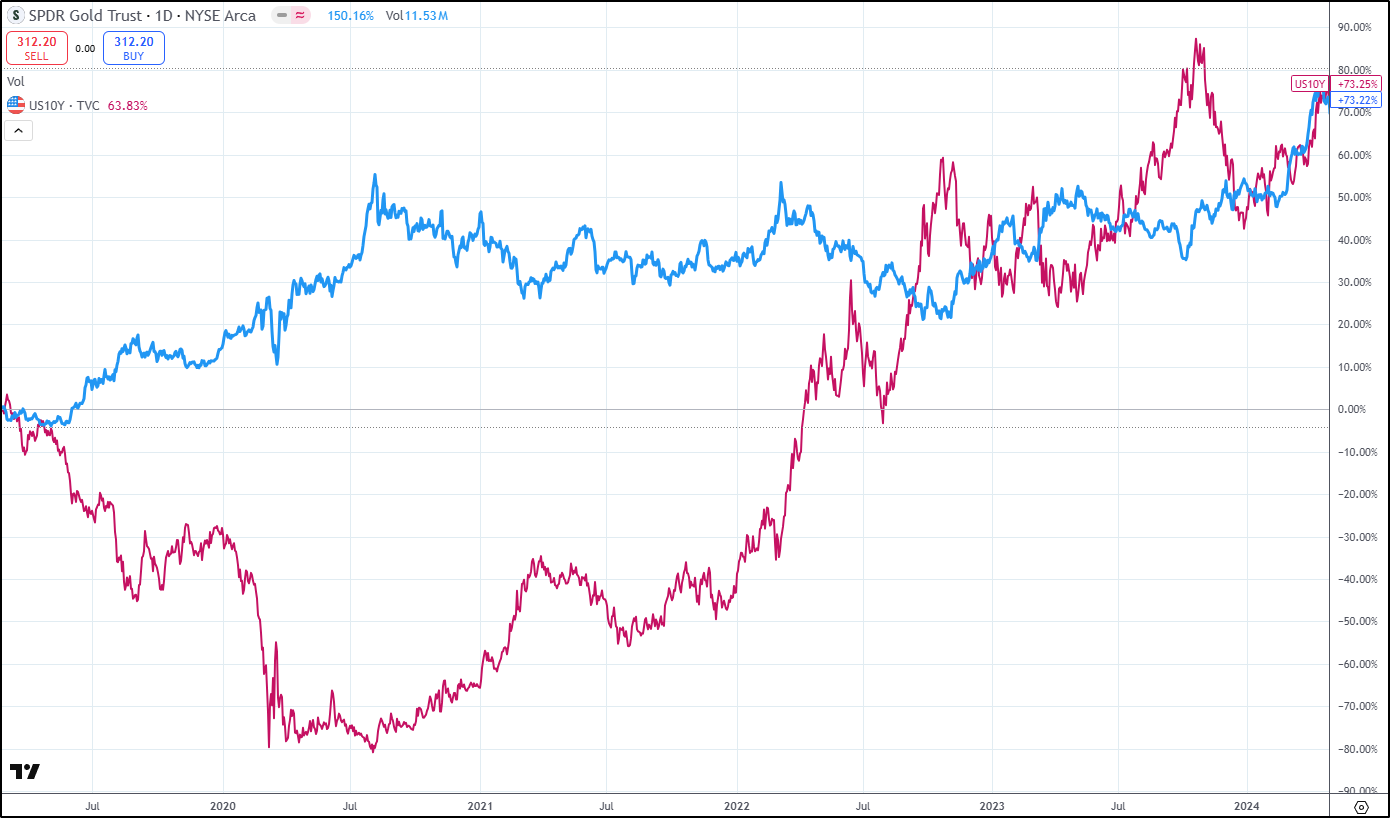
GLD ETF returns (blue) vs Per cent change in US 10-year yields (maroon) 2020-2024. Chart: TradingView
2. Central Bank Buying
Central banks have been net buyers of gold since 2010, with purchases accelerating in recent years. In 2023, they bought a staggering 1,136 tonnes – about 25% of the annual supply.
This trend reflects a desire to diversify reserves away from dollars and euros, particularly among emerging market central banks. China, Russia, Turkey, and India have been major buyers.
What makes this important for traders is that central bank buying creates a significant price floor. Each 100-tonne purchase correlates with a 4-6% increase in gold prices.
3. Currency Movements (Especially USD)
Gold is priced in dollars, creating an inverse relationship with the dollar index (DXY).
When the dollar strengthens, gold becomes more expensive for foreign buyers, potentially reducing demand. When the dollar weakens, gold becomes cheaper for non-dollar holders.
There are exceptions, though. During extreme risk-off events, gold and the dollar sometimes rally together, as both are considered safe havens.
4. Market Fear and Uncertainty
Gold’s reputation as a “crisis hedge” or “safe haven” is well-deserved. During geopolitical shocks, banking crises, or market crashes, gold typically outperforms.
Consider what happened during the Covid pandemic and the GFC (post-2009).
Silver: The Hybrid Metal

Silver is fascinating because it’s both a monetary and an industrial metal. About 50% of silver demand comes from industrial applications, with the rest split between investment, jewelry, and silverware.
This dual nature creates some interesting price dynamics:
1. Industrial Demand (Especially Electronics and Solar)
Silver’s exceptional conductivity makes it essential for electronics, and its use in solar panels has grown dramatically.
In 2023, industrial use hit a record 632 million ounces, with solar panels alone accounting for about 12% of total demand (roughly 136 million ounces).
This creates a linkage between silver prices and economic growth, particularly in electronics-heavy sectors and renewable energy.
2. Gold Price Movements
Despite its industrial uses, silver still moves with gold most of the time. The gold-silver ratio (how many ounces of silver equal one ounce of gold) fluctuates, but the correlation between the two metals remains strong.
When gold surges on monetary factors, silver typically follows, often with more volatility, earning it the nickname “poor man’s gold.”
3. Supply Constraints
Unlike gold, which has enormous above-ground stocks relative to annual production, silver’s industrial consumption means much of it is used up rather than stored.
Mine supply has been relatively flat, with 2023 output actually falling 1%. This creates the potential for tighter physical markets, especially when investment demand surges unexpectedly.
Platinum Group Metals: The Industrial Workhorses

Platinum and palladium have very different price drivers from gold, with automotive catalytic converters dominating demand.
1. Automotive Demand
About 40% of platinum and 80% of palladium goes into catalytic converters for vehicles. This creates a direct link between auto sales and PGM prices.
Platinum is used primarily in diesel catalysts, while palladium is used in gasoline vehicles. This distinction created dramatically different price patterns as diesel lost favor after various emissions scandals.
2. Supply Concentration
Production is highly concentrated geographically:
- South Africa produces about 70% of platinum
- Russia produces about 40% of palladium
This concentration creates significant supply risk. Labour strikes in South Africa or sanctions on Russia can dramatically impact global supply.
3. Substitution Effects
When the price gap between platinum and palladium gets too wide, automakers can substitute one for the other (with some technical adjustments).
This created a fascinating dynamic in 2023, when platinum replaced 615,000 ounces of palladium in catalytic converters, leveraging a $900/oz price discount.
4. Future Technology Shifts
The transition to electric vehicles threatens traditional PGM demand, as battery EVs don’t need catalytic converters.
However, hydrogen fuel cell vehicles use significant platinum (0.5-0.6 oz per vehicle), potentially creating new demand if that technology scales up.
Why You Can’t Out-Predict the Market
With all these complex, interacting factors, it’s not likely that you or I could consistently out-predict professional metals analysts, central bank strategists, and hedge fund researchers who do this full-time.
The precious metals market is a forward-expectations pricing machine. It’s constantly incorporating new information and adjusting prices based on what participants expect to happen.
Consider this: When the Fed signals a potential rate cut, gold doesn’t wait until the cut actually happens. It jumps immediately as traders incorporate this new information into their expectations.
As a solo trader, you’re very unlikely to have information the market doesn’t already know, or analytical capabilities that surpass the professionals.
I learned this lesson the hard way with my gold miners debacle. Despite having a reasonable macro thesis, I failed to appreciate that:
- The market had already priced in much of the inflation risk
- I was overconfident in my ability to understand the technical supply-demand dynamics
- My timing was off, even if the long-term direction was correct
Where Your Real Edge Might Be
So if you can’t out-predict the market on macro factors, where’s your edge?
It’s in understanding and exploiting structural imbalances. Places where natural buyers and sellers create supply-and-demand patterns that recur predictably.
Here are some specific patterns worth exploring:
1. Seasonal Jewelry Demand
Gold jewelry demand follows predictable seasonal patterns, especially in major consuming countries like India and China.
Indian wedding season (October-December) and festival demand create recurring buying patterns. Chinese New Year similarly drives reliable demand in January/February.
These patterns can create tradable opportunities, not because they’re unknown (everyone knows Indian wedding season drives gold demand), but because the physical metal flows create structural pressures in futures markets.
2. EFP (Exchange for Physical) Arbitrage
The relationship between spot gold prices and futures contracts occasionally gets distorted by physical market constraints.
When these distortions happen, EFP transactions – where traders exchange futures positions for physical metal – can create opportunities for those with access to both markets.
During the COVID disruptions in 2020, the spread between COMEX futures and London spot gold blew out to over $70/oz, creating huge opportunities for arbitrageurs. Something similar happened in February 2025 on tariff fears.
3. Option Expiration Effects
The monthly expiration of options on precious metals futures creates predictable patterns of hedging activity by market makers.
By tracking open interest in key strike prices, you can sometimes anticipate price “magnets” or “repellent zones” around expiration dates. Realistically, this is not likely to give you much edge as a solo trader, though it’s an interesting effect.
4. Futures Roll Dynamics
When traders roll positions from one futures contract to the next, the mechanics of this process can create predictable price patterns.
This is especially true in silver, where the physical supply chain is tighter and the futures market is less liquid than gold.
A Framework for Finding Your Edge

Rather than trying to predict metal prices directly based on macroeconomics, use your understanding of the market to:
- Identify natural buyers and sellers: Who has to trade regardless of price? When do they typically trade?
- Look for structural constraints: What physical, regulatory, or institutional factors create friction in the market?
- Find recurring patterns: Which situations create predictable supply/demand imbalances that the market can’t easily resolve?
- Start small and specialized: Instead of trying to trade “precious metals” broadly, focus on specific effects where you can develop genuine expertise.
- Be patient: The best opportunities often come when everyone else is focused elsewhere.
An Example from My Trading
A few years back, I noticed something interesting in the weekly seasonal patterns of gold.
Returns to gold on Friday are significantly higher than on other days of the week. And they’re negative on Monday.
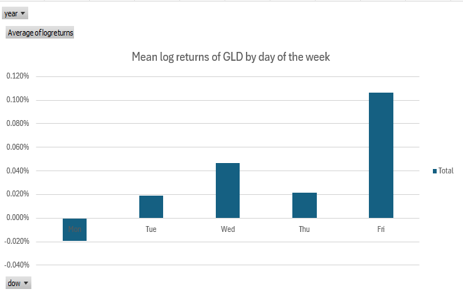
GLD weekly seasonality. Source: robotwealth.com
To be honest, I’m not entirely sure what’s driving this effect (which is one reason I’m hesitant to trade it), but it could be a weekend risk premium.
In general, markets hate the weekend as risk can’t be easily hedged or laid off when markets are closed. So Friday’s anomalous gold returns could simply be due to people buying up gold as a hedge against weekend shocks.
If you dig into this effect, you find that it’s not as strong today as it was ten years ago. That could be due to more and more people finding out about this anomaly and trading it out of the market.
Honestly, I’m on the fence about trading this effect. I did trade it for a while, but as it seems to be petering out, I’m less interested than I once was. Still, it’s a simple, obvious example of where to look for edge – places where people are buying or selling for reasons other than getting the “fair price”.
The Lesson Here
Precious metals markets are driven by complex supply-demand dynamics unique to each metal. Gold responds primarily to monetary factors, silver balances industrial and investment demand, and platinum group metals are heavily influenced by automotive trends.
Understanding these dynamics is valuable, but don’t fool yourself into thinking you can consistently predict price movements better than the market based on fundamental analysis alone.
Instead, use your understanding to identify structural inefficiencies and recurring patterns where you might have a genuine edge.
Remember, you don’t need to predict metal prices to trade these markets profitably. You just need to find pockets of inefficiency created by natural buyers and sellers doing what they need to do.
About the Author
Kris Longmoreauthor
Kris Longmore is the founder of Robot Wealth, where he trades his own book and teaches traders to think like quants without drowning in jargon. With a background in proprietary trading, data science, engineering and earth science, he blends analytical skill with real-world trading pragmatism. When he’s not researching edges, tinkering with his systems, or helping traders build their skills, you’ll find him on the mats, in the garden, or at the beach.


Advertisement