



Bitcoin (BTC) has gone down by 12% in the past 7 days, prompting a strong wave of liquidations across the futures market as key supports have faltered.
The crypto market was already on a downtrend when the last few negative catalysts hit. The first was the Democrats’ victory in the U.S. mid-term elections, as that dealt a strong blow to the industry’s hopes of getting supportive legislation passed in 2027.
This party shot down the Clarity Act earlier this year and will probably oppose any other similar frameworks.
The crypto market interpreted this as a major setback and has revised valuations accordingly. Moreover, this week’s hotter-than-expected inflation print in October led to a revision of analysts’ forecasts for interest rates in the U.S.
Bitcoin ETFs See $2.4 Billion in Net Outflows in 13 Days
Two-thirds of the analysts surveyed by FedWatch now believe that the Federal Reserve will raise rates by 50 basis points in January. This is also a headwind for cryptocurrencies, as higher rates reduce the market’s appetite for risky assets.
As both the political and macroeconomic backdrop have clearly deteriorated, Wall Street has shunned cryptocurrencies. Data from SoSoValue shows that exchange-traded funds (ETFs) linked to Bitcoin have experienced strong net outflows for 7 days in a row.
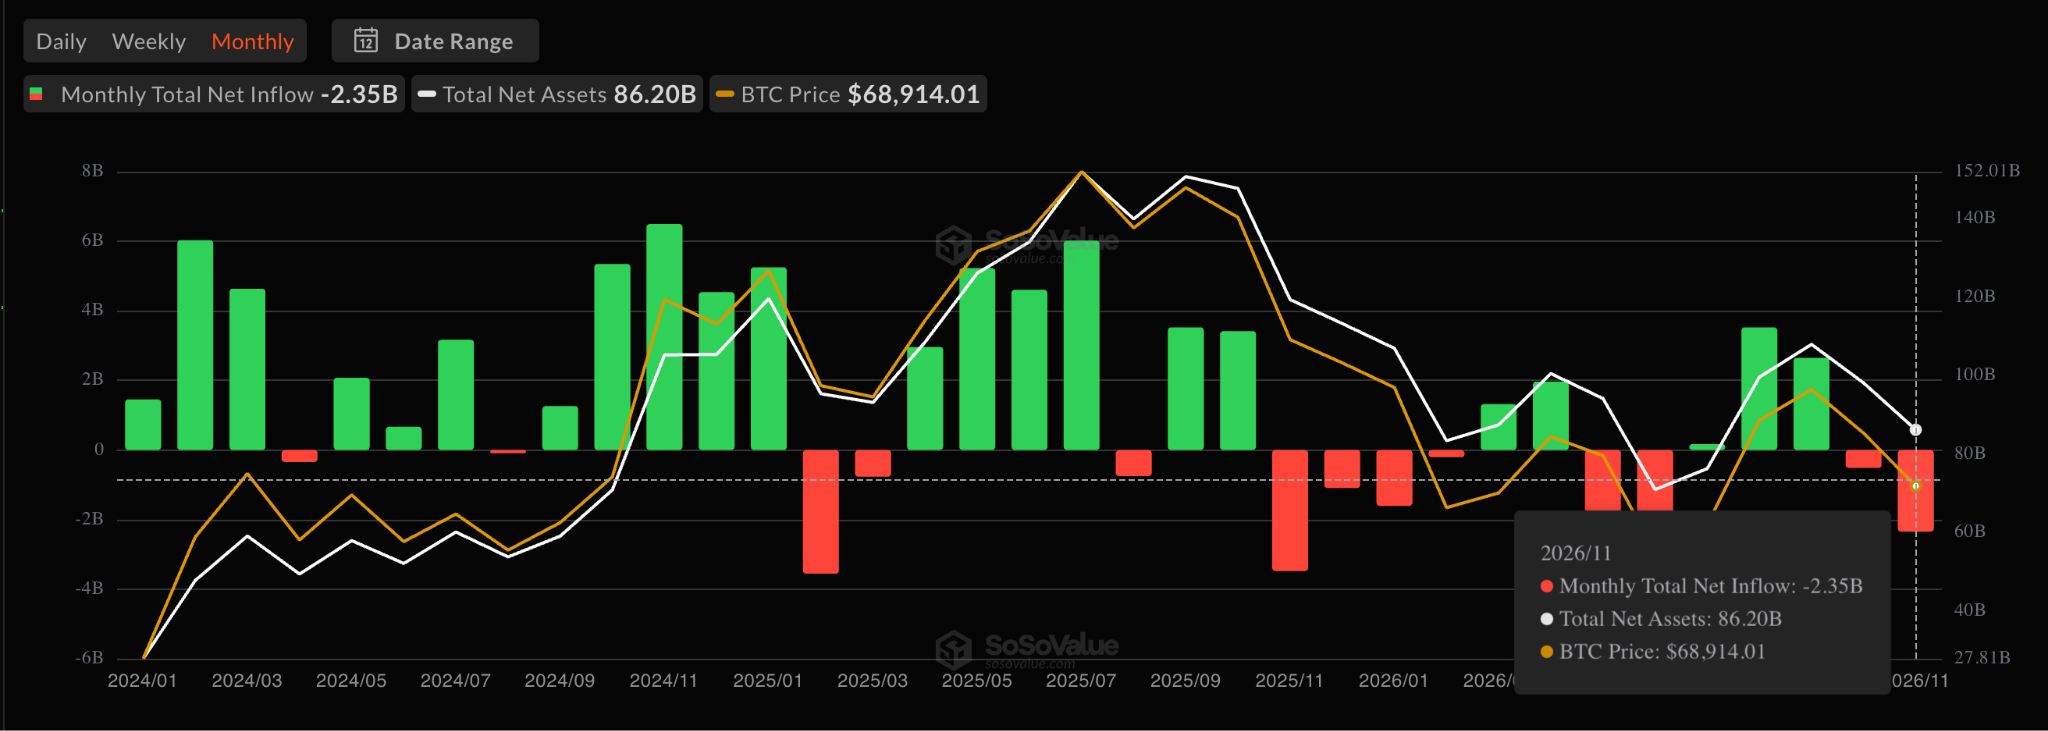
During the first 13 days of November, these vehicles have experienced total withdrawals of $2.4 billion and seem headed to match the total outflows since June 2026, back when BTC hit its lowest price during the last bearish cycle.
Meanwhile, BTC long liquidations have skyrocketed recently, with nearly $700 million worth of these positions being blown up just yesterday as BTC dipped below the $70,000 threshold.
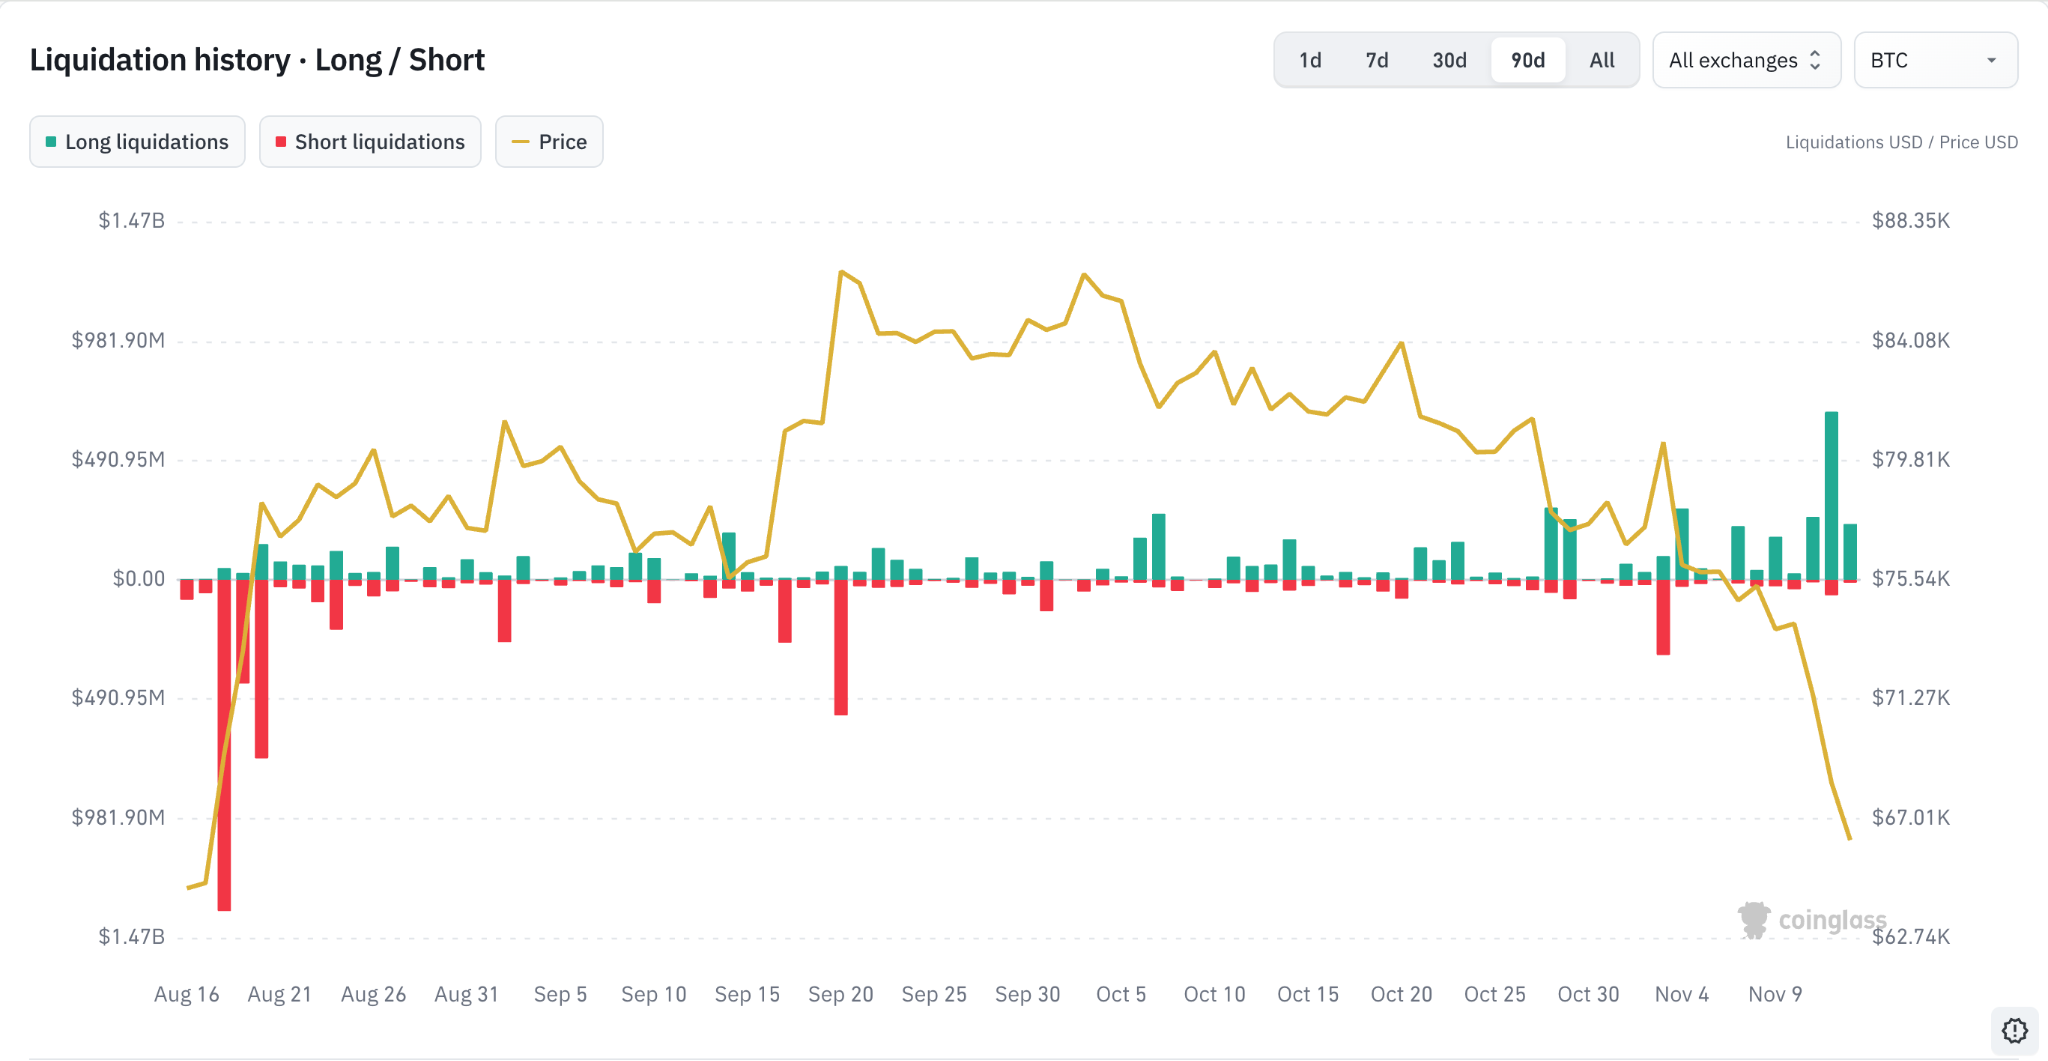
Liquidations of this magnitude tend to exacerbate the downtrend, and could contribute to plummeting the top crypto to levels not seen since June.
Bitcoin Price Forecast
Every new Bitcoin analysis as it publishes, today's technical signal and key levels, live price — on one page.
See all Bitcoin forecastsBitcoin Could Drop to Its Late June Lows After Filling Both of Its Daily FVGs
Turning to the daily chart, the second fair value gap (FVG) in this higher time frame has already been almost totally filled. The $62,500 area looks like the last line of defense for bulls to prevent a retest of the token’s late-June lows.
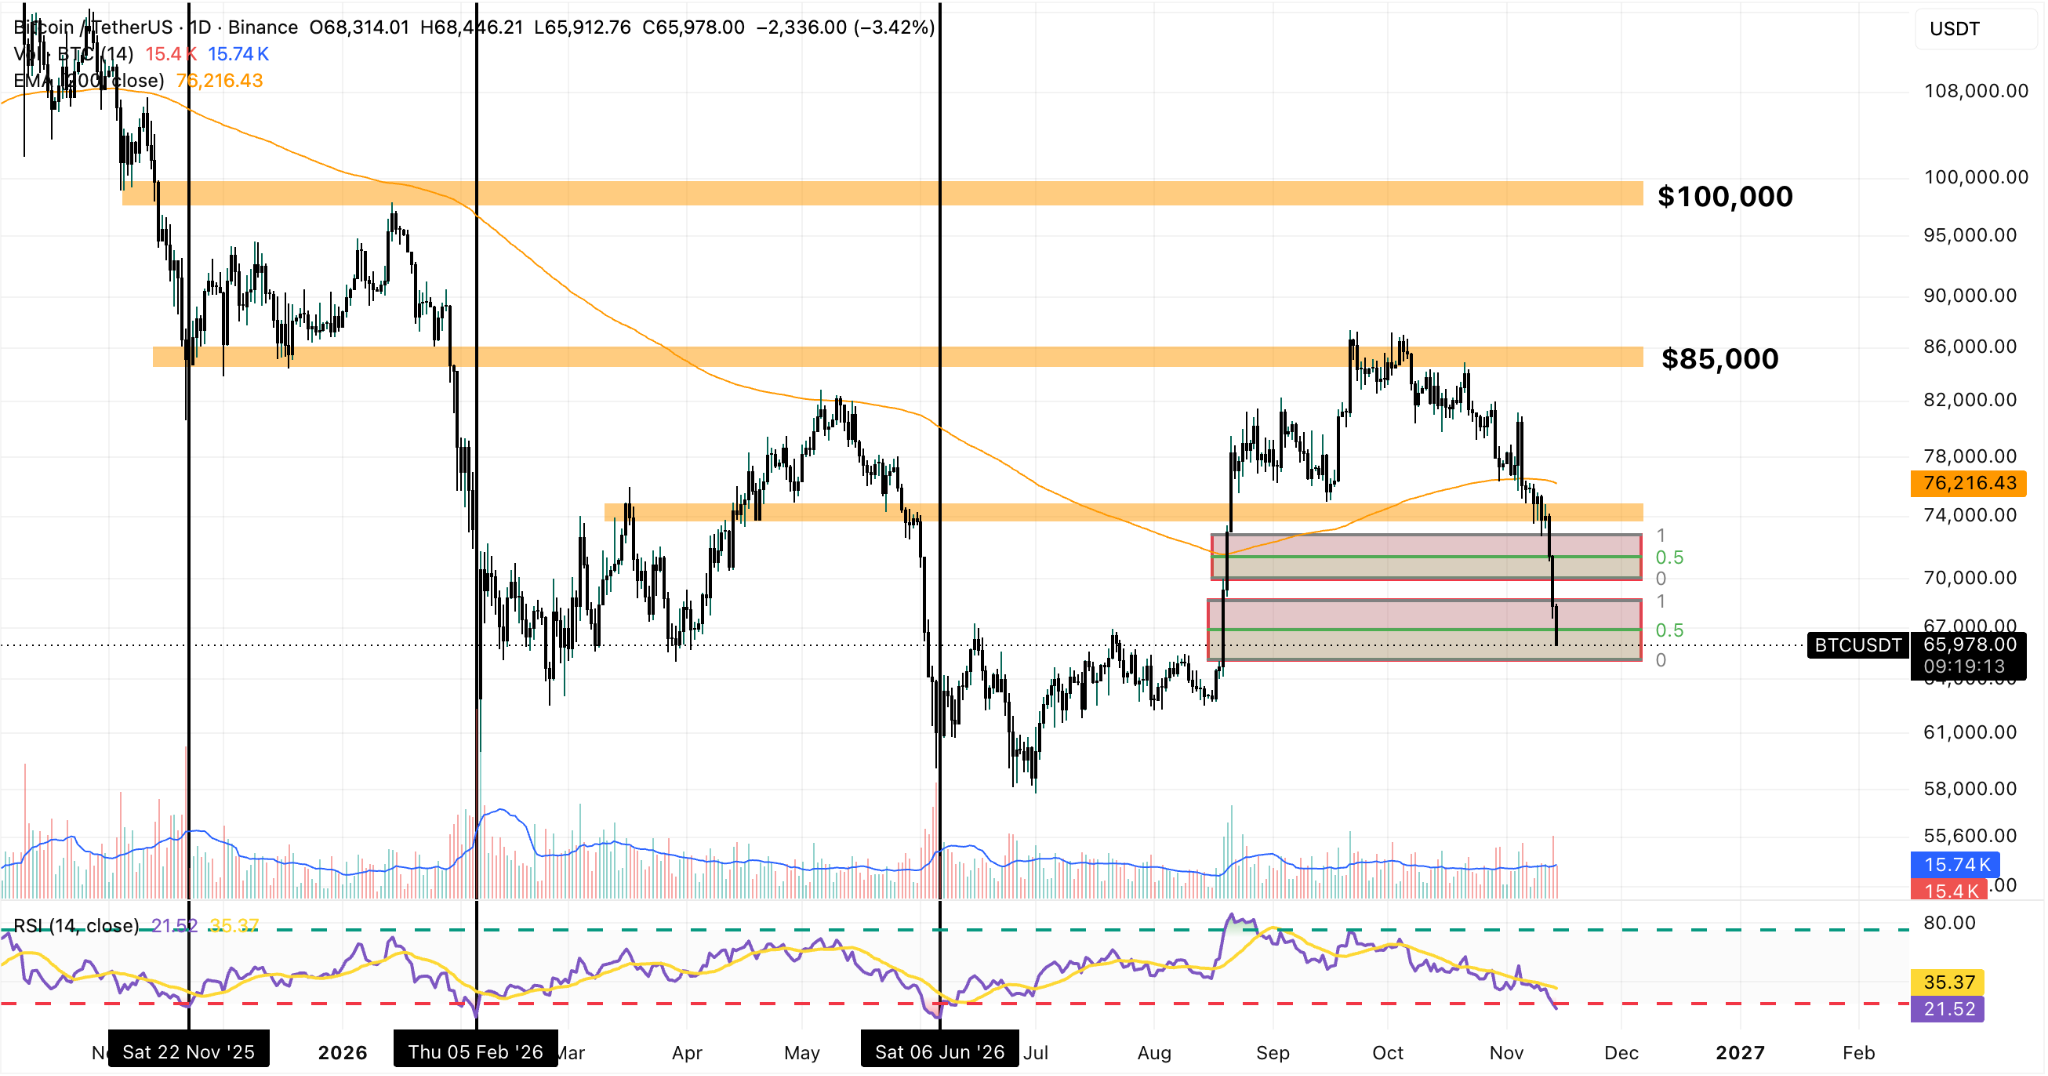
This is the order block that triggered the two FVGs seen in the chart. However, as market conditions have shifted dramatically, we don’t necessarily expect that the volume of buy orders at this level will be as high as it was back then.
If that support is lost, the next stop would probably be the $58,000 area, meaning a 13% downside risk based on today’s price.
However, we will probably see BTC bouncing off any of these key zones in the next few days as the Relative Strength Index (RSI) in the daily chart has entered extreme oversold territory.
This increases the likelihood of a rebound, but we see any bullish moves at this point as an opportunity to short the token rather than evidence of a potential recovery.
Sentiment is at extreme lows once again, with the Crypto Fear and Greed Index sitting at 19 in “Extreme Fear” territory. Considering the current backdrop, this is not entirely unjustified, as the industry has entered an environment marked by increased political opposition and rising interest rates.
For long-term investors, this might be a good opportunity to grab some BTC at low prices. However, in the near term, the downtrend could still intensify in the next few weeks.