


Bitcoin (BTC) has dropped by 1.5% in the past 24 hours to $80,000 but remains within our buy zone, following the U.S. Federal Reserve’s decision to keep rates unchanged on Wednesday.
As expected, the Federal Open Market Committee (FOMC) delayed its decision to hike rates, even though inflation in September rose beyond analysts’ estimates.
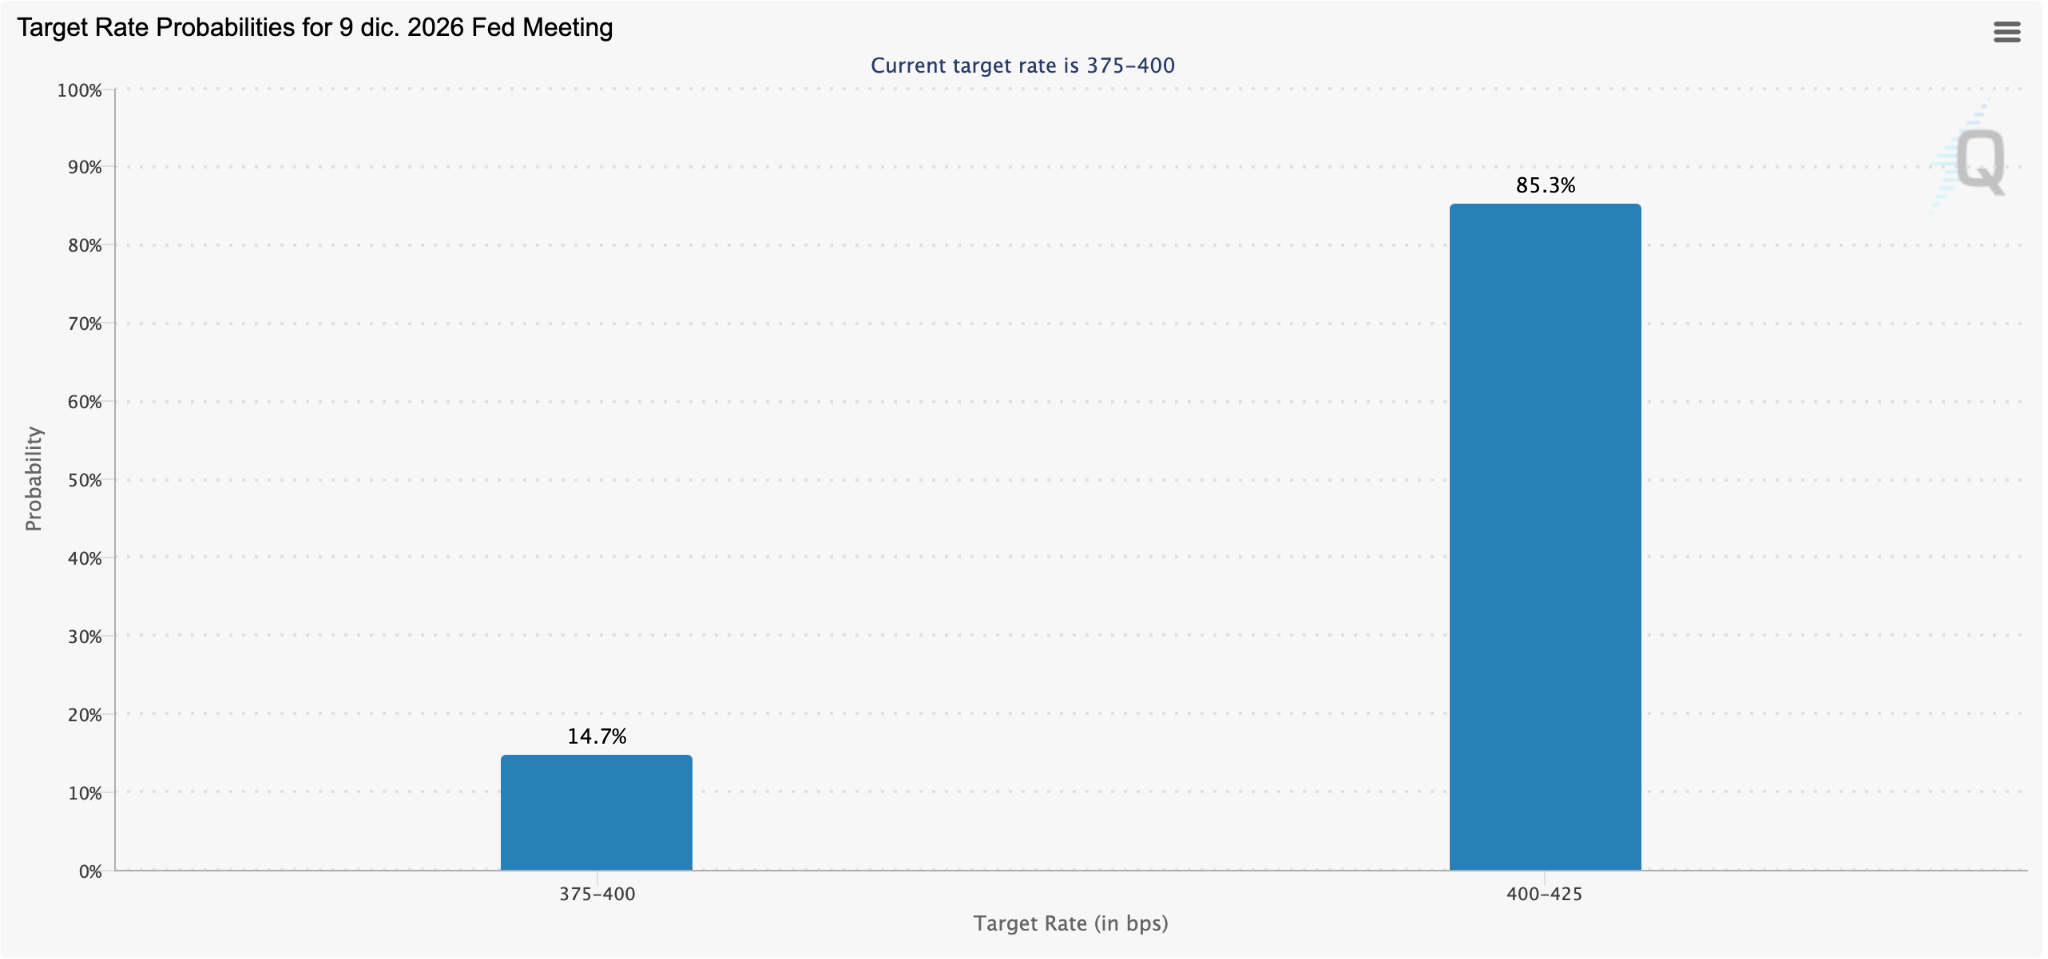
The majority of analysts expect that the next rate hike will take place during the December meeting. As per FedWatch’s data, the chances of that happening are currently sitting at 83%.
With more than a month to go until the FOMC convenes again, the crypto market finally has some breathing room and may reduce its focus on macroeconomic variables and turn its eyes toward Bitcoin’s technicals.
Wall Street and Whales Are Positioning for the Continuation of BTC’s Rally
Wall Street appears to be positioning for the continuation of the token’s rally, as net inflows to exchange-traded funds (ETFs) have been positive and strong in the last 6 out of 8 sessions.
This week alone, these vehicles have brought in $423 million, while they have received a total of $728 million in the past 8 days. This could be evidence of an ongoing shift in sentiment following the Fed’s decision.
Apart from the accumulation we are seeing in the ETF market, whale wallets have also been increasing their exposure to Bitcoin.
On-chain data from Santiment shows that wallets holding between 1 and 100,000 tokens have bought 90,000 BTC in October, creating a strong floor at $80,000.
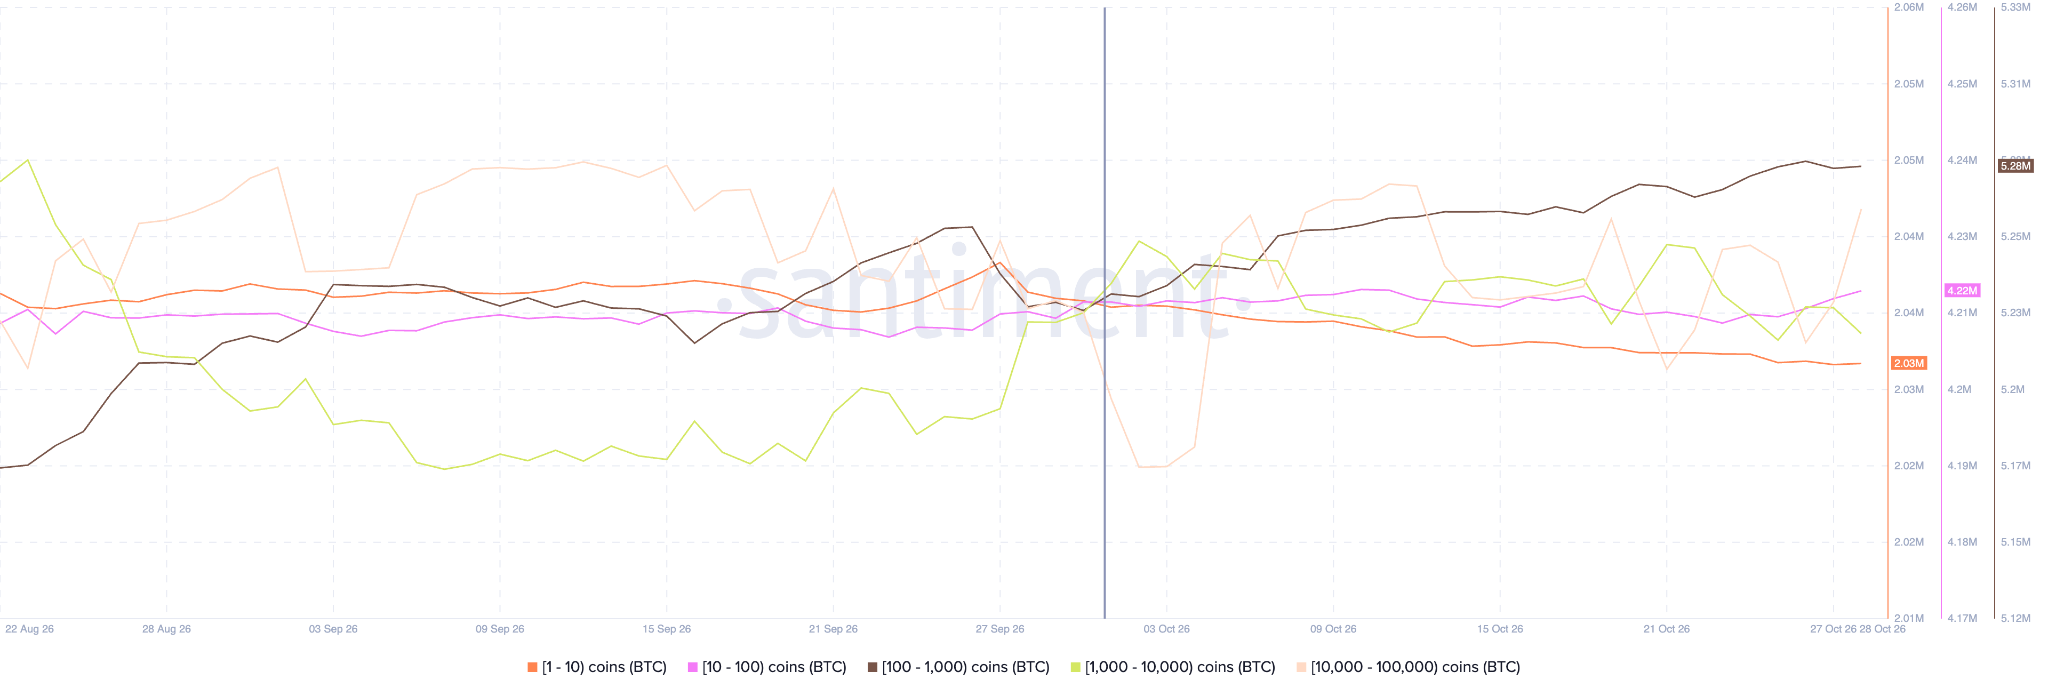
We believe that these are indications that the smart money is positioning for the continuation of BTC’s mid-September rally in November.
Bitcoin Price Forecast
Every new Bitcoin analysis as it publishes, today's technical signal and key levels, live price — on one page.
See all Bitcoin forecastsWeekly Chart “Buy” Signal Still in Play Despite Latest Setback
The weekly chart shows that BTC continues to follow the path of a historical pattern that has yielded positive results in the past 11 years.
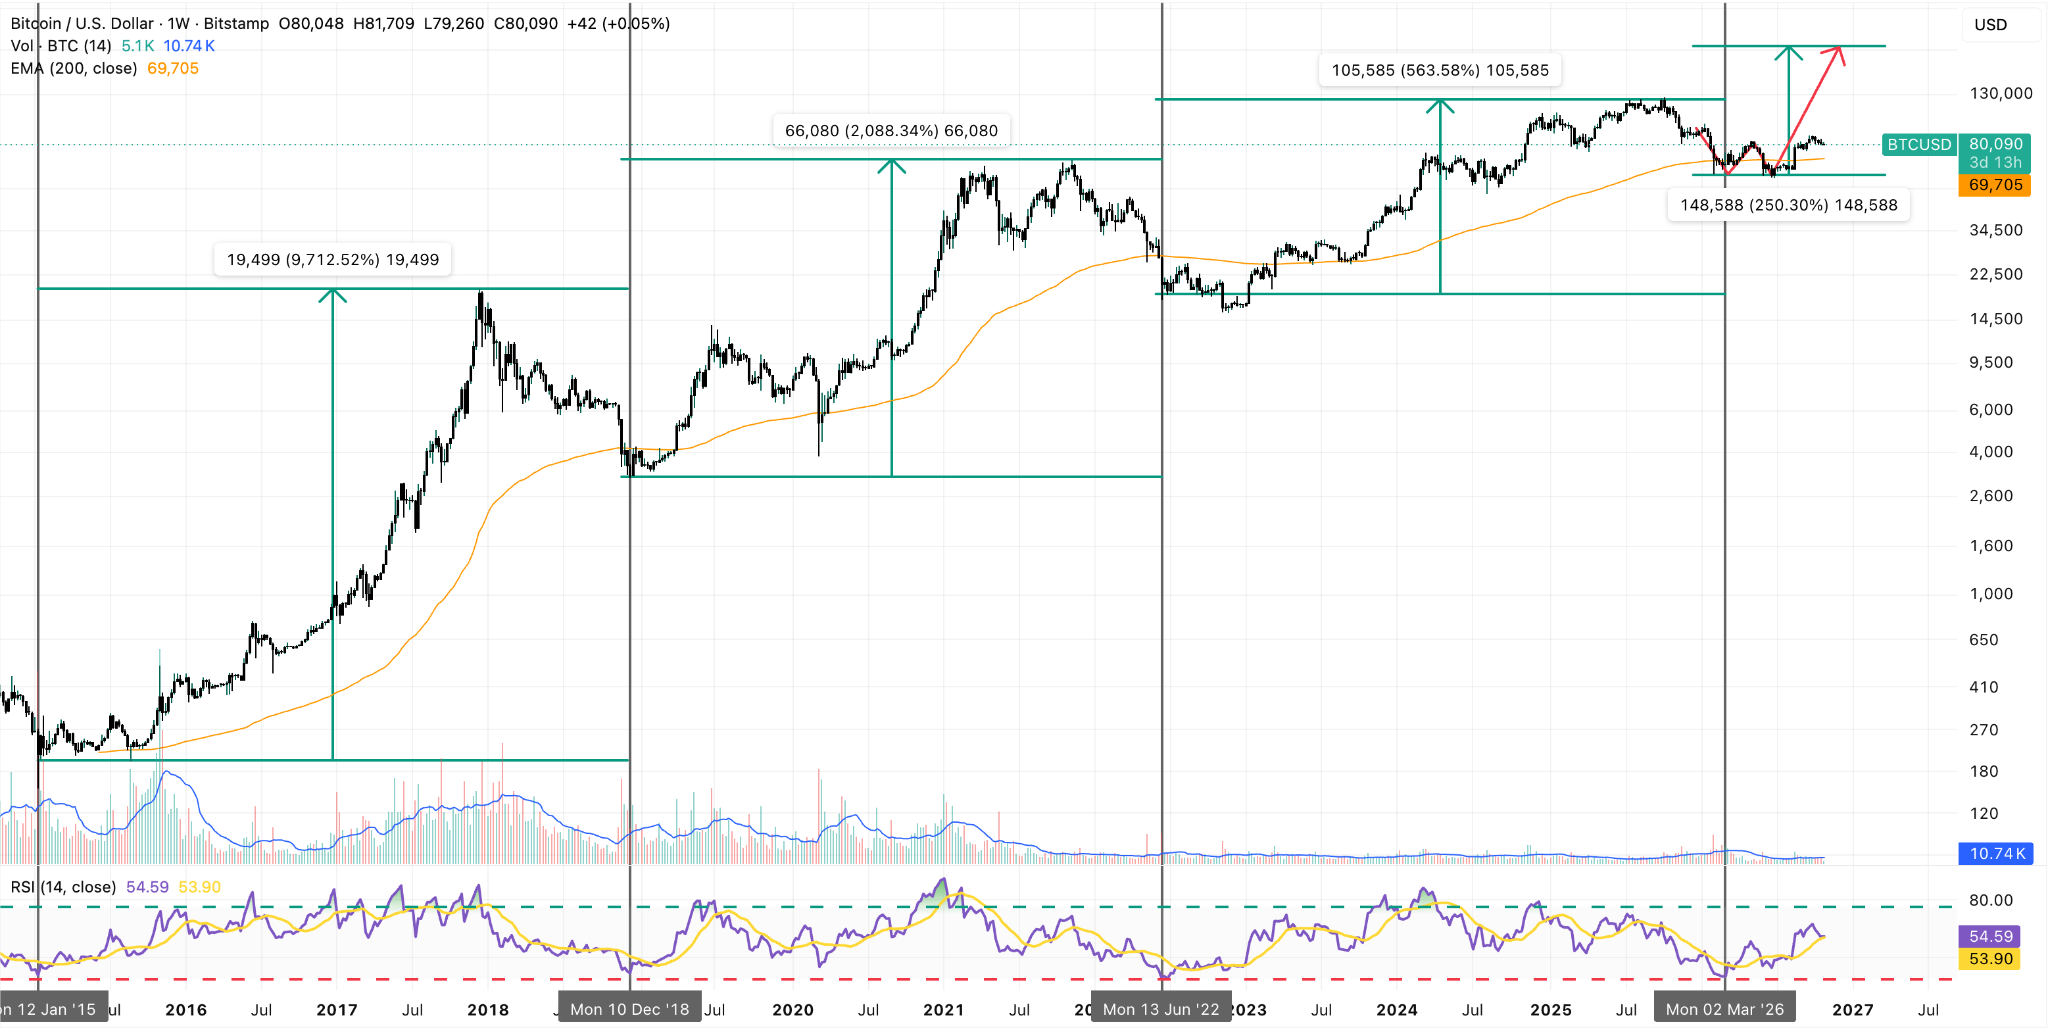
A buy signal was triggered after the Relative Strength Index (RSI) dropped below 30 in this higher time frame. This was the first time that this happened since 2022. The oscillator has been on an uptrend since then, indicating that positive momentum is accelerating.
On previous occasions, the rally has accelerated once the price dips below the 200-week exponential moving average (EMA) as part of a liquidity grab.
This happened in early May and was followed by the strong jump we saw in August. With monetary policy in the U.S. following a relatively predictable course, we expect that BTC’s uptrend will continue toward the end of the year.
The most likely target if that happens would be $94,000 based on the market’s structural levels in the weekly chart. This would translate into an 18% upside potential based on BTC’s current price.
BTC Needs to Rise Past $82,000 to Confirm a Trend Reversal
Looking at the 4-hour chart, we can see that BTC remains within a “hot” buy zone we designated as such in previous price prediction articles.
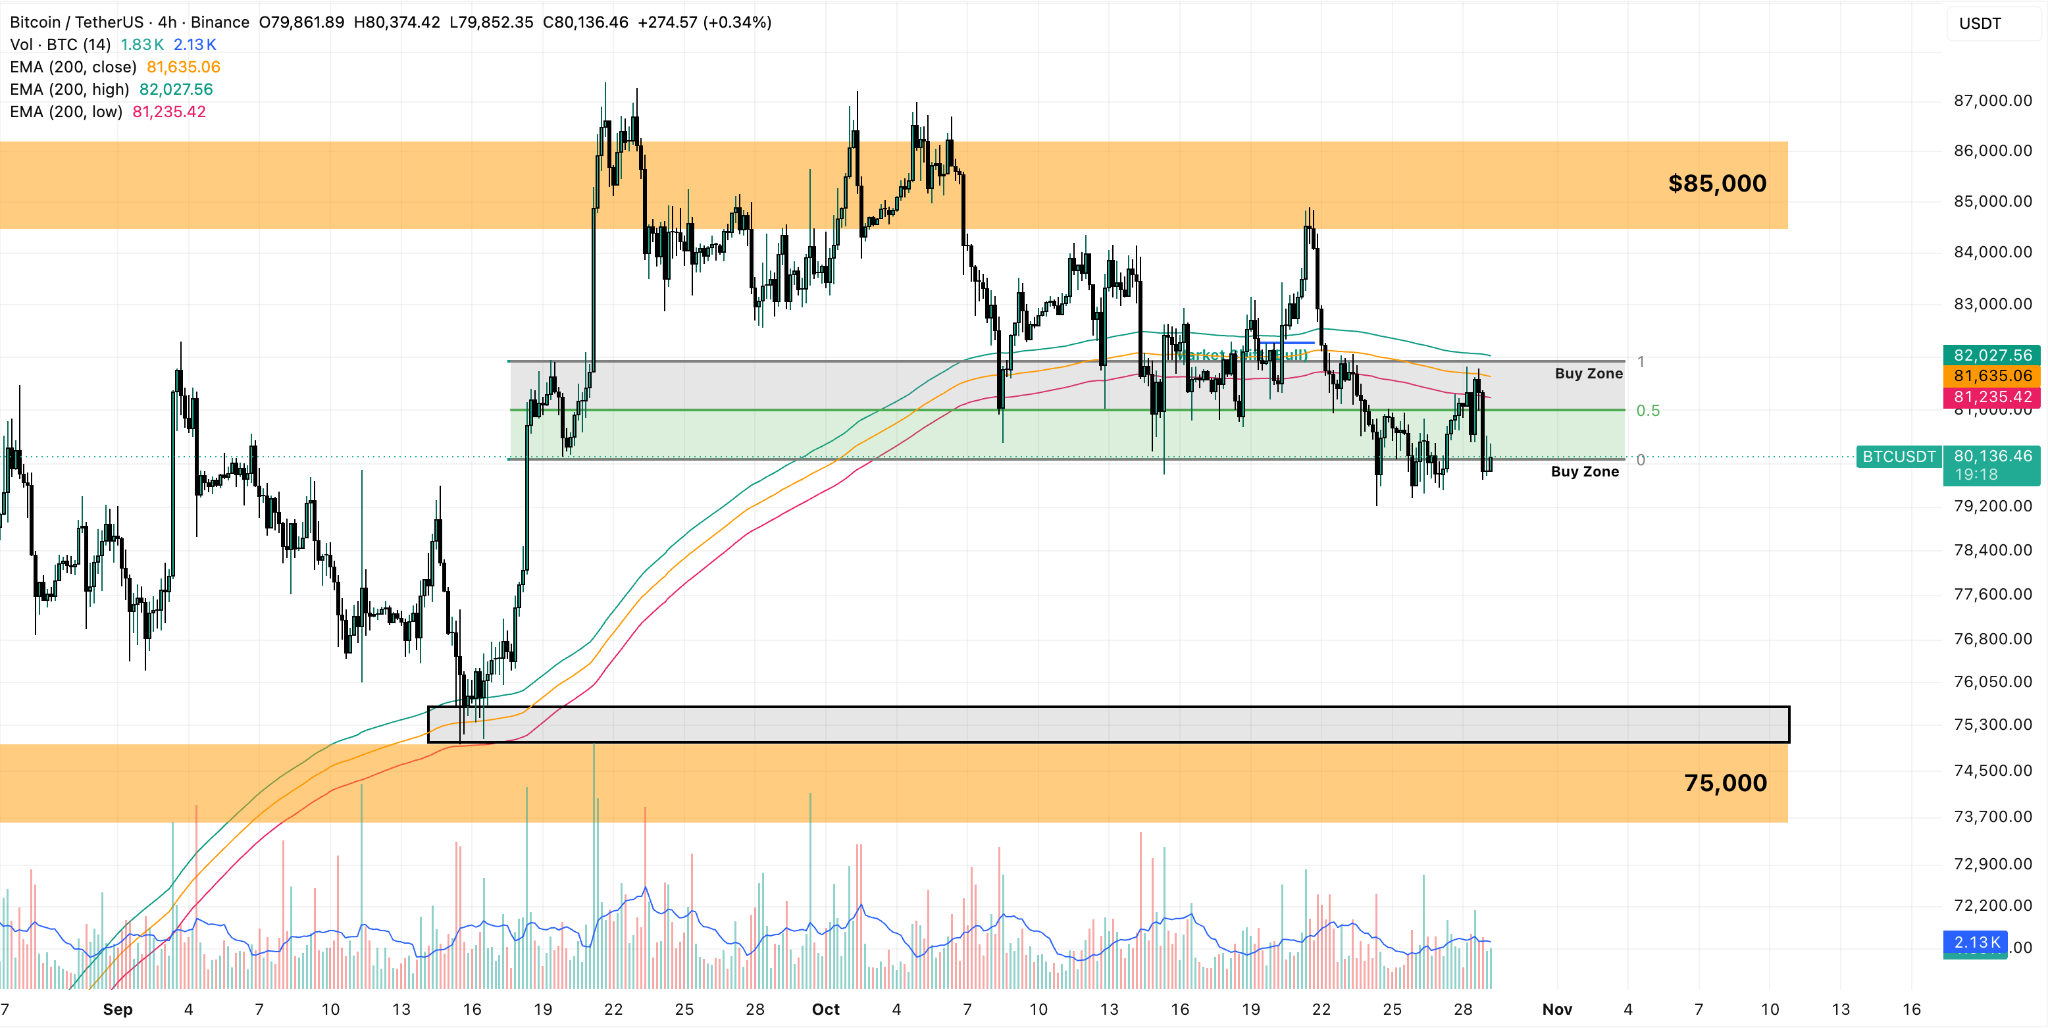
The price has to break past $82,000, as this is a pivotal level that would confirm a trend reversal. If that happens, the next stop will be $87,000, followed by a stronger move to $94K if bullish momentum accelerates.