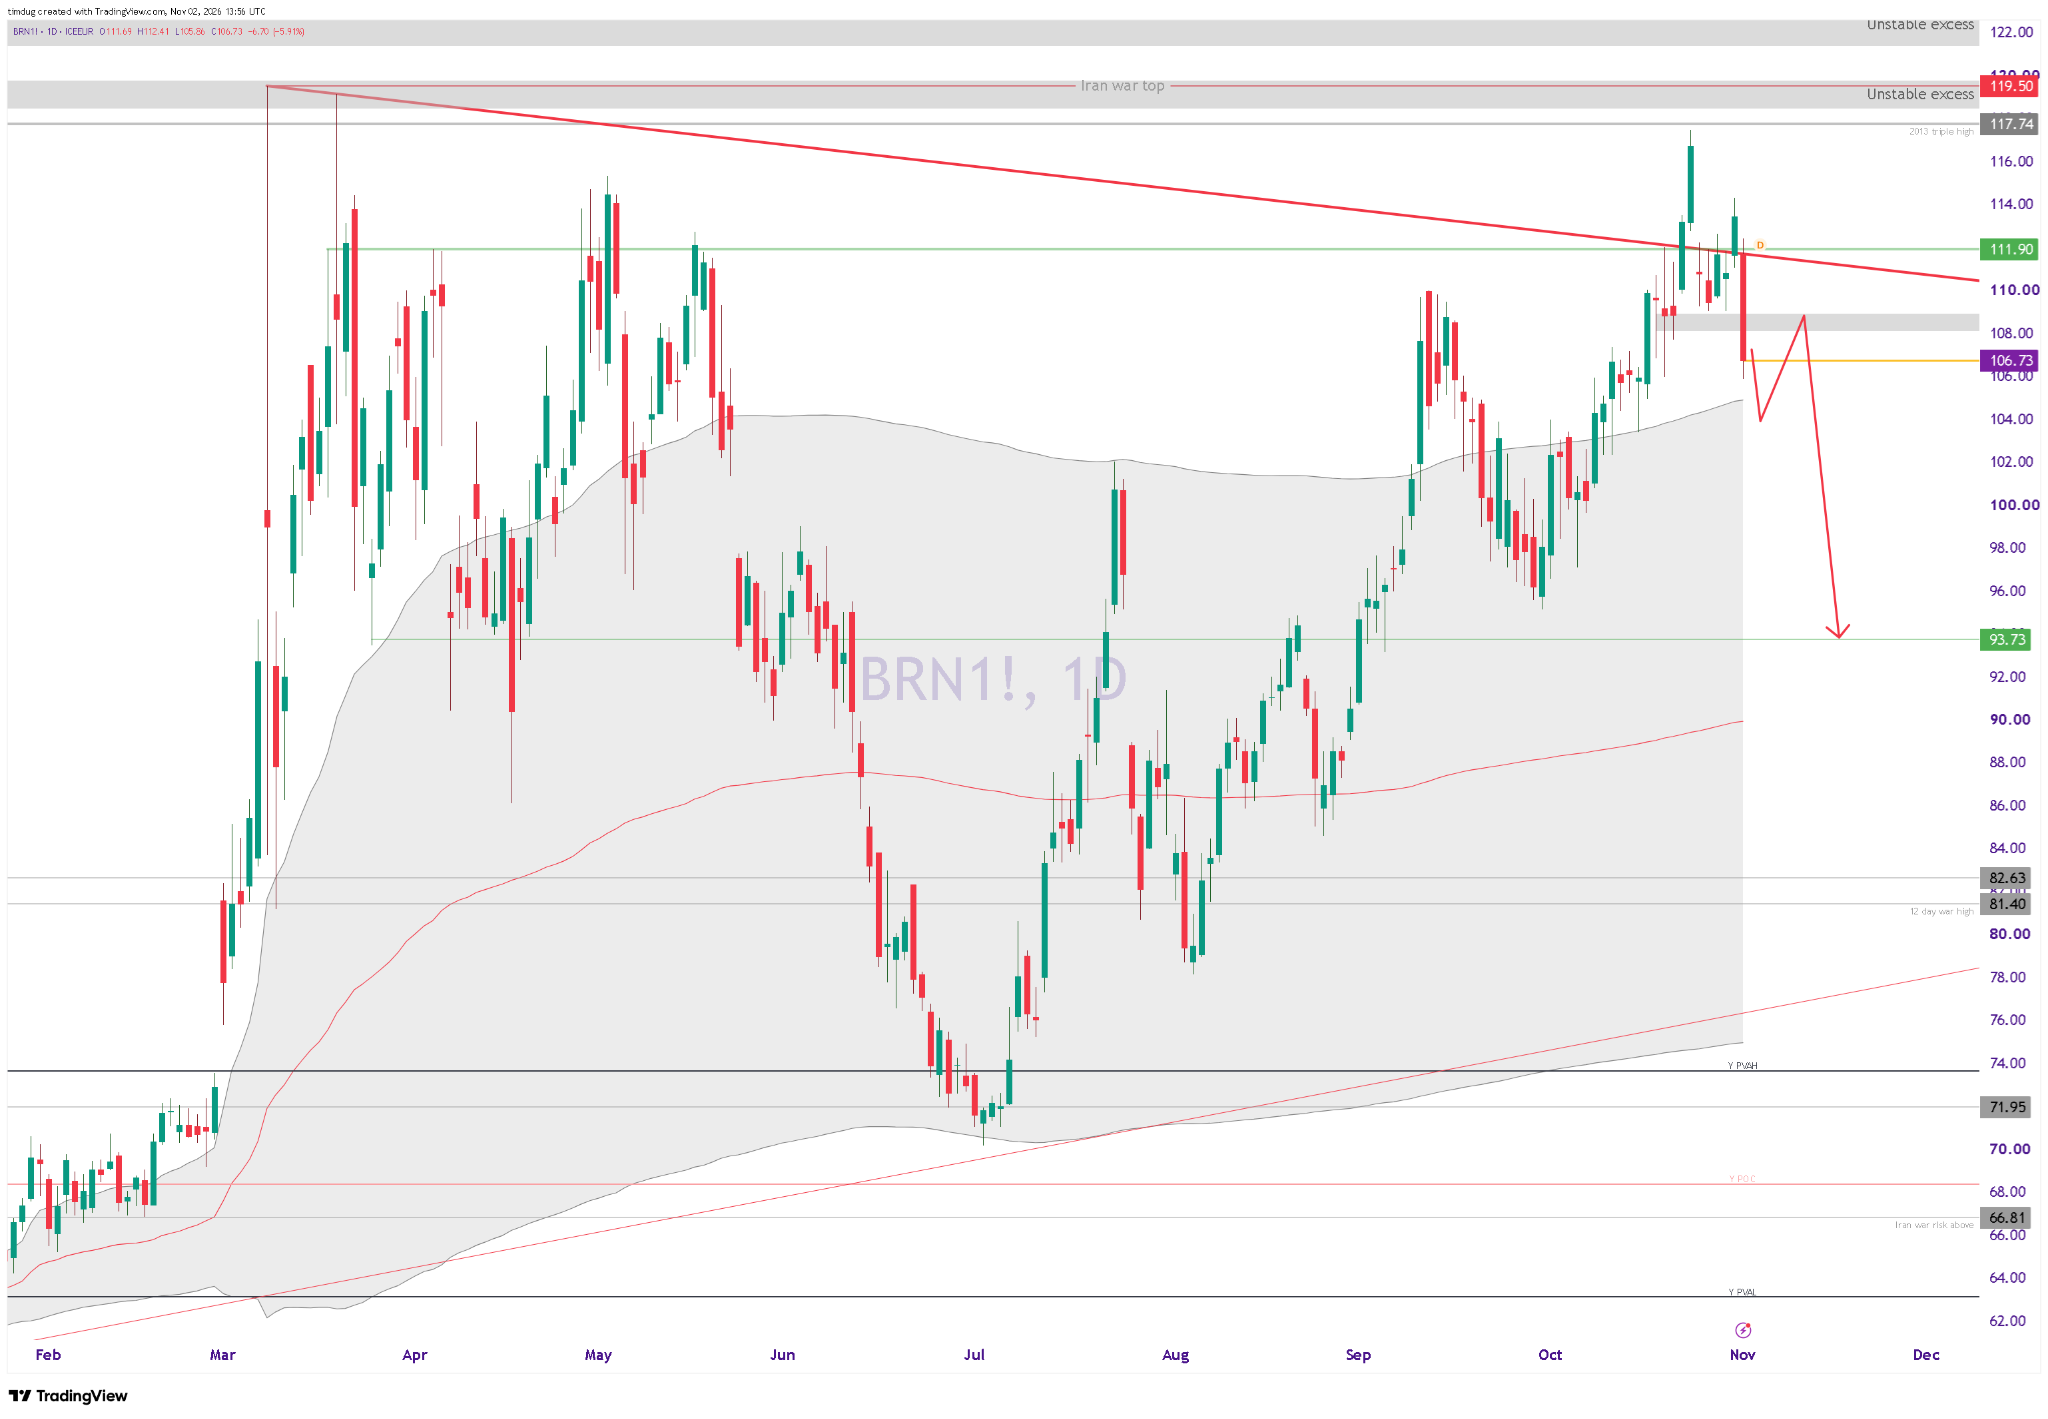
Higher for longer and the glut. In short, 8 months of a war means higher baselines for crude benchmarks. There are whiffs of a 2027 glut talk percolating through market narratives at this point, which will start to price in around mid-January which is the Brent contract we trade now. This is the only hope we have of escaping a floor price of $80, rather than a ceiling. The only problem with glut talk is that each time it is mentioned, a nice clear model of how and when this war ends is presented. If you have been reading along here since March, you will know that gets shifted around almost hourly. Between White House/Trump jawboning and Iranian/Hormuz realities.
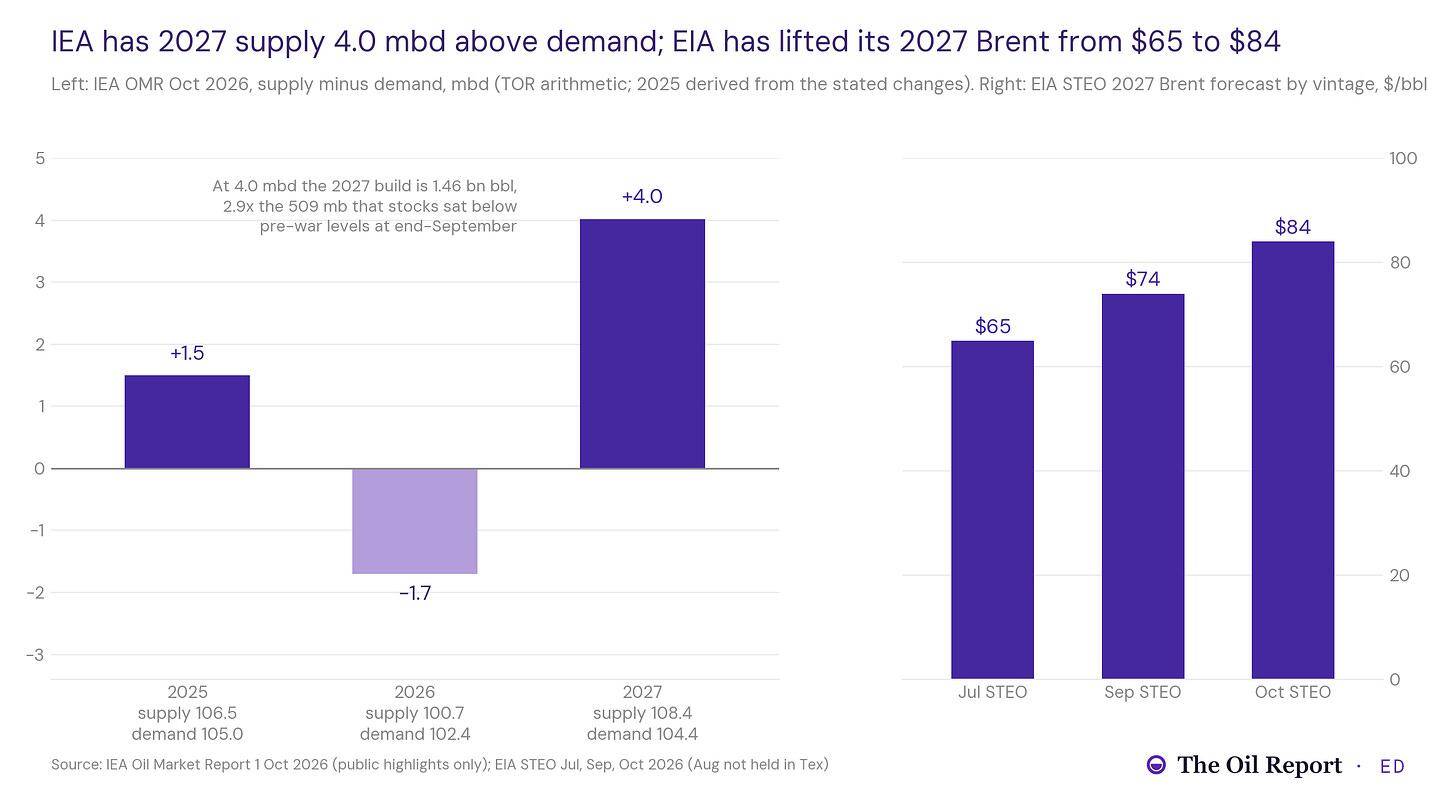
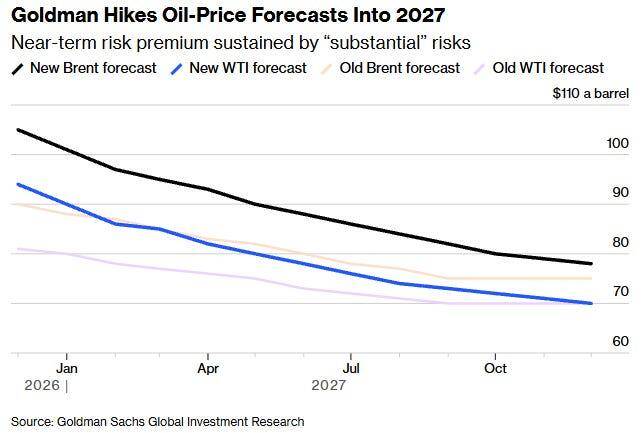
I’m going to cover calendar spreads to look at for this trade below and the macro thesis. The banks are wrong in the short term but right in the medium term. What is set to be higher forever now is products. With no new investments from oil majors going into refining. We will talk about this another day.
Fatigue. We are now at peak media fatigue on this war, giving way to the frenzy of US midterm elections which are leaning more and more blue. But I am staying in my lane. Let’s get a few key items out of the way from last week.
Tehran is taking meetings. Senior security officials from Saudi Arabia, Pakistan and Turkey, the members of the Mecca Joint Defence Agreement signed in August, met Iranian officials in Tehran on Monday (Euronews, Reuters, 26 Oct). On Tuesday Iran’s Supreme Leader called for proposals setting out acceptable conditions to end the war, and crude dipped briefly (Newsquawk, 27 Oct). Nothing in the reporting gives terms.
Iran’s Secretary of the Supreme National Security Council, Rezaei, told Pakistan’s army chief that Iran rejects the American demands (Al Hadath, 21 Oct), and its Foreign Minister said on 21 Oct “we have not reached a state of peace and are far from it“. The pact is also unproven, hence the flip-flop price action of last week: Houthi missile and drone attacks on Saudi Arabia are escalating, and Turkey has ruled out offensive operations against the Houthis (Euronews). As of today, Monday 2nd Nov, talks are ongoing with scant further details other than talks are quoted as ‘‘ongoing and progressing’’ -Iranian Foreign Minister Abbas Araqchi
Ships are moving. US CENTCOM’s commander said the IRGC was not visible in the Strait of Hormuz when he transited earlier in the week. He said he saw dozens of commercial vessels, including cargo, crude, and LNG carriers, with US air and sea forces in place. CENTCOM says the US helped Gulf partners move over 1.5bln barrels of oil across the summer, and that Iran has been prevented from exporting oil (Newsquawk).
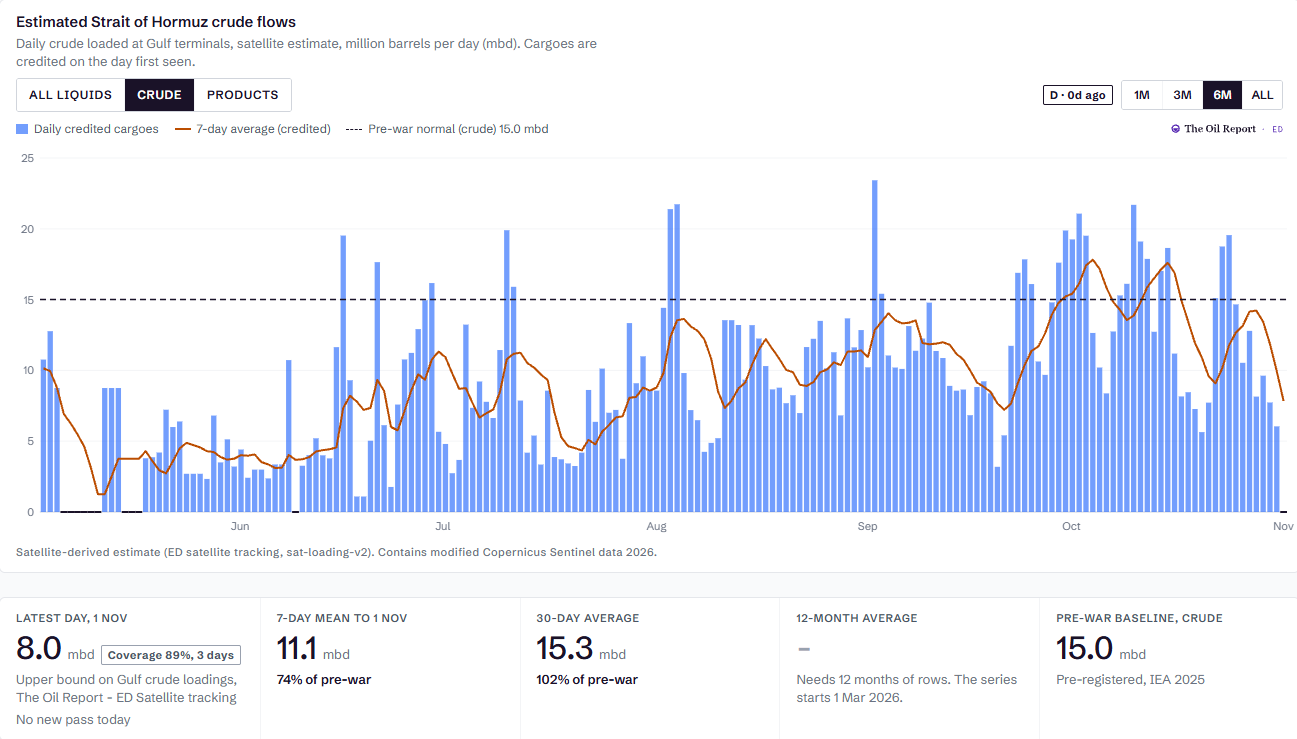
Now, 1.5bln barrels is a nice topline figure, but the market is firmly trading the ebb and flow of the straits. And we are firmly in an ebb right now. My system is Sentinel-1 and Sentinel-2 imagery with supportive data from 8 other satellites. So I am pretty confident in the latest numbers being within a 20% tolerance window. And I see flows averaging 11.1mb, with yesterday’s (Nov 1st) flows at 8mbd. I’m happy to live with the tolerance window I have. I’m not trading physical.
Note on chart: my system is not yet splitting shipments by product. We have complex work ongoing internally to calculate this.
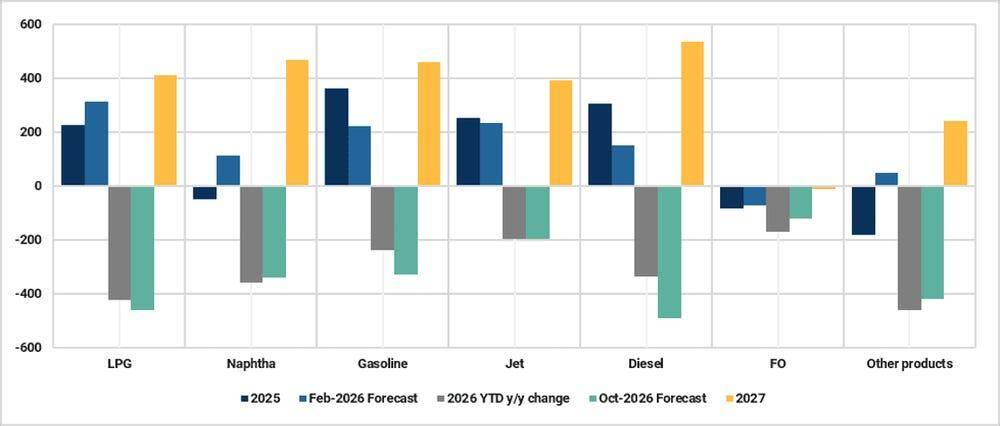
Demand is shrinking at the other end. Kpler puts refined products demand down 2.4 mbd in 2026, concentrated in the second and third quarters, with gasoil and diesel hardest hit at 500 kbd (Europe -280 kbd, China -200 kbd), then LPG at 460 kbd and naphtha at 350 kbd. This really has to be studied now as traditional ‘price led’ demand destruction. Supply constraints initially, coupled with refining utilisation constraints, led to higher product prices, then bamo, demand drops. Moving to the new energy blocks of electrons not molecules.
Kpler and IEA expect an uneven rebound of about 2.5 mbd in 2027, with Chinese EVs and LNG trucks capping road fuels.
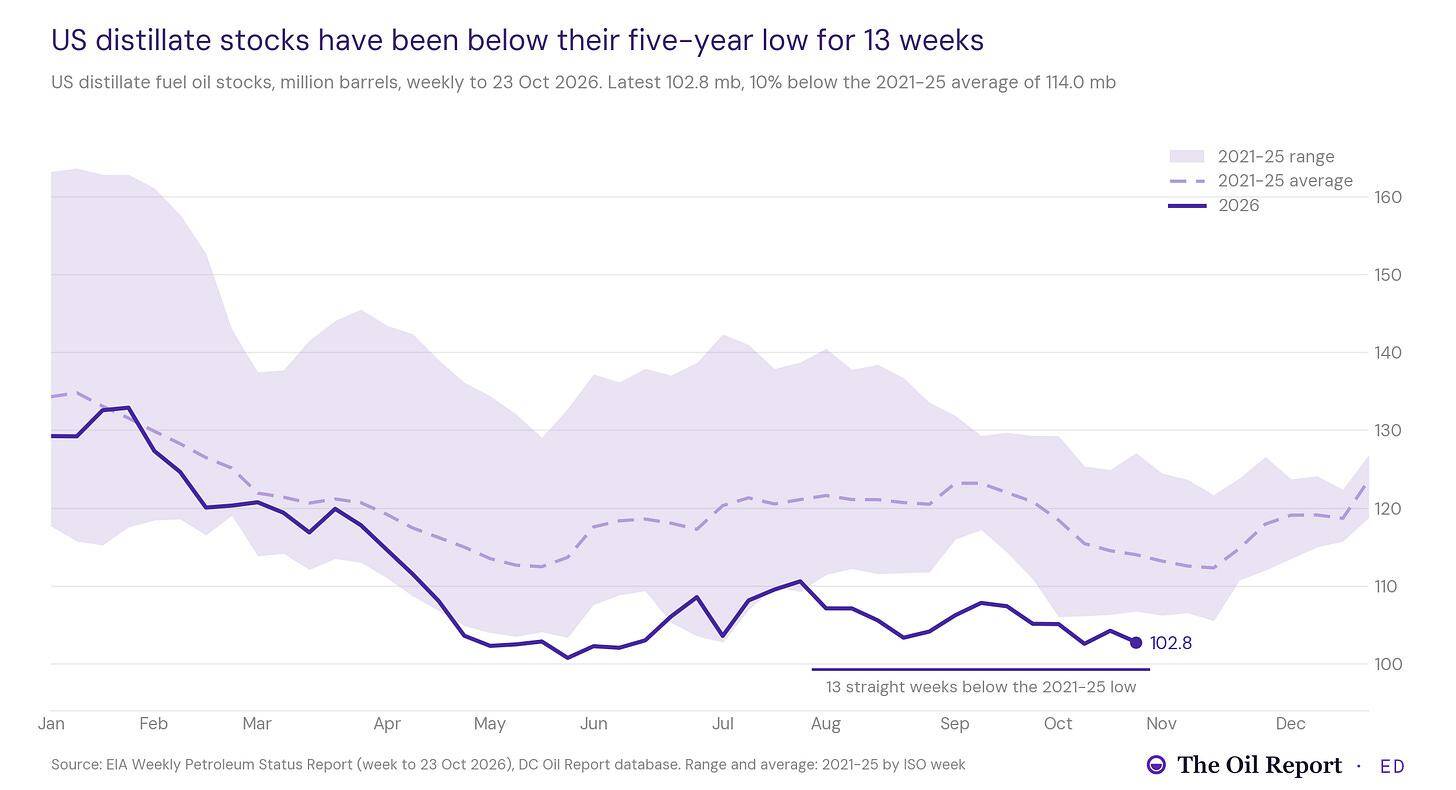
US diesel has no spare cushion. Like we didn’t know. But I think it’s important to mark where we are here as we close out the harvesting season in the Northern Hemisphere. I expect that inventories have made it through the largest near point demand. I expect to monitor builds from here through to end of winter. Stay tuned to the weekly EIA report I release.
Distillate stocks fell 1.5 mb to 102.8 mb in the week to 23 Oct, 10% under the 2021-25 average for the week (114.1 mb) and below the 2021-25 low (106.8 mb) for 13 straight weeks. Refinery utilisation was 92.8% (EIA WPSR). Diesel is where the demand loss and the stock shortage meet: Kpler has it as the biggest 2026 demand cut, and US stocks sit under the 2021-25 low.
Whether Brent holds below April’s high depends on whether any of the talk in Tehran changes the barrels leaving the Gulf. For now, it is actually having a negative effect.
Structural Bid: The Details
There is a seasonality to oil buying as we all know, but it is critical to dig into what each seasonal inflection is powered by. Refiners in my view, are not here anymore as buyers of volume. Focus is on 2027 deliveries. Prices through to end of year will get vacated and the structural bid from refiners is gone. Effectively, this impacts spot cargos more so than futures price. Futures on Brent now trade Jan deliveries. WTI is now trading Dec as front month.
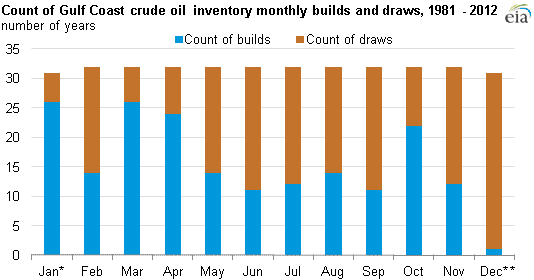
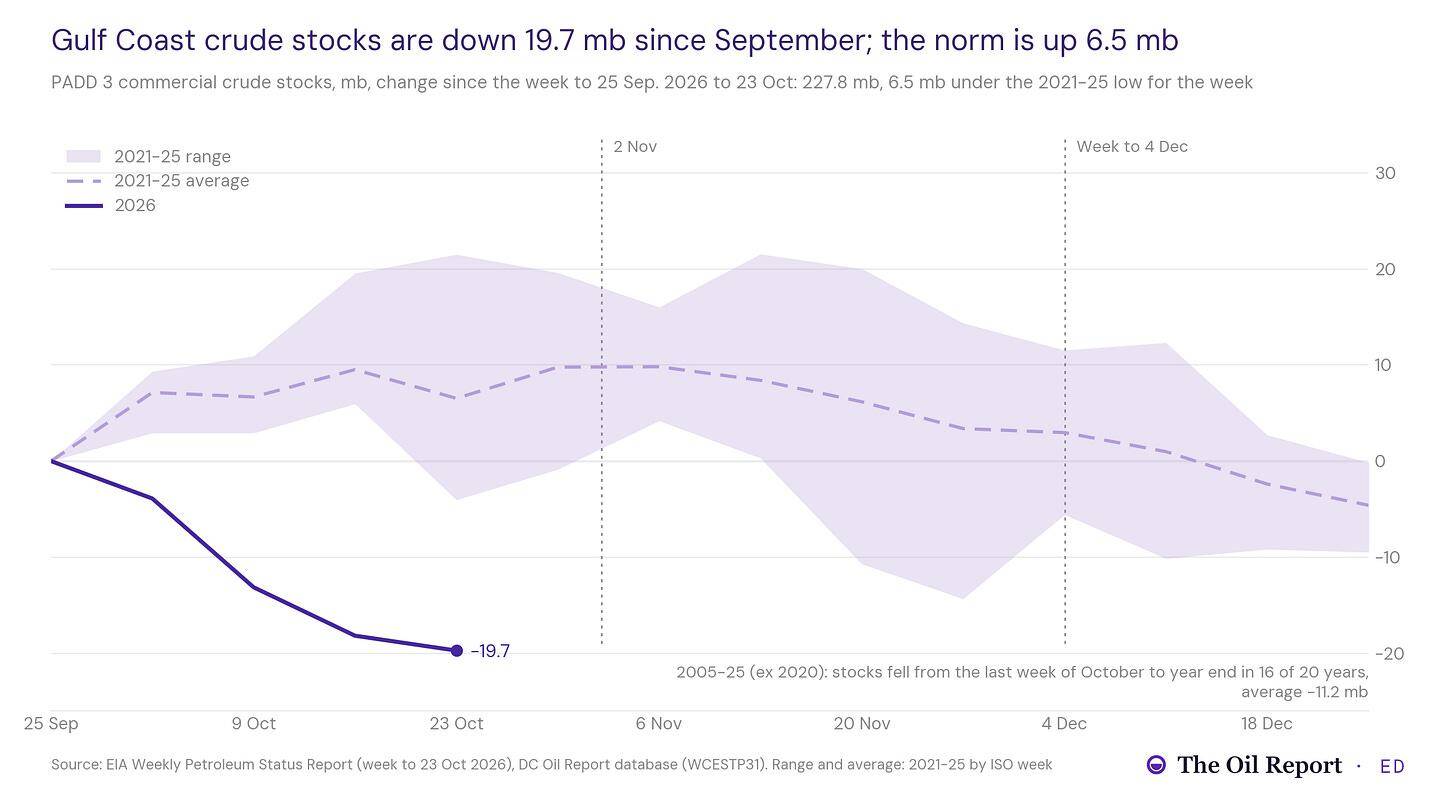
There is a tax reason for it. Moore, Toepke and Colley (2005) trace it to refiners in several large producing states being taxed on year-end inventories of crude and products. They stock up into October, then postpone purchases into the new year and hold runs up from tank, with buying returning around the second week of December. The EIA data shows the footprint. Gulf Coast crude stocks rose between the last week of September and the last week of October in 16 of 20 years (2005-25, ex 2020). They fell from the last week of October to year end in 16 of 20, by 11.2 mb on average.
Gulf Coast stocks fall in December by nearly 8 mb on average, 1981-2011 (EIA, 19 Feb 2013. So this is why we pay attention to COT -BELOW.
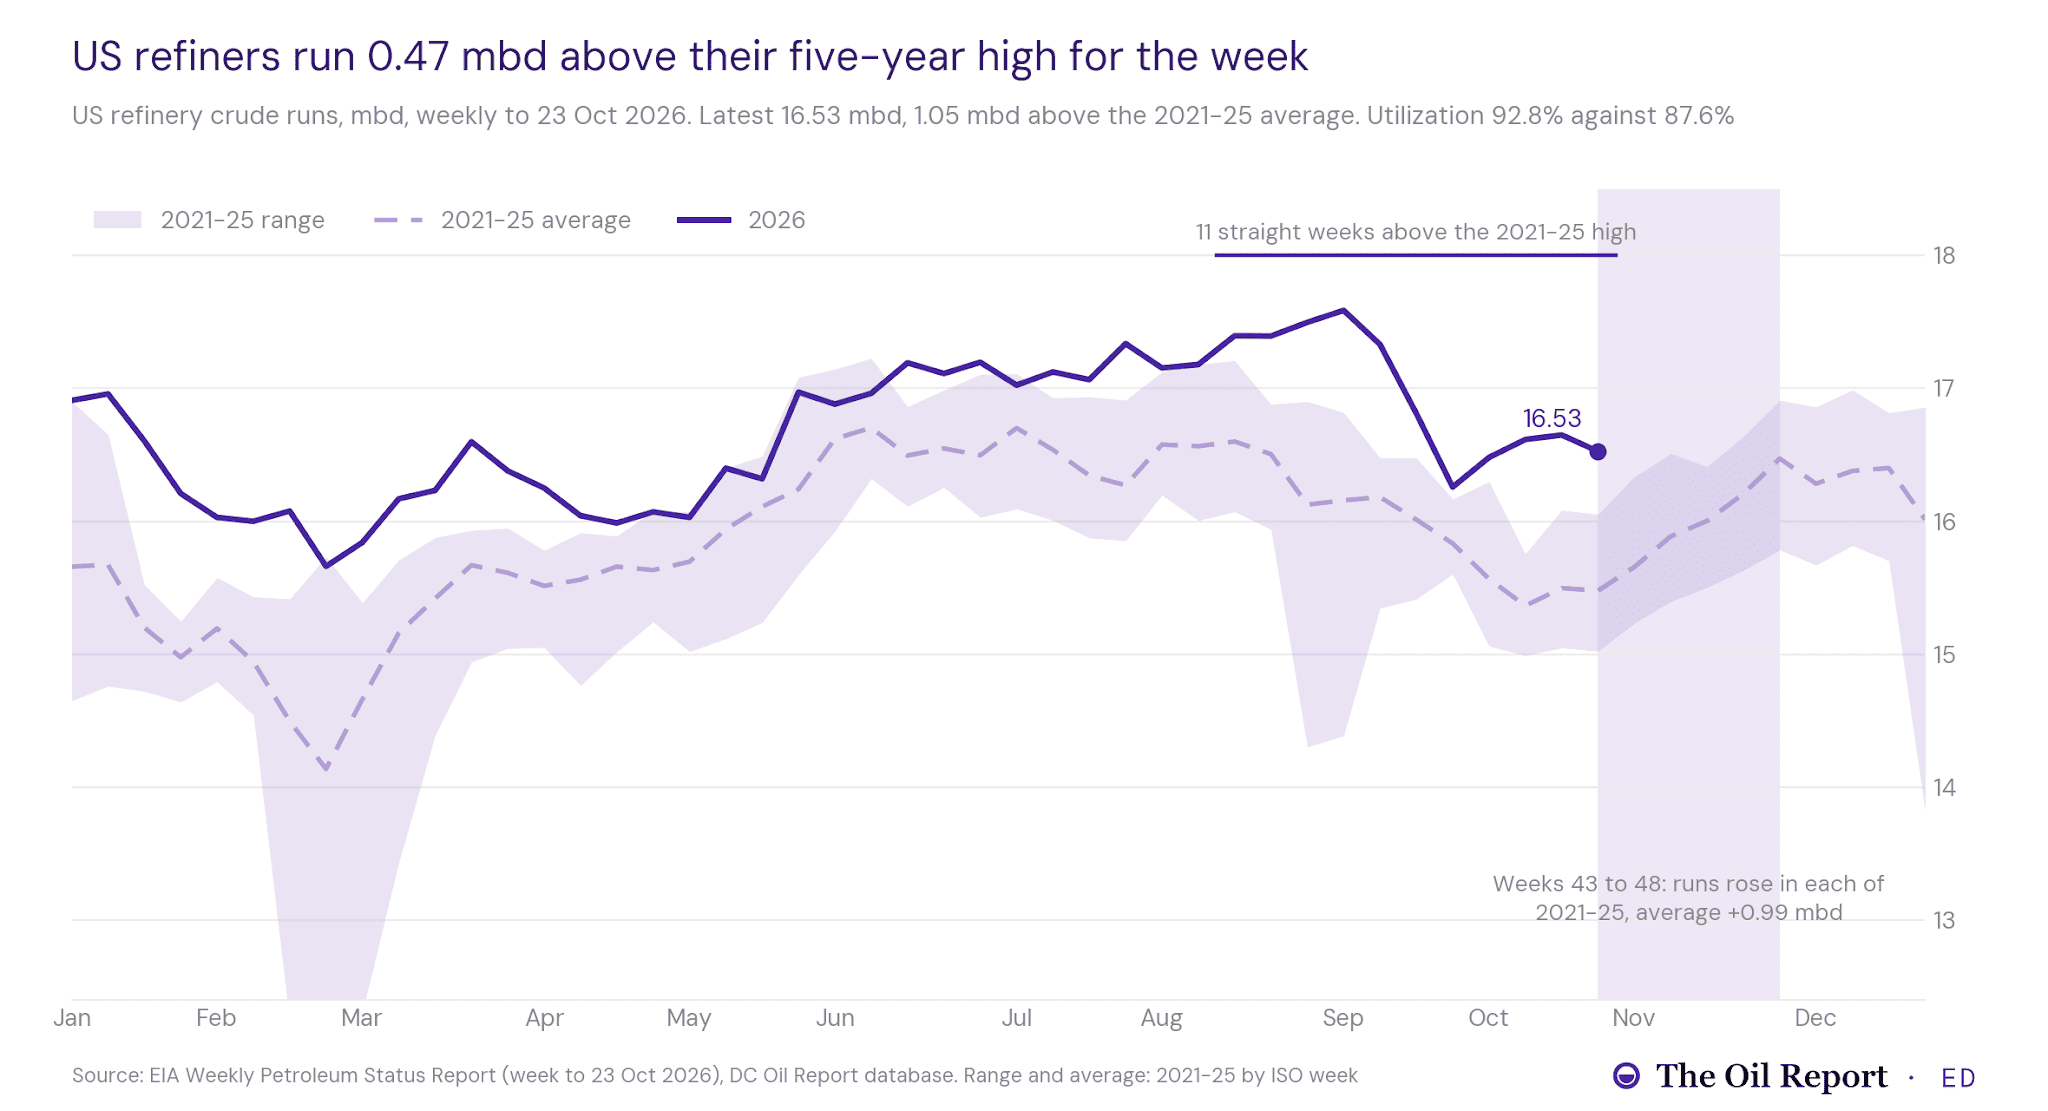
The EIA report this week will be interesting to support this thesis. I am wary of it given the war regime year.
Most assumed seasonal phases get shifted around. If we pull it all together, is this why Hormuz flows are allowed to fall back also? I suspect so. And the usual crude build that refiners would normally do into end of October didnt happen for obvious reasons- stocks are super tight. I see the additional 400k barrels from SPR (100K released as per last weeks EIA report) are those additional crude stocks required.
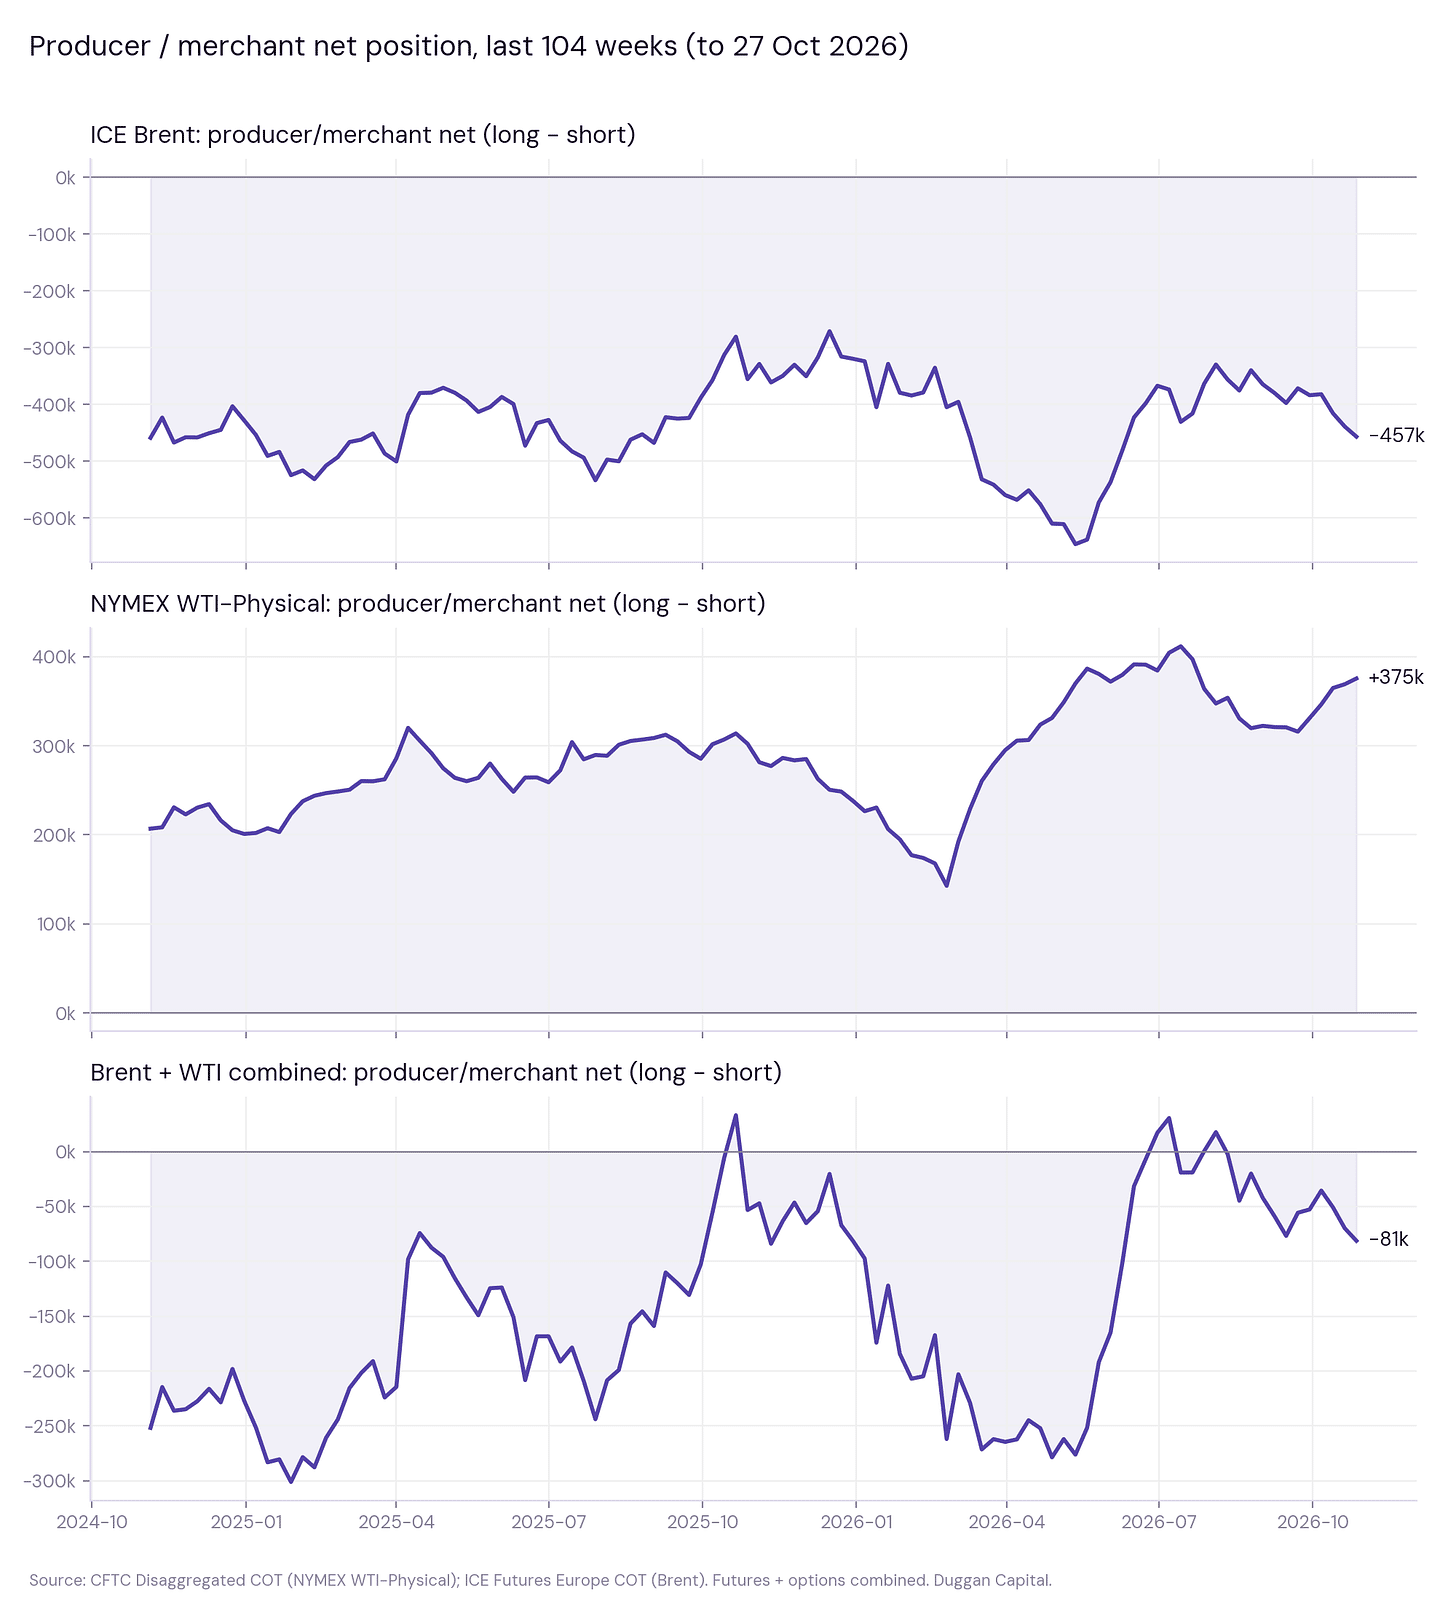
COT Shows Producer/merchants cut their net short position 16.5% WOW across all crude. Back below Dec 2025 levels.
Brent Oil Price Forecast
Every new Brent Oil analysis as it publishes, today's technical signal and key levels, live price — on one page.
See all Brent Oil forecastsThe Net Net
To close out on the energy macro, there is a confluence between the narrative and the structural.
The narrative: Trilateral talks and the Mecca agreement are looking good. Is this the ‘It’s probably over’ point? I think yes, and we have seen the high watermark of ‘Hormuz is shut’.
The structural: Refiners seasonally shift here and are no longer in the market to provide a ‘structural bid’ under the market.
Well, as I write, Brent is down 4.2% and simultaneously the banks are lifting price forecasts higher. It is a basic mismatch of timing calls. The banks are setting their price calls against effectively an end of year VWAP now. It has to be WTI as Brent Dec is now closed. Here is the chart. Yearly vwap is at $80.60.
Commitment Of Traders Report
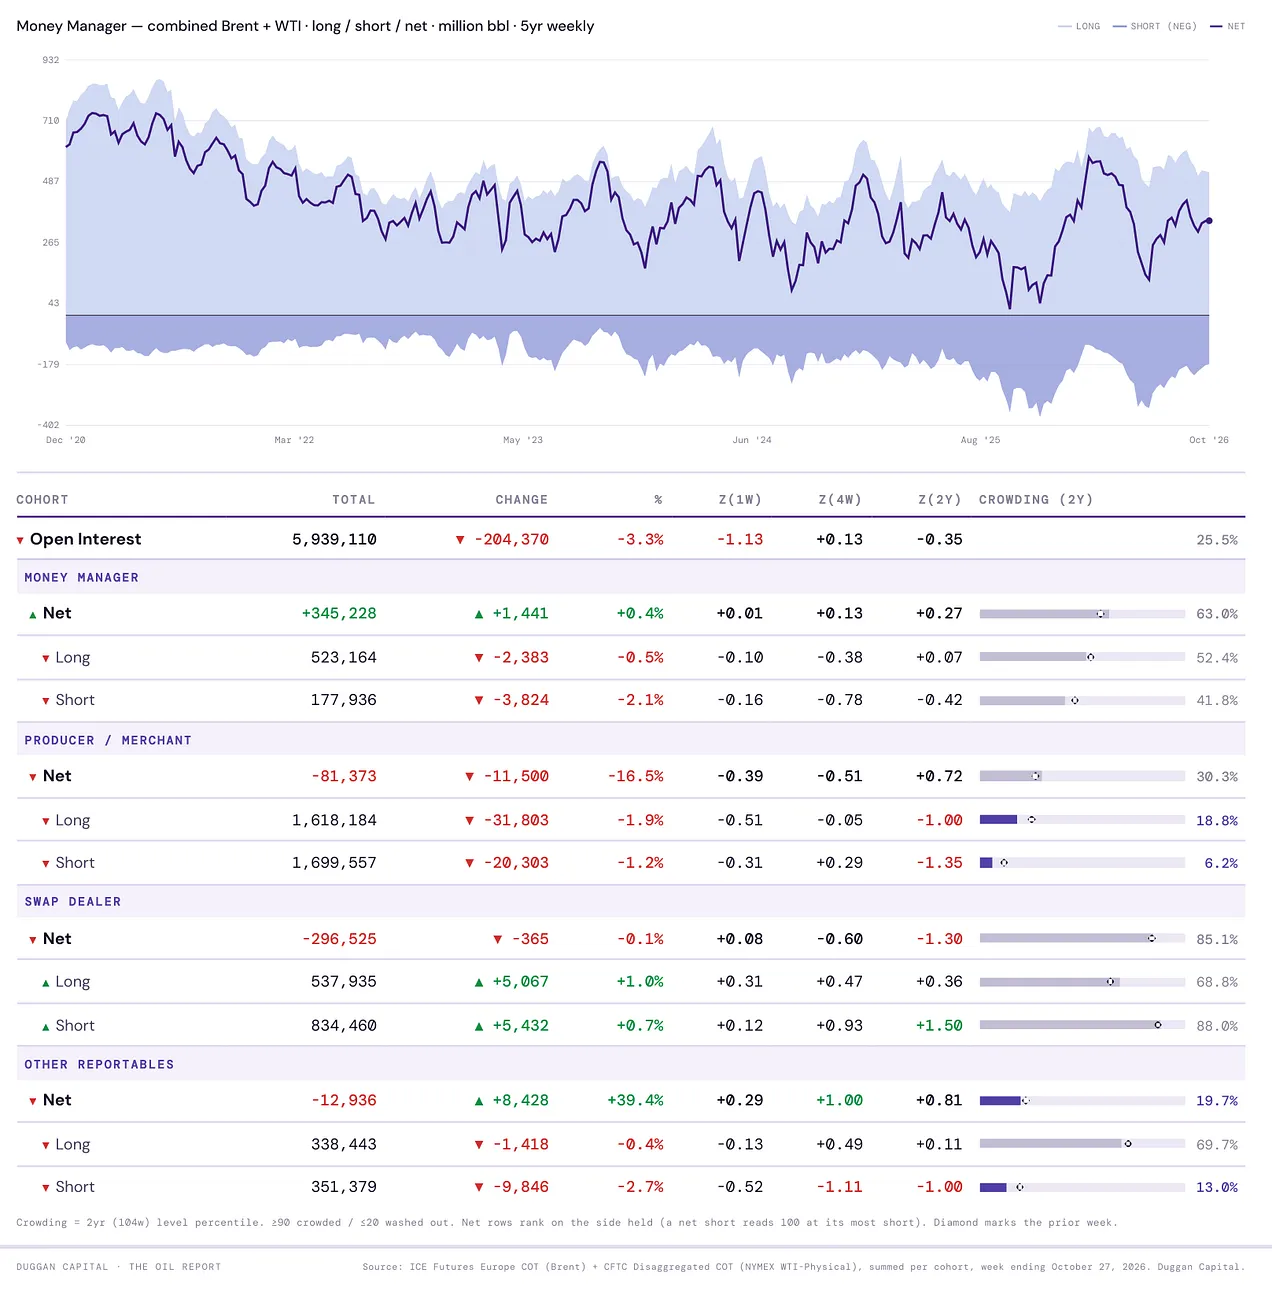
The combined read. Money managers hold a combined net long of 345 million bbl across Brent and WTI, up 1 million bbl on the week, at the 41st percentile of five years (63rd of two years). Longs fell 2 million bbl to 523 million bbl and shorts fell 4 million bbl to 178 million bbl, so funds trimmed both sides and the net barely moved.
Swap dealers are the heaviest side: a net short of 297 million bbl (85th percentile of two years) and a short book of 834 million bbl (88th). Producers are net short only 81 million bbl, the 30th percentile, so they are selling and buying less than usual. Funds have room to add, and no group sits at an extreme, so the next move depends on whether the banks’ clients keep buying.
Detailed – WTI Producer/Merchants are crowded Net long at 375k contracts, adding 6k contracts to longs last week. It will be important to see if they are still building in Fridays report. WTI swap dealers are crowded 91.8% long (clients short) and OR are 99.5% short adding 8k contracts to short side last week.
Interesting to note, Swap dealers on Brent are crowded short 120k contracts. On WTI, they are crowded long 126k contracts. Both sides at 91.8% crowded long/short.
What’s the Next Move?
Below is a guidance chart for front month Brent until the end of the year.