



Copper (XCU) prices have dropped significantly in November as US dollar remains strong and investment activity in China remains weak. Factory growth also dropped in October which increased concerns about AI spending. The high cost of borrowing and uncertainty about AI spending keep copper prices under pressure in the short term. The price has broken the key level of $6 and is searching for the next support.
Why Copper Prices Are Falling: Weak China Demand Limits Buying
China’s Factory Slowdown and Falling Investment Weigh on Copper
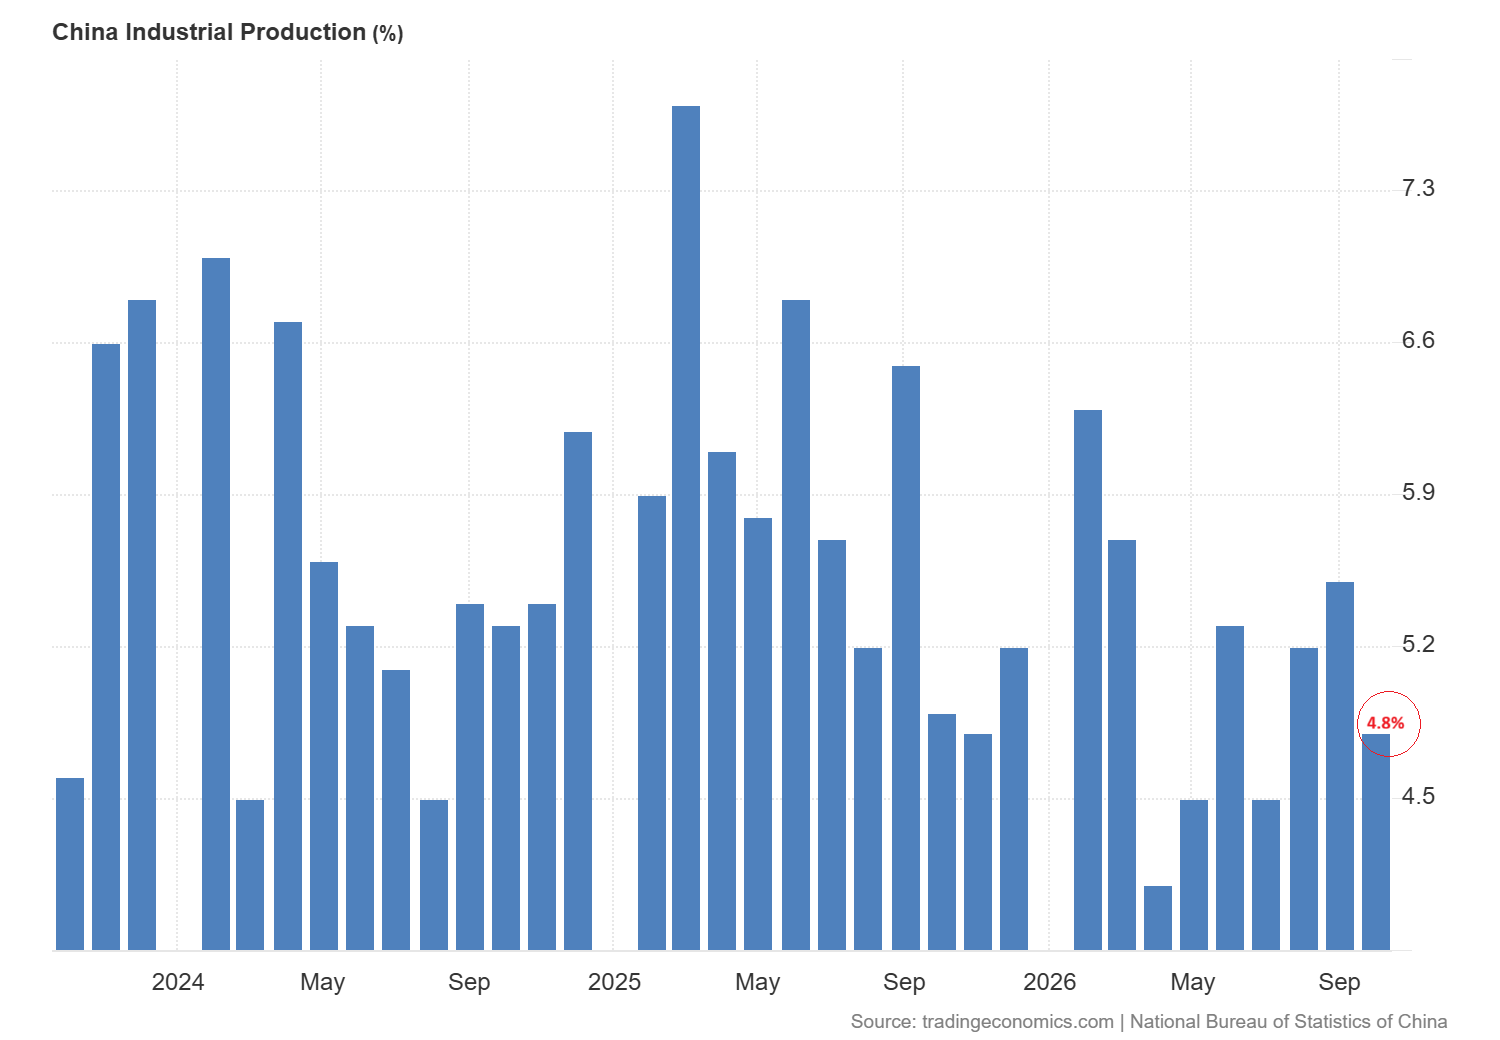
The latest factory data from China also shows slowdown. The chart below shows that industrial production has dropped to 4.8% in October from 5.5% in September. The output continues to expand at the slow pace.
Copper is used in electrical equipment, machinery and consumer goods. The slow growth reduces confidence that industrial demand may offset the weakness in construction in China.
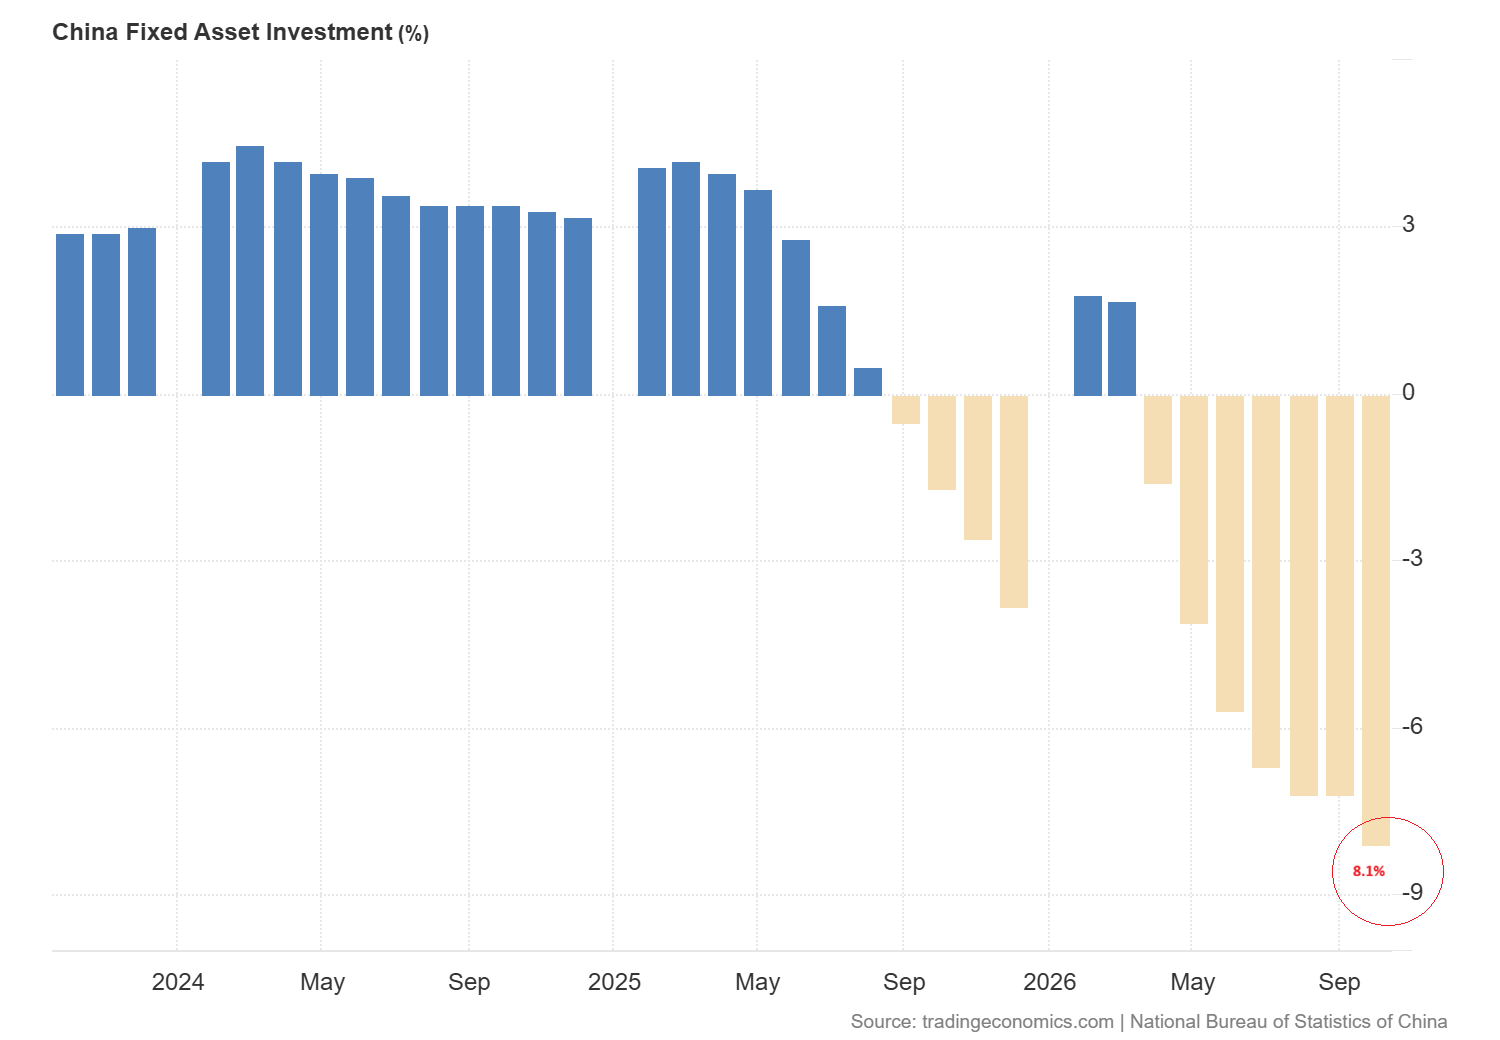
The investment data from China also provide another reason for the loss of demand for copper. The chart shows that the fixed asset investment dropped 8.1% year on year from January to October. The data shows the negative trend since April 2026.
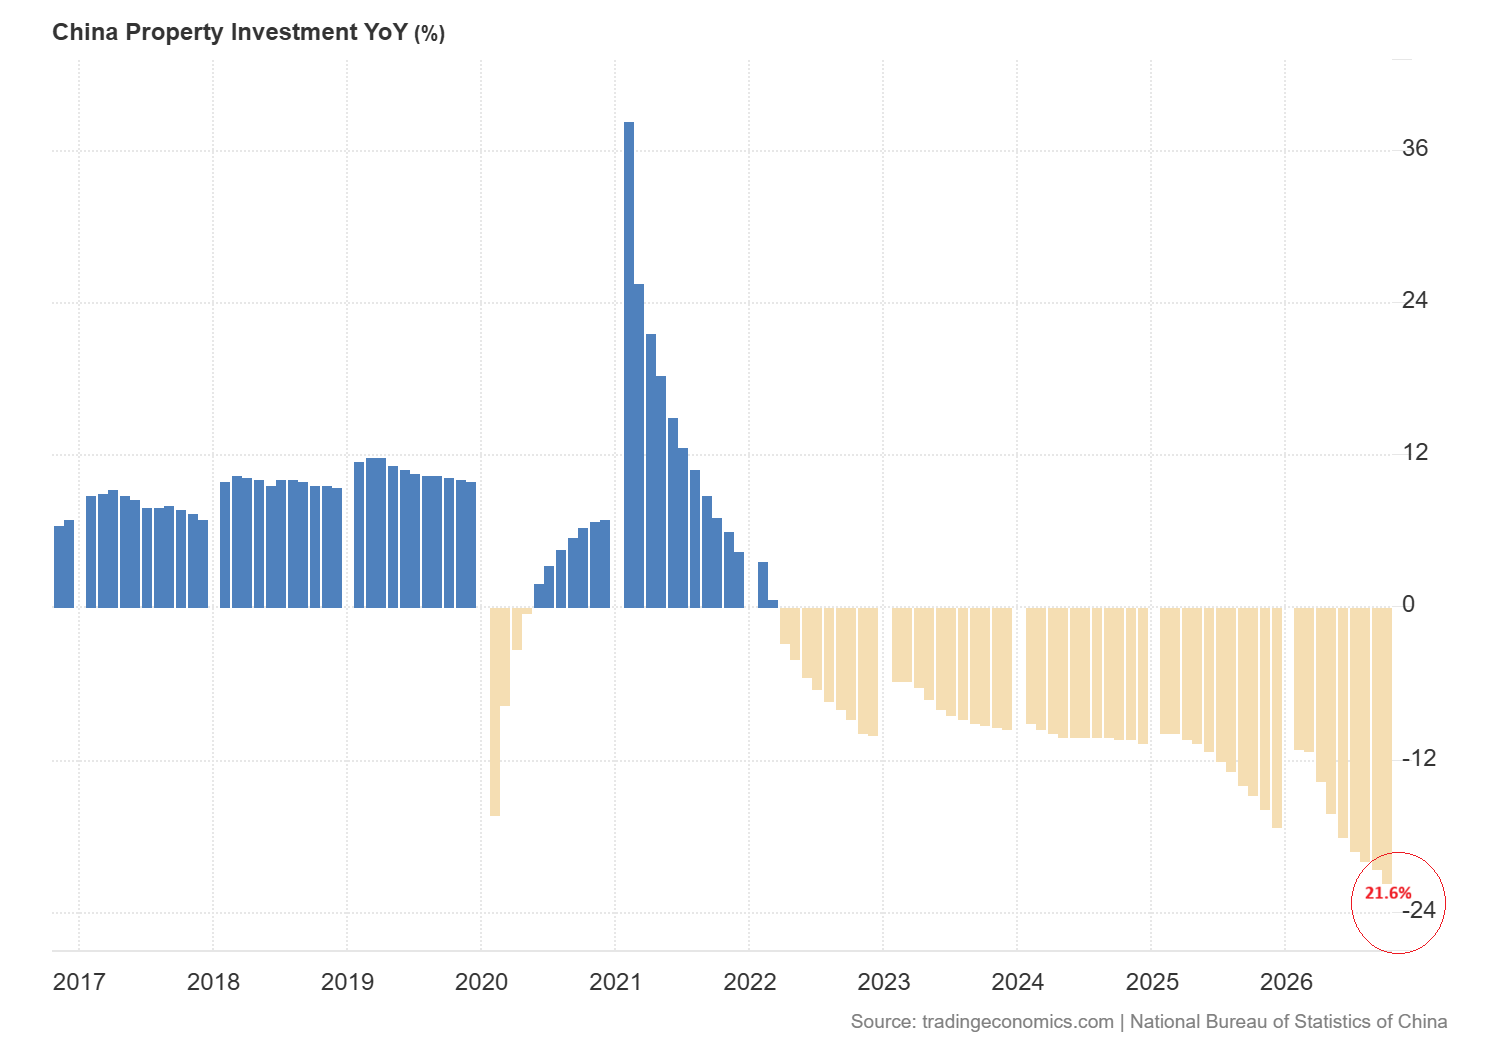
The chart below shows that the property investment also dropped to 21.6%. The drop in property investment limits the demand for building wires, plumbing and electrical fittings. This data increases the pressure on developers and manufacturers to delay new orders.
Copper Price Forecast
Every new Copper analysis as it publishes, today's technical signal and key levels, live price — on one page.
See all Copper forecastsTight Copper Supplies in China Could Limit Further Losses
But the physical supply in China eases some of this pressure. Yangshan import premium reached a record $500 per tonne on Thursday which is up from $360 on Wednesday. The stocks in Shanghai Futures Exchange warehouses remained at 27,642 tonnes, which is the lowest level since December 2023.
This data suggests that the availability in China is tight. The traders plan to send large amount to US from China for January arrival. Those shipments may ease shortage later but the uncertainty over the 15% US tariffs on imports of refined copper from 2027 may limit these flows.
Copper Technical Analysis: $5.20 Support and $4.80 Downside Risk
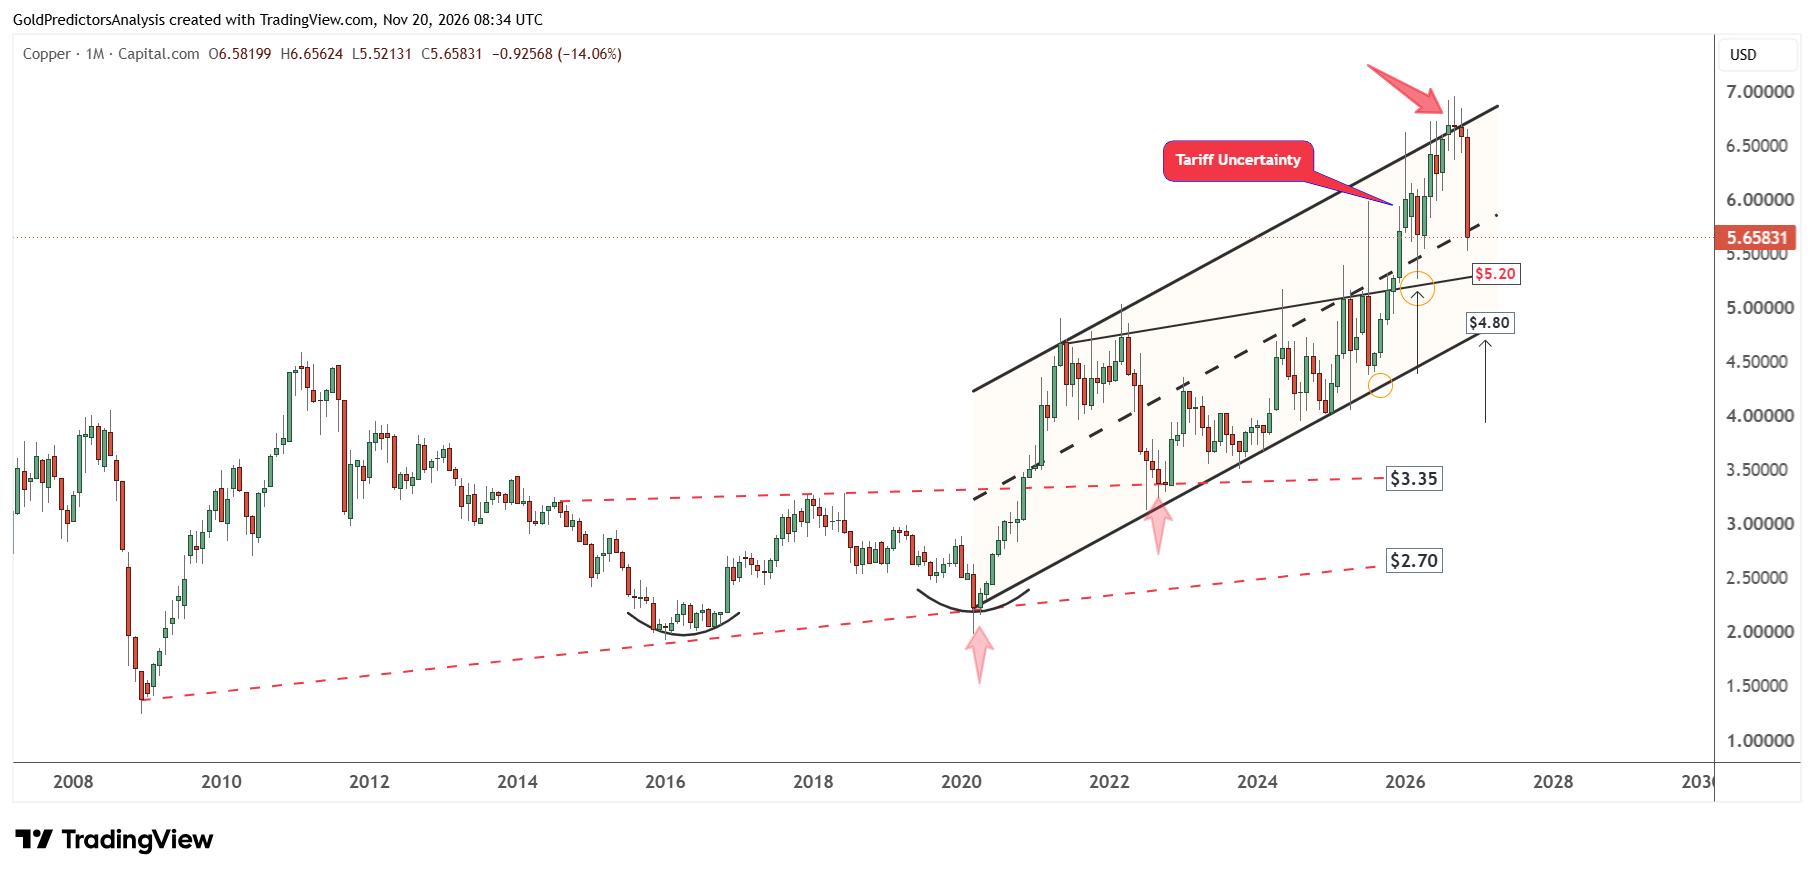
The quarterly chart for copper shows that the price dropped after hitting the key resistance of the ascending channel pattern at the $6.95 level. The price has broken below the key level of $6 and continues to move towards the next support zone of the ascending channel pattern.
The price has lost nearly 16% in Q4 2026 as of November and looks set to end the quarter with negative close. A quarterly close below $6 will likely open the way for further drop towards the $5 area.
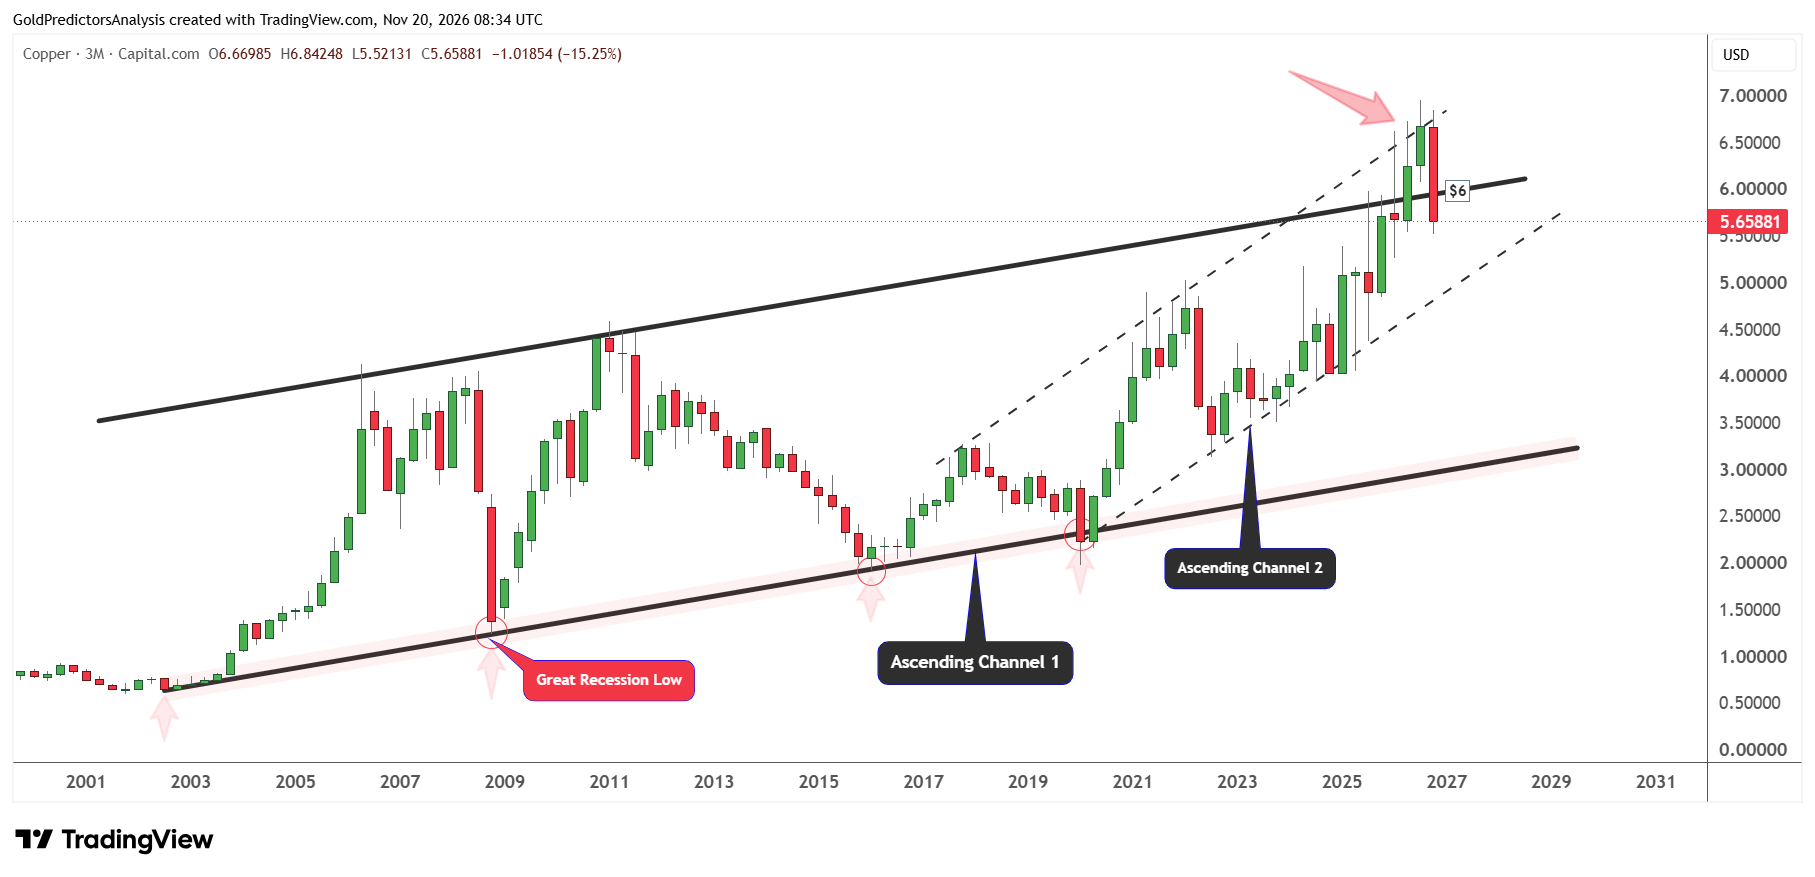
The importance of the $5 zone is observed on the monthly chart below. The immediate support for copper now remains at $5.20 which is defined by the ascending trendline that stretches from May 2021.
A break below $5.20 will likely push prices towards the $4.80 level. This support is defined by the ascending channel pattern that stretches from the lows of March 2020. Copper price must hold the $4.80 level to avoid deeper correction towards the $4 and $3.35 areas.
US Dollar vs Copper: Strong Dollar and High Yields Pressure Prices
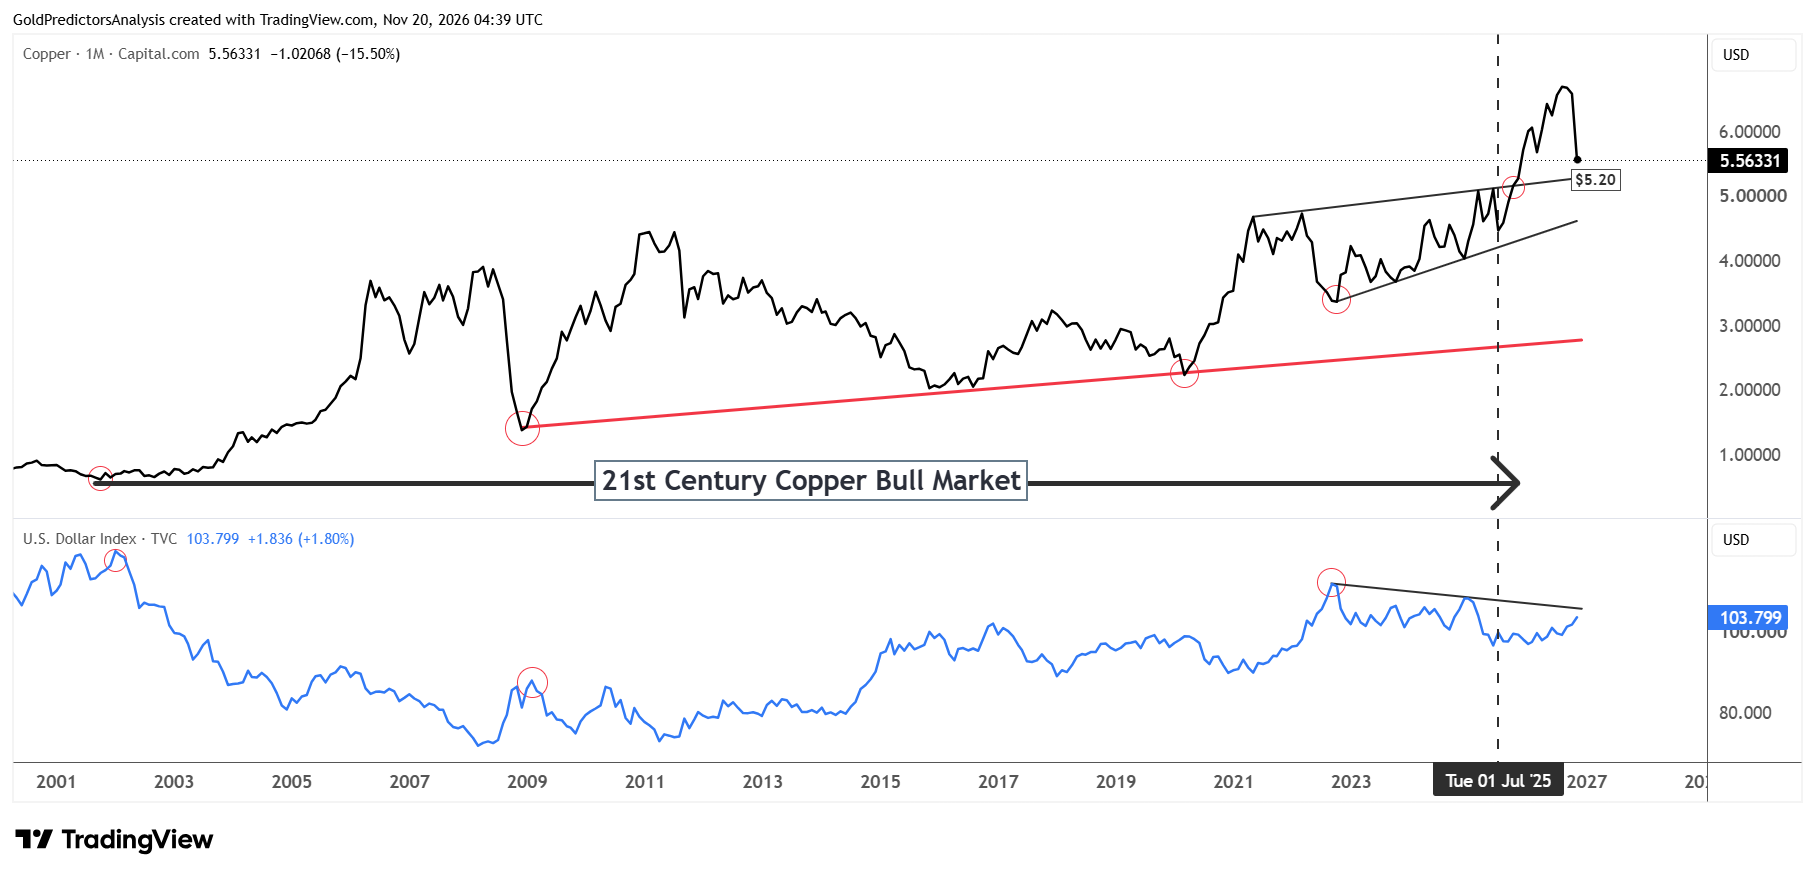
The US dollar index has gained positive momentum toward the 104 level which has kept copper prices under pressure. The chart below shows that the copper price rallies higher when US dollar continues to drop. However, the strength in US dollar is a headwind for copper prices.
The peak in the US dollar in 2008-2009 formed a low in copper prices. Similarly, the peak in the US dollar in 2022 formed a low in copper prices and initiated a strong surge. Copper prices received the additional boost in 2025 and 2026 due to the heavy expansion in the AI sector, which has pushed copper prices to a record high at $6.95.
Now the US dollar is gaining strength due to the high expectations for the Fed rate hike. The 10-year US Treasury yields surged higher after the strong consumer inflation data last week but slightly eased to 5.05% on Friday. However, Treasury yields still remain elevated which may keep financing expenses high for construction, manufacturing and data center projects.
The Fed expects further hikes as per the latest Fed minutes which keeps the US dollar strong and keeps the pressure on copper prices. A break above 104 in US dollar index might be a headwind for copper prices.
What to Watch Next
The weak construction activity in China and slow factory demand may reduce the demand for copper and keep the price under pressure in the short term. The US dollar also remains strong due to the increased expectations for high interest rates. The concerns about AI spending and bearish pressure in chip stocks increase the risk of decline in demand for copper. The $5.20 level is the next key support for copper. A break below this level may trigger deeper correction to $4.80. But a recovery above $6 would suggest rally towards $6.50.