


Copper (XCU) prices lost 1.16% on Thursday as the high inflation data from the US increased the odds of a rate hike in December. The departure of CEO of Nvidia, Jensen Huang also impacted the copper market as expectations of slower AI investment may impact the demand for copper from data centers.
The LME warehouse stocks increased to 328,000 tonnes on Thursday which also adds pressure to copper. The market is now watching for the US PPI data on Friday. The hot producer inflation data will further increase expectations of larger rate hikes and boost the US dollar, which may extend the losses in copper.
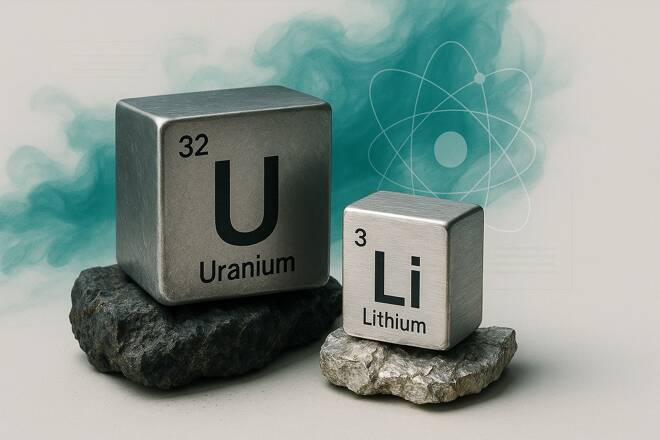
Uranium and lithium prices also remain under pressure in the short term. Oklo has signed multi-year deal with Centrus to buy enriched uranium for Meta-backed project. The deliveries are due to start in 2029 which shows how early reactor developers are lining up fuel. The battery grade lithium carbonate also rose on Friday. Shanghai Metals Market also reported that production has dipped and the weekly inventories dropped by about 2,750 tonnes. If the battery producers proceed to buy lithium at lower levels, the prices may rebound from the support levels.
Copper, Uranium and Lithium Forecast: Key Price Levels
Copper Price Breaks Below the 200-Day SMA
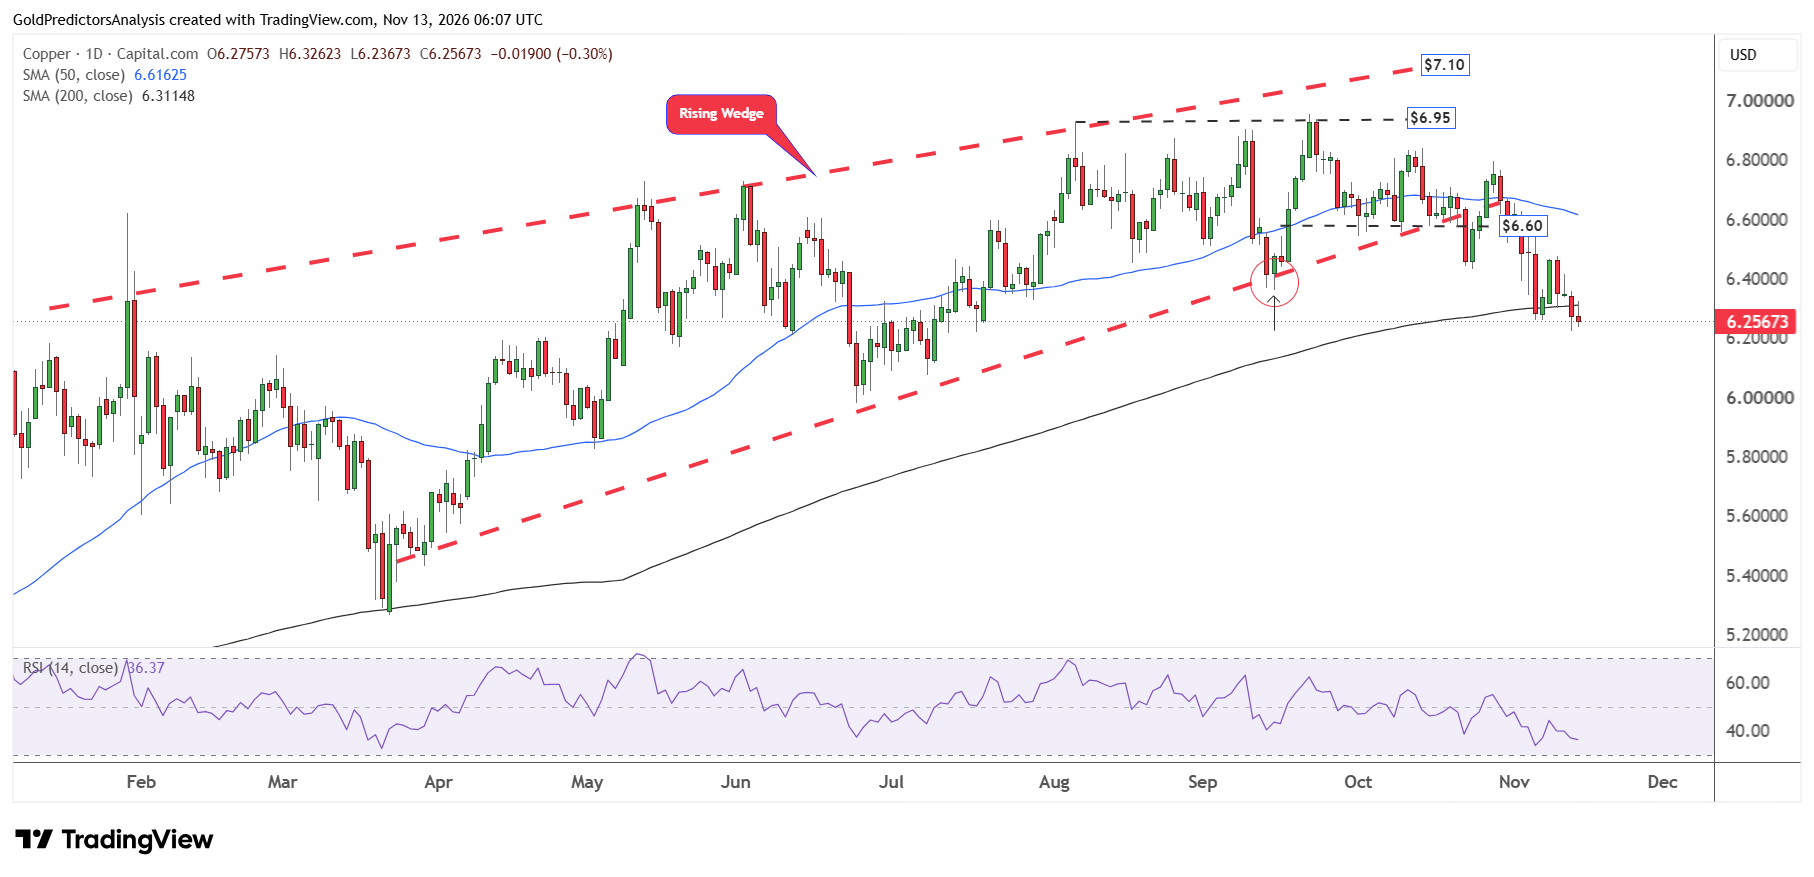
From a technical perspective, the copper price broke below the 200-day SMA on Thursday and remains in negative trend. The break below the 200-day SMA followed the break below the rising wedge pattern, which suggests a negative trend in the short term. The RSI also remains below the midline, which points to further downside in the short term.
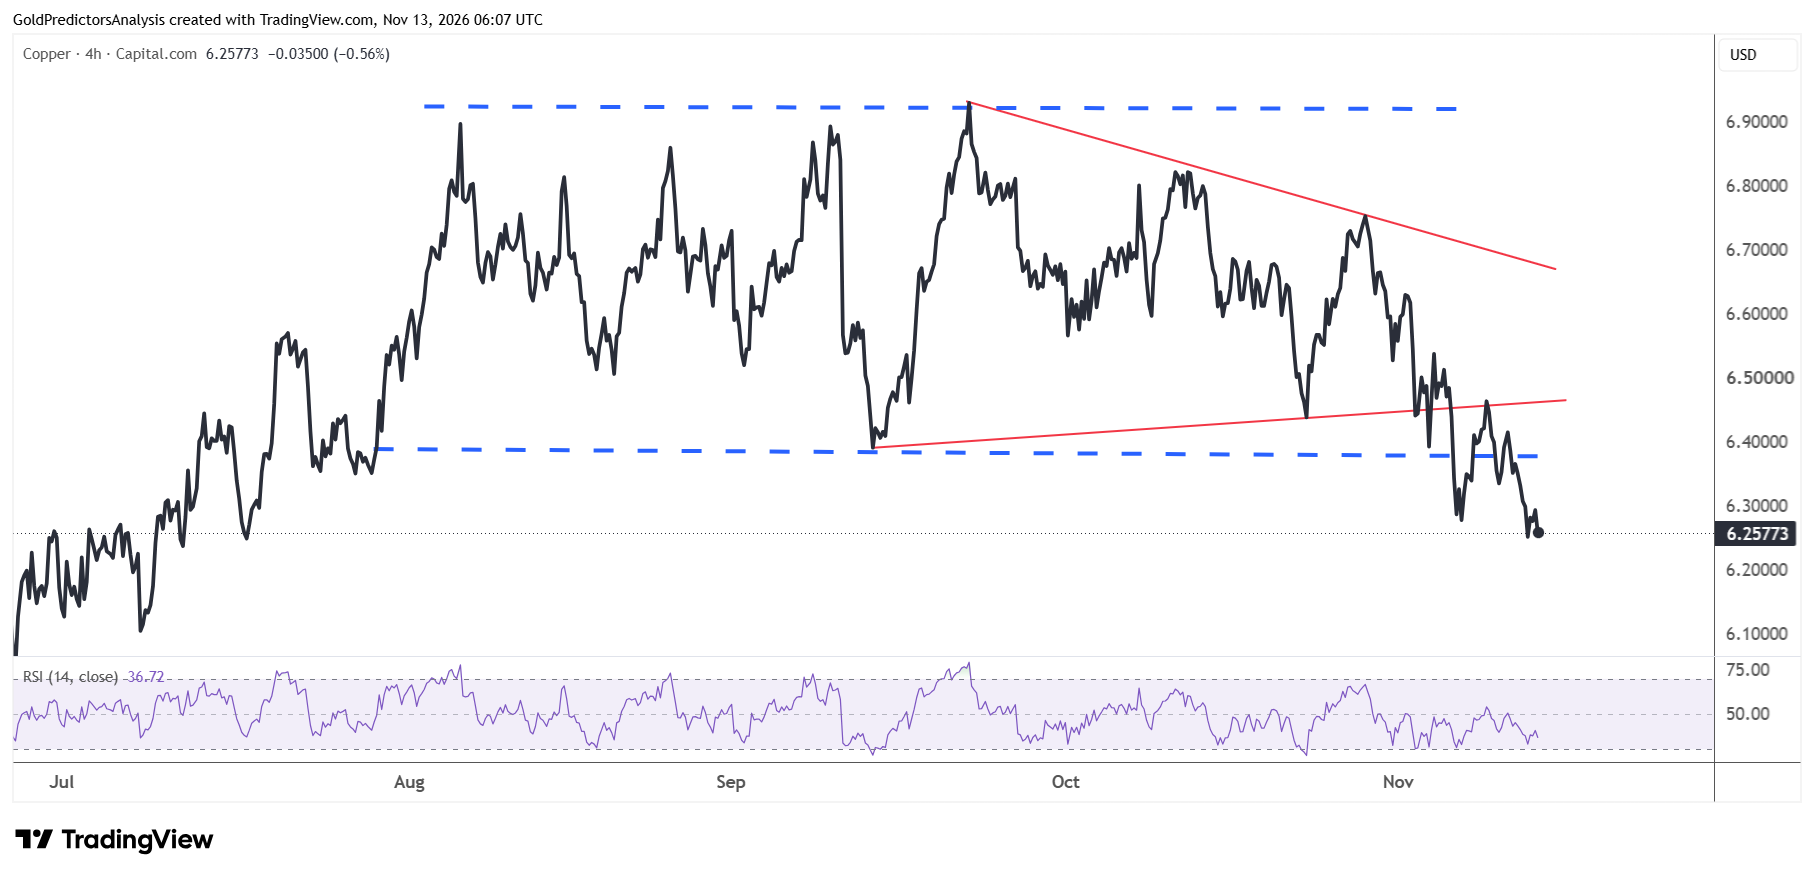
The 4-hour chart for copper shows that the price has broken below three months range and continues to drop. This suggests that the immediate support for copper lies in the range of $6.00-$6.20. A break below $6 will likely open way for further downside towards the $5.40 region.
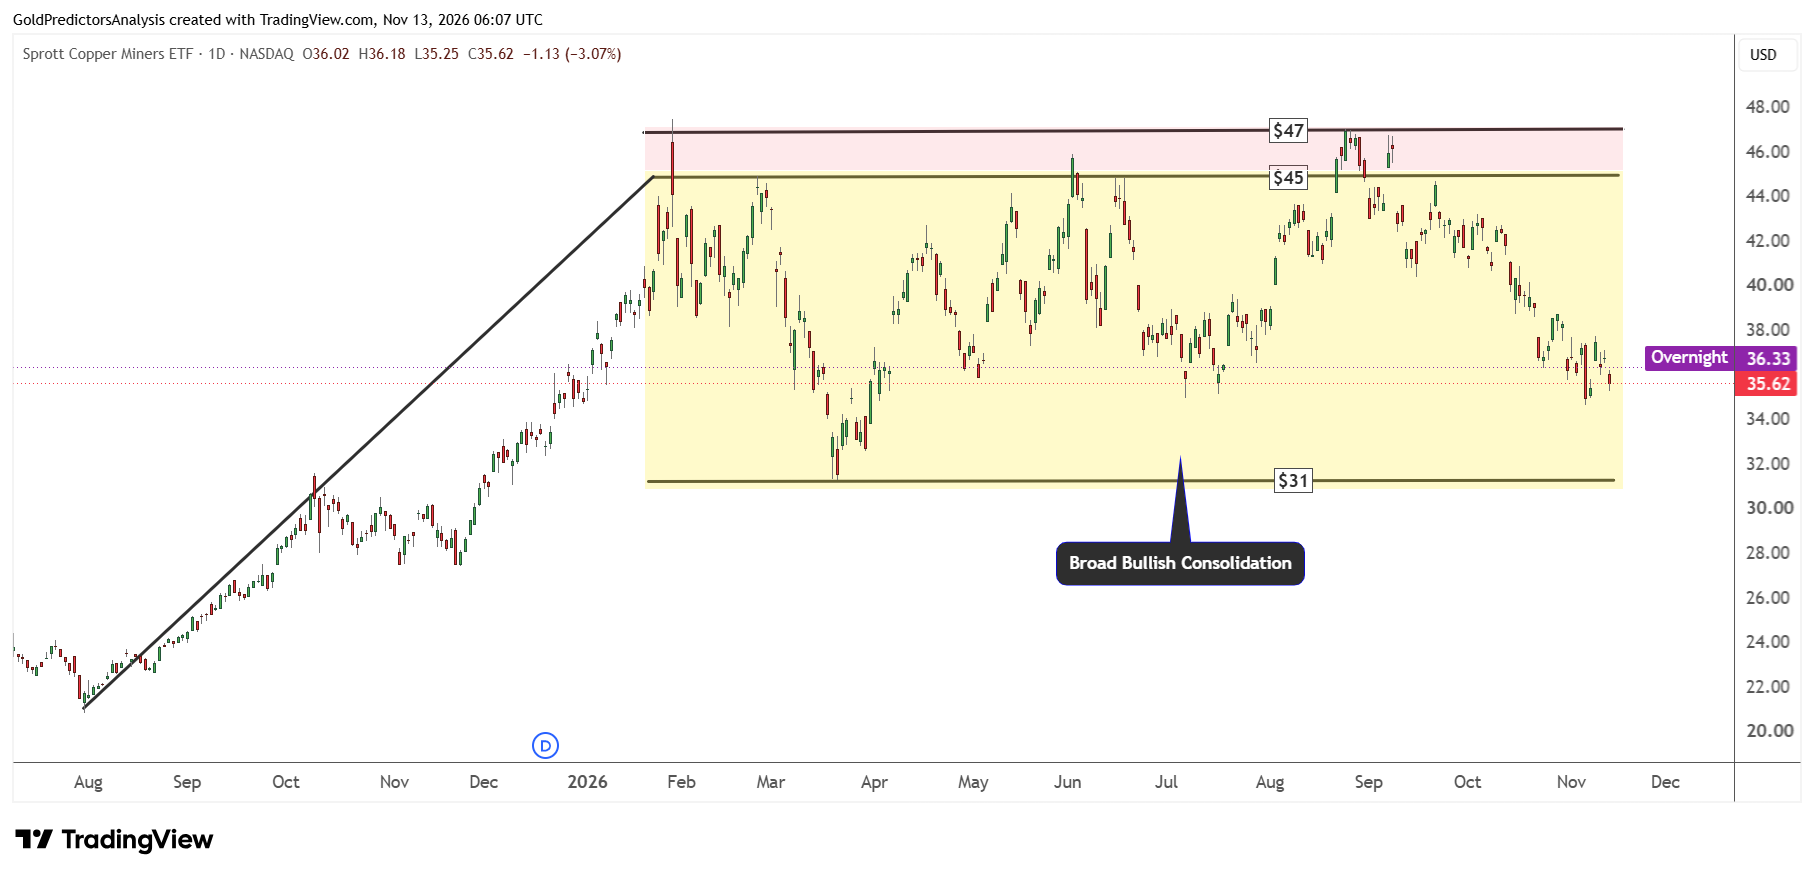
The technical chart for the Sprott Copper Miners ETF shows that it has been trading within strong consolidation zone between $31 and $45. The ETF price hit resistance in the $45-$47 region and continues to drop towards the $31 area. As long as the $31 area holds, the possibility of another rally towards higher levels is high.
Copper Price Forecast
Every new Copper analysis as it publishes, today's technical signal and key levels, live price — on one page.
See all Copper forecastsGlobal X Uranium ETF Rebound Potential From $30
The uranium market also remains under bearish pressure as seen in the chart below. The Global X Uranium ETF broke below the triangle pattern at $37 in October and triggered a strong drop towards the long term support near $30.
The ETF hit the low of $30.40 last week and rebounded, but the price remains under pressure in the short term. As long as the $30 level holds, the possibility of a rally towards $37 is high.
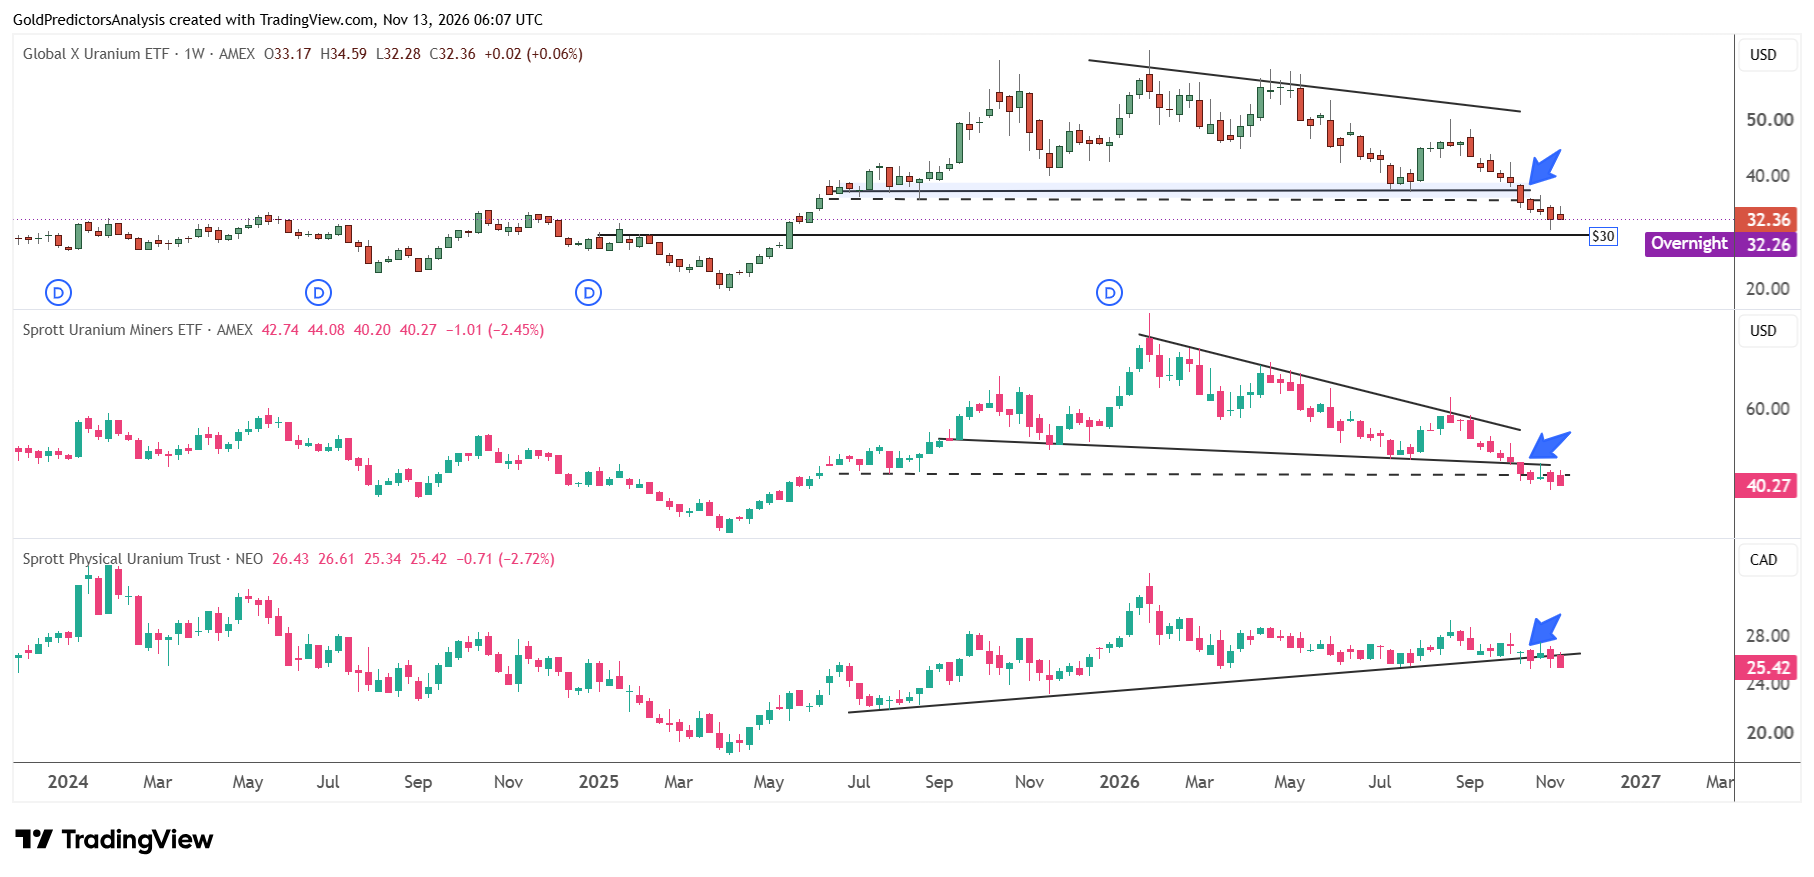
The Sprott Uranium Miners ETF also broke below the triangle pattern in October and remains in a negative trend. The next support level for the ETF lies near $37.50. A break below $37.50 will open the way for further downside towards the $28.50 area. But the recovery above $45.50 will open the way for further upside towards $53.
The Sprott Physical Uranium Trust has also broken below the rising trend line that stretches from the lows of July 2025. This suggests a negative trend but the Sprott Physical Trust has strong support near $23.50.
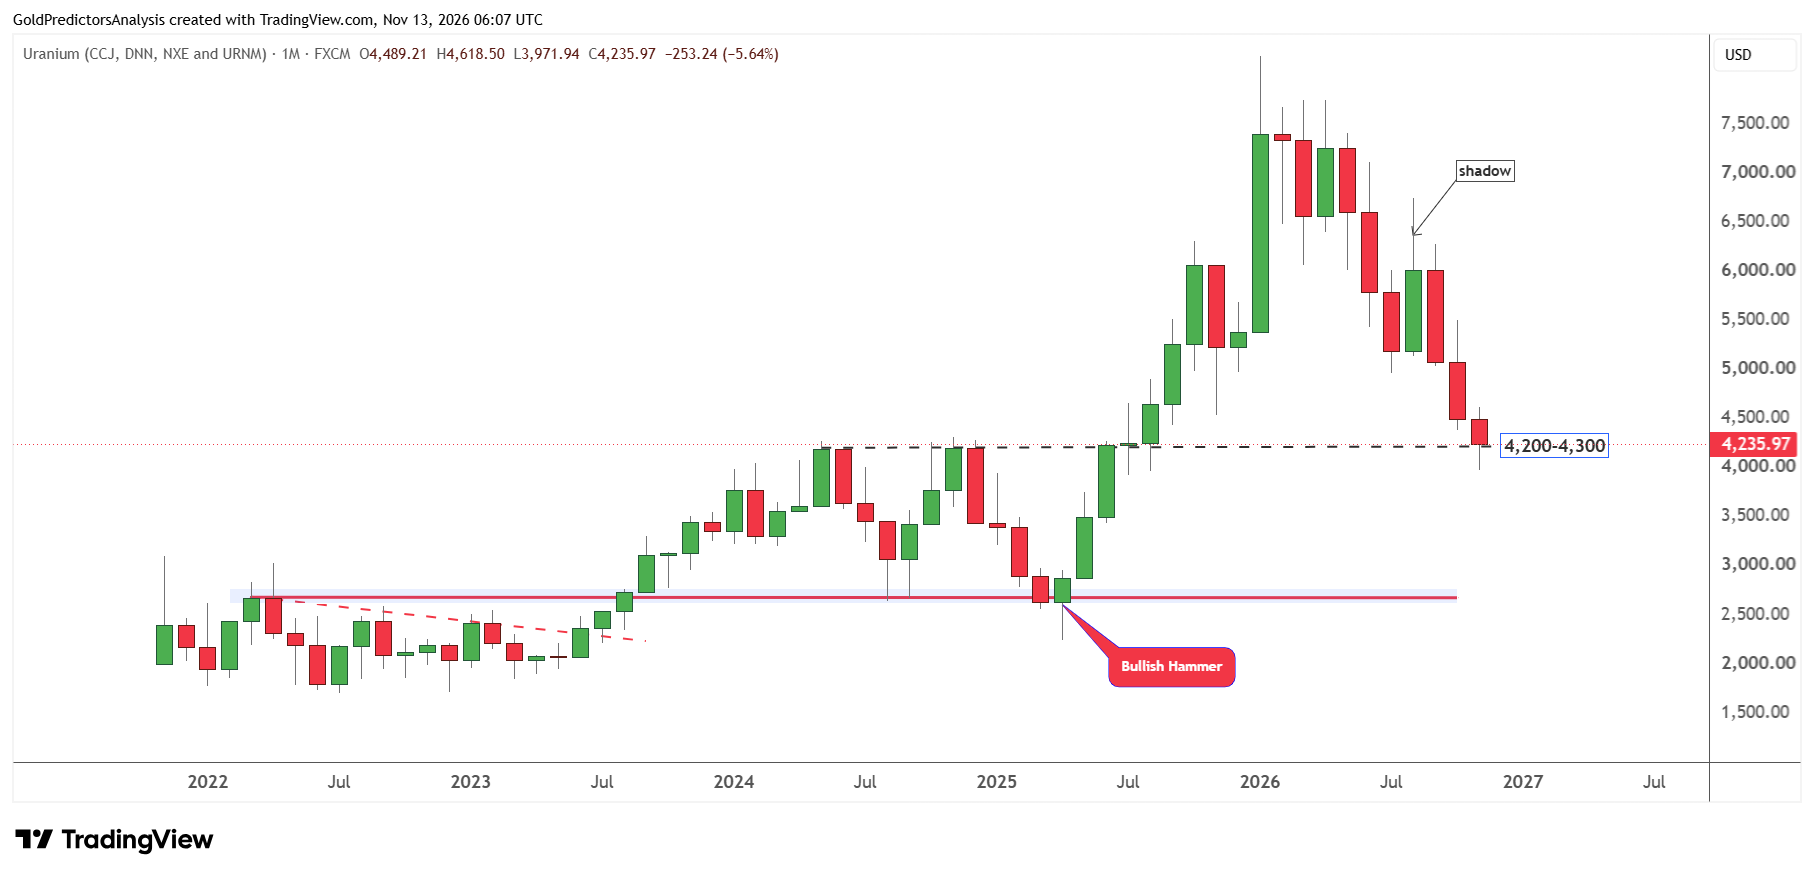
The chart below shows that the uranium market has reached a strong support region in the long term, with the uranium equity basket near the $4,200-$4,300 range. The equity basket hit a low of $3,971.94 and created a rebound. This support zone is significant in the long term and the uranium market may rebound from this zone.
Sprott, Global X and iShares Lithium ETFs Break Support
The lithium market also remains under extreme bearish pressure as seen in the chart below. The Sprott Lithium Miners ETF broke below the neckline of the head and shoulders pattern at $9 and continues to drop.
The ETF also broke below support at $7.50 in October. The Sprott Lithium Miners ETF now needs to break above $7.50 to open the way for rally towards $9. But a break below $6.50 will keep the ETF under bearish pressure and push the price further down towards the $5 area.
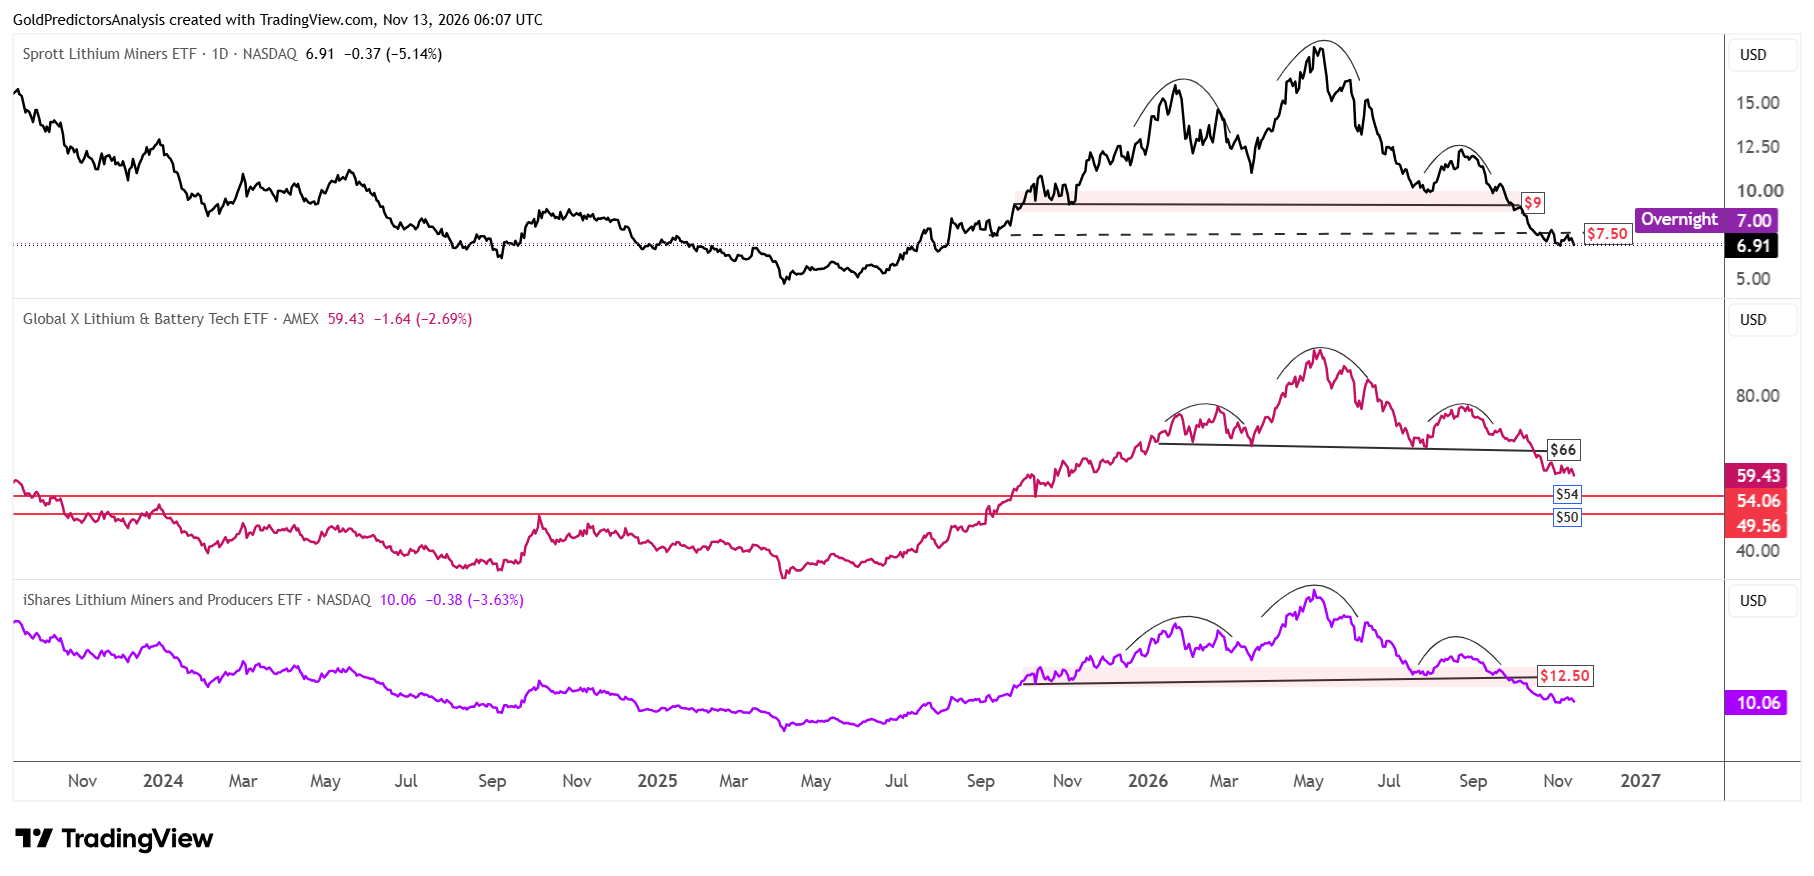
The Global X Lithium & Battery Tech ETF remains under bearish pressure after the break from the neckline of head and shoulders at $66. This bearish pressure points to the target of $54 in the short term. As long as the ETF price holds the $50 area, it may rebound towards $66. The ETF price must recover above $66 to open the way for further upside in the short term.
The iShares Lithium Miners and Producers ETF has broken below neckline of the head and shoulders at $12.50. The short term target remains $8.50. But a recovery above $12.50 will open the way for further upside towards the $16-$17 range.
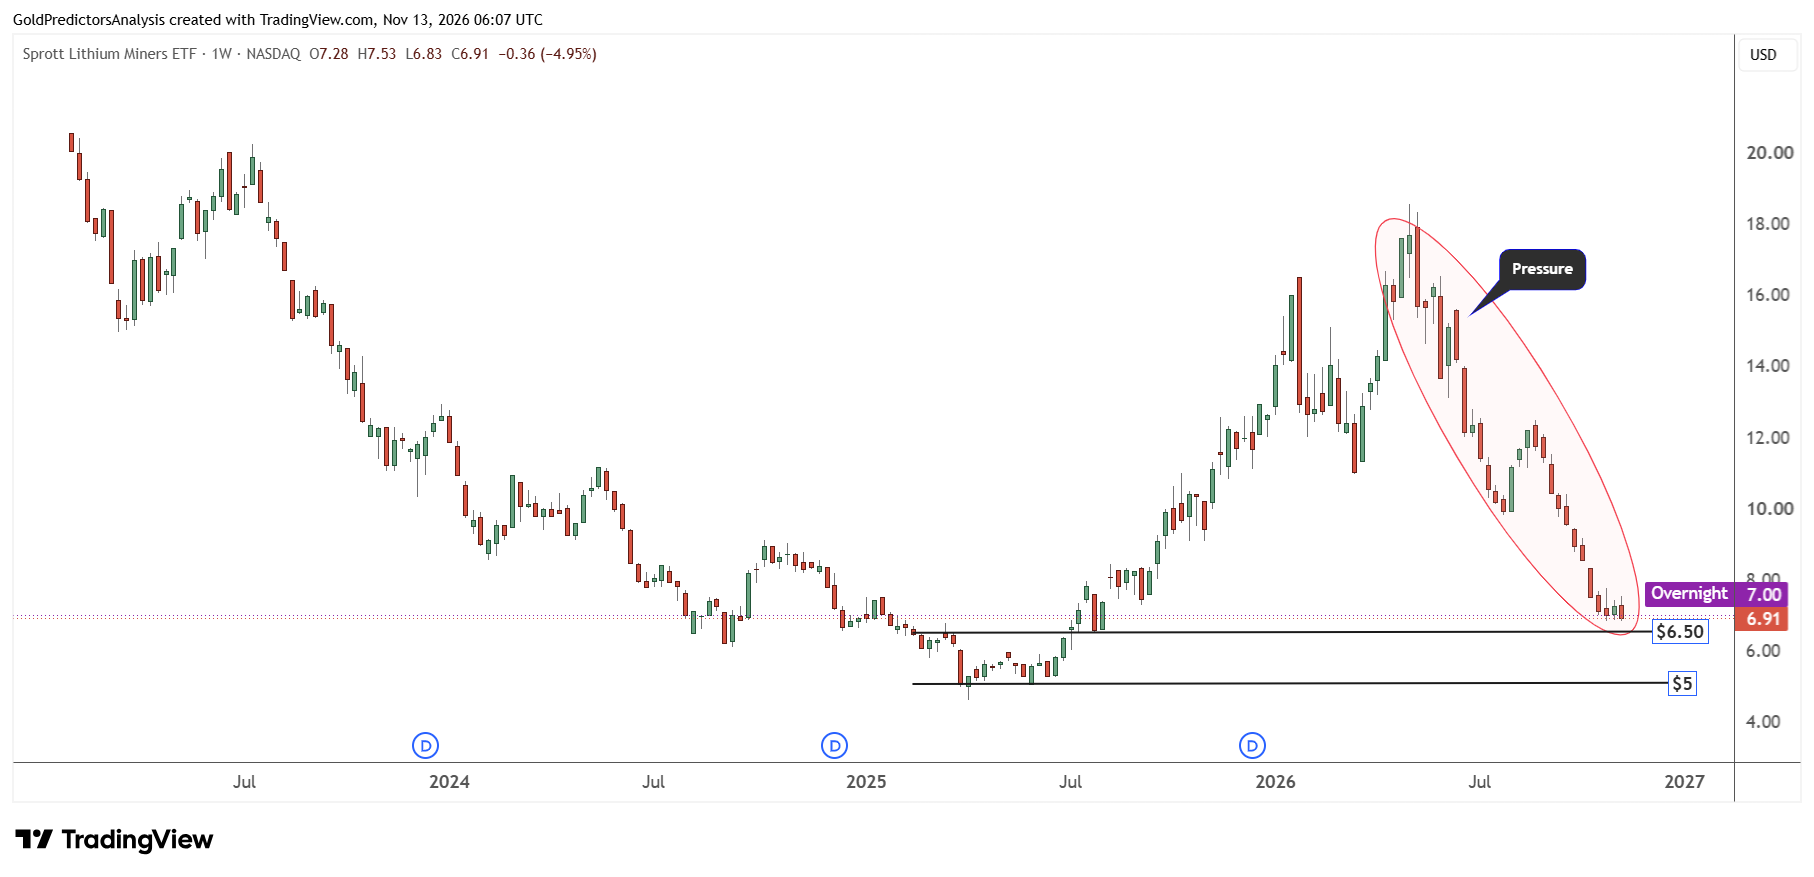
The weekly chart of Sprott Lithium Miners ETF shows strong bearish pressure in the lithium market. The chart shows that the ETF has been falling consistently after reaching the high of $18.56 in May. The immediate support level for the ETF is $6.50. A break below $6.50 will open the way for further downside towards the $5 area.
What to Watch Next: US PPI and Key ETF Levels
The producer inflation data from the US today may drive the move in the copper price in the short term. If the inflation data is hot, the US dollar may strengthen and it may keep the copper price under pressure. The next support for copper price is between $6 and $6.20. A break below $6 may open the way for further downside toward $5.40.
Uranium prices are approaching the support areas and may trigger a rebound. Global X Uranium ETF must hold the $30 level to open the way for a rally to $37.
The drop in inventories in China may support a rebound in prices if the battery producers start to buy at lower levels. A break above $7.50 in the Sprott Lithium Miners ETF may strengthen the case for recovery in lithium stocks.