
The Core CPI also met forecasts at 3.5%, lower than the prior 3.9%. For the Eurozone, the Current Account balance came in at €38.6 billion at 8:00 AM, up from €35.2 billion previously but slightly below the forecasted €35.8 billion.
These figures reflect subdued inflation in the UK and stable but slightly underperforming economic activity in the Eurozone.
Events Ahead
Looking ahead, at 11:00 AM, the UK will release its Monetary Policy Summary, with the MPC Official Bank Rate Votes expected to remain at 0-2-7 and the Official Bank Rate at 5.25%. These announcements could provide insight into future monetary policy directions, affecting the GBP/USD.
In the U.S., key data releases at 12:30 PM include Unemployment Claims, forecasted at 235,000 compared to the previous 242,000, and Building Permits, expected to slightly increase to 1.45 million from 1.44 million.
The Philly Fed Manufacturing Index is projected to rise to 4.8 from 4.5. These figures will be critical for the Dollar Index (DXY), currently trading at $105.305, as they could influence the Federal Reserve’s monetary policy stance.
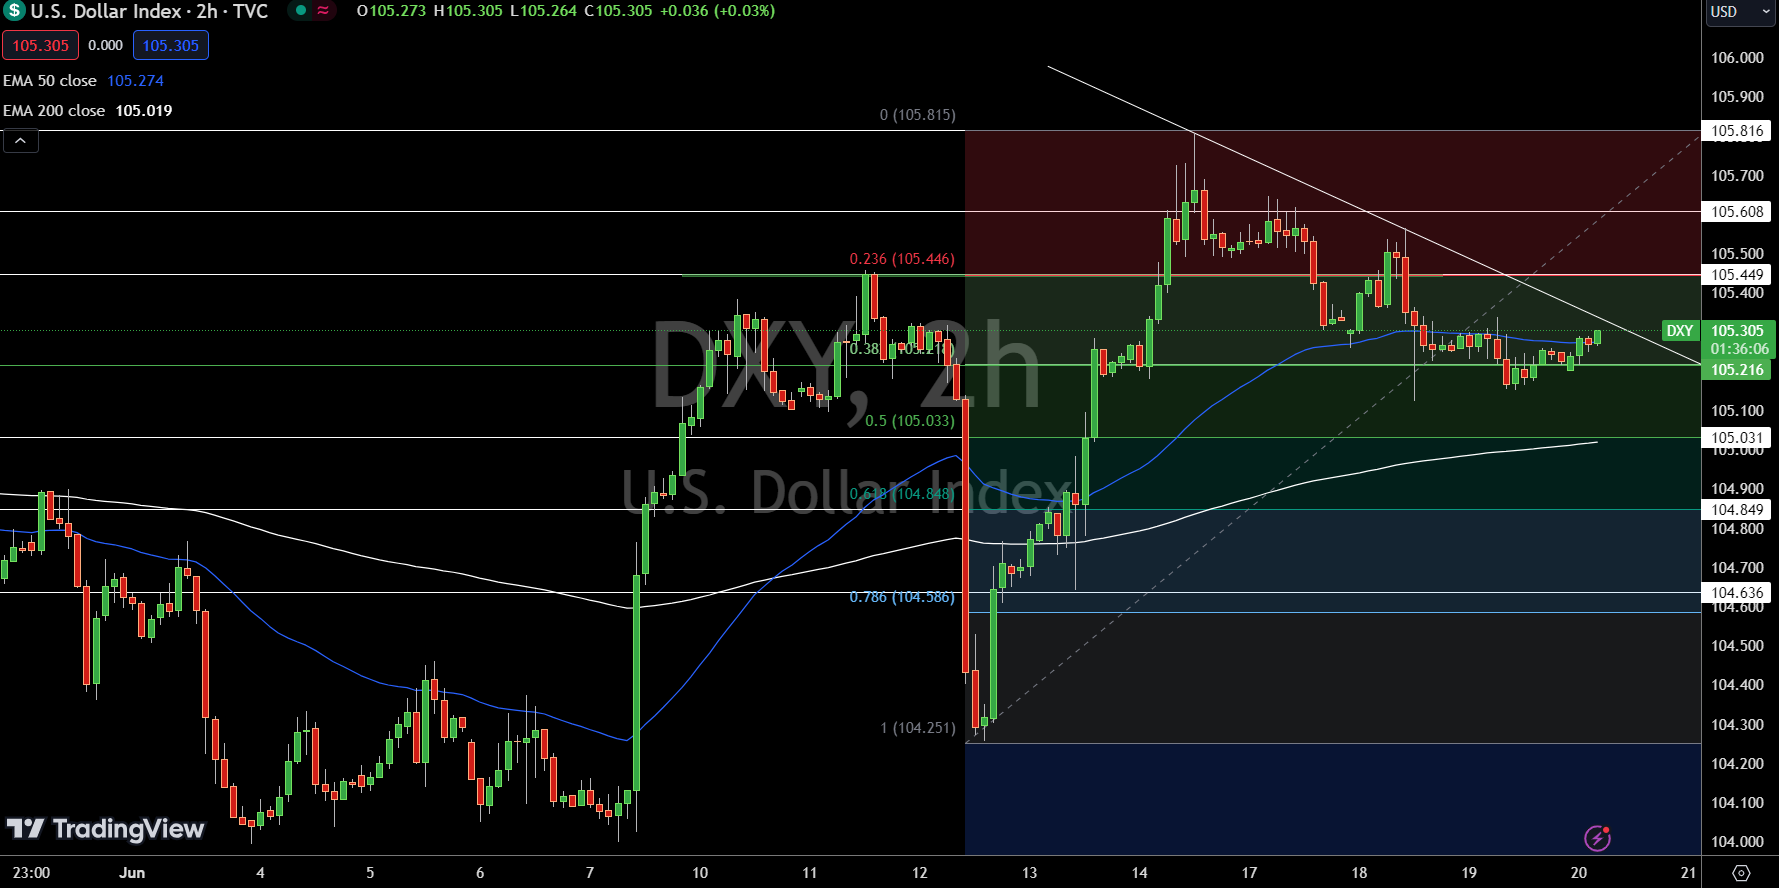
The Dollar Index (DXY) is currently trading at $105.305, reflecting a slight increase of 0.06%. The pivot point at $105.216 is critical for determining the next price movement. Immediate resistance is noted at $105.449, followed by $105.608 and $105.816.
On the downside, immediate support is found at $105.031, with further support at $104.849 and $104.636.
Technical indicators show the 50-day Exponential Moving Average (EMA) at $105.274 and the 200-day EMA at $105.019. These EMAs provide key levels of support and resistance, indicating the overall trend direction. The current market stance suggests a bullish outlook above the $105.216 pivot point.
EUR/USD Technical Forecast
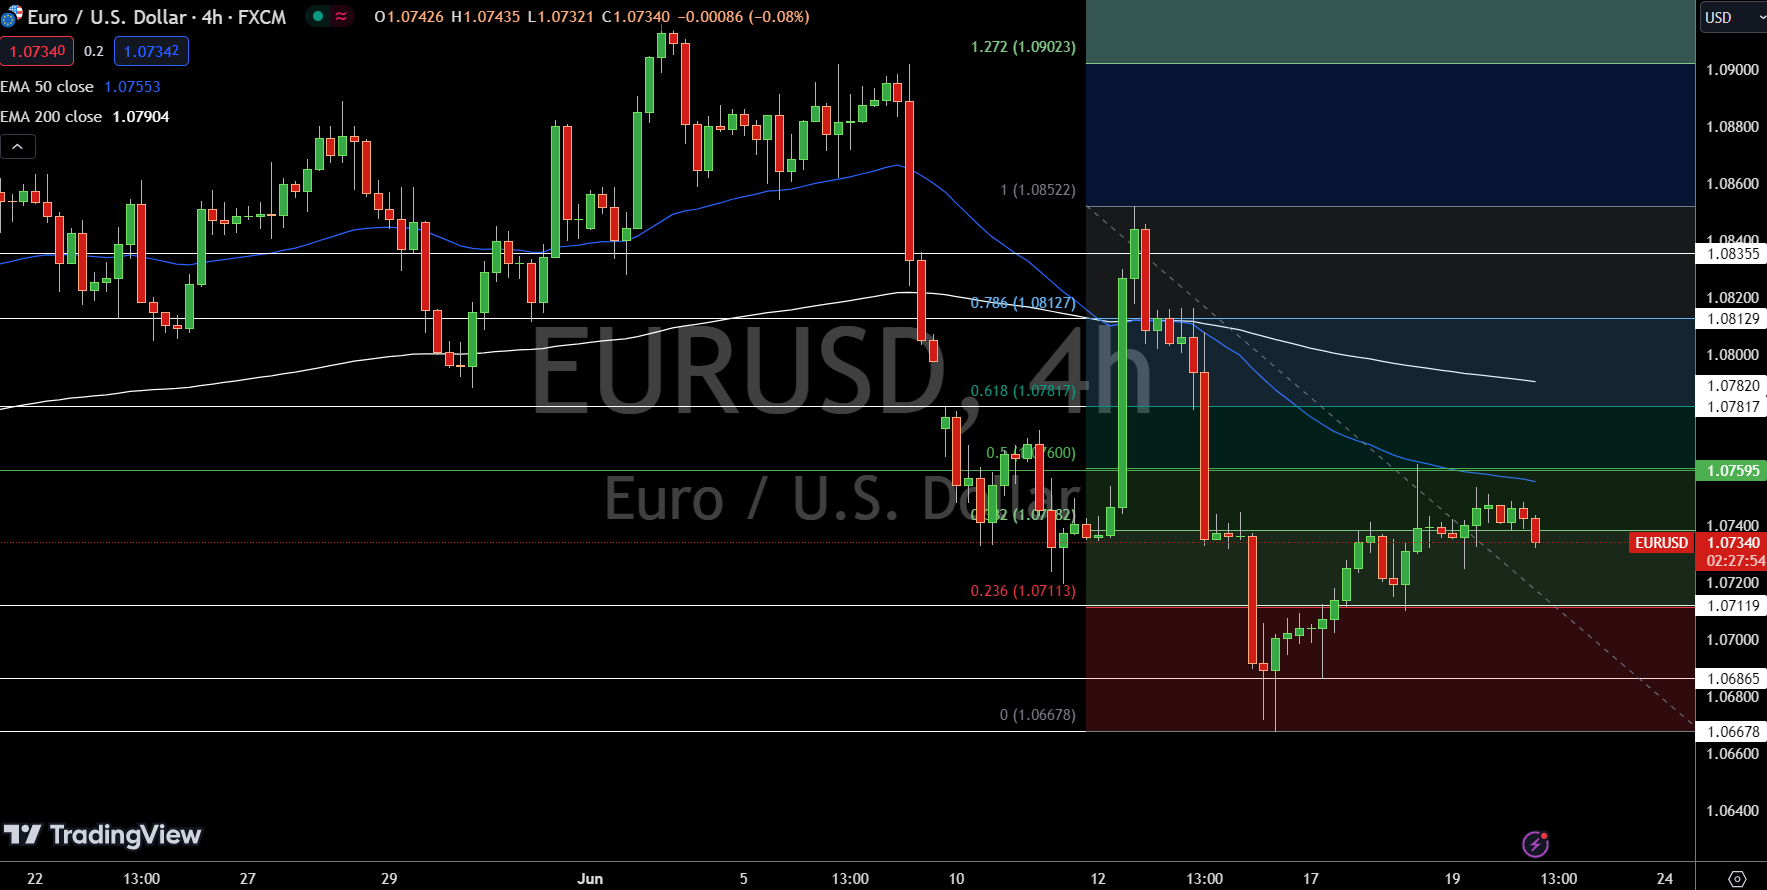
Technical indicators show the 50-day Exponential Moving Average (EMA) at $1.08519 and the 200-day EMA at $1.08200. The outlook remains bearish below the pivot point of $1.07902. A break above this level could shift the bias to bullish.
GBP/USD Technical Forecast
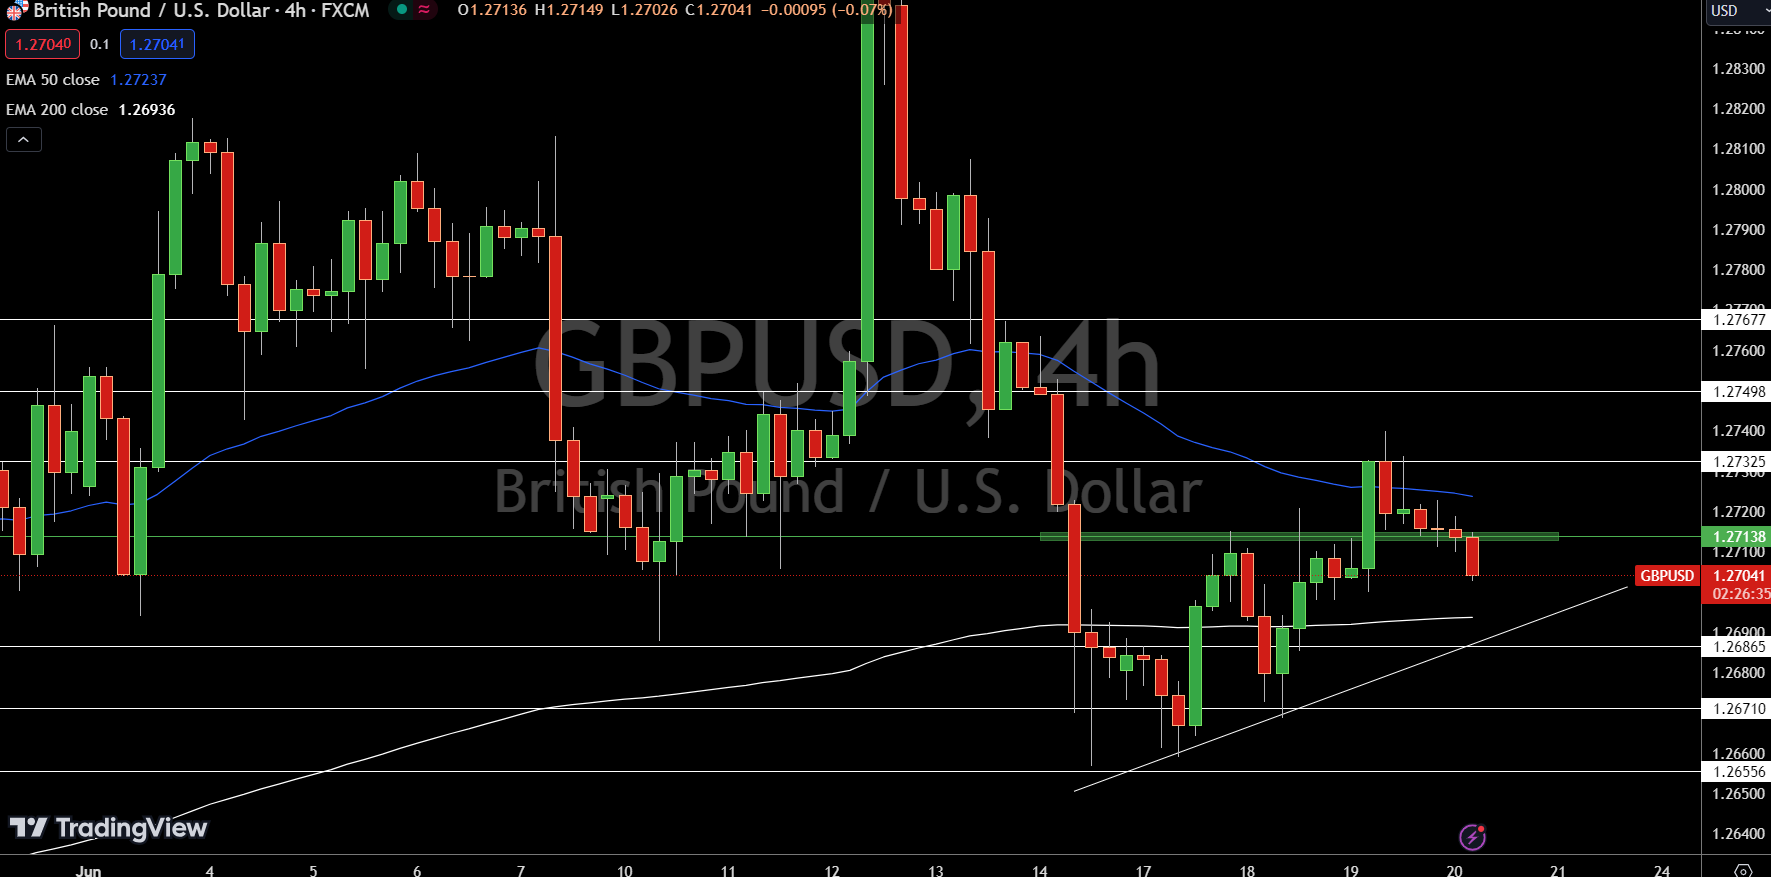
The GBP/USD is trading at $1.27053, down by 0.08%. On the 4-hour chart, the pivot point at $1.27067 is critical for determining the next price move. Immediate resistance levels are $1.27462, $1.27930, and $1.28236. Immediate support is at $1.26744, followed by $1.26448 and $1.26152.
Technical indicators show the 50-day Exponential Moving Average (EMA) at $1.27147 and the 200-day EMA at $1.26282. The outlook remains bearish below $1.27067, but a break above this level could shift the bias towards a bullish trend.
For a look at all of today’s economic events, check out our economic calendar.