Financial markets are under pressure following the 25% tariff announcement on foreign vehicles and parts. The S&P 500 (SPX) slipped to 5700 as investors reacted swiftly to the policy shift. With Goldman Sachs projecting large equity outflows, risk appetite is fading. Moreover, stock confidence is dropping, and investors are moving capital into safer assets.
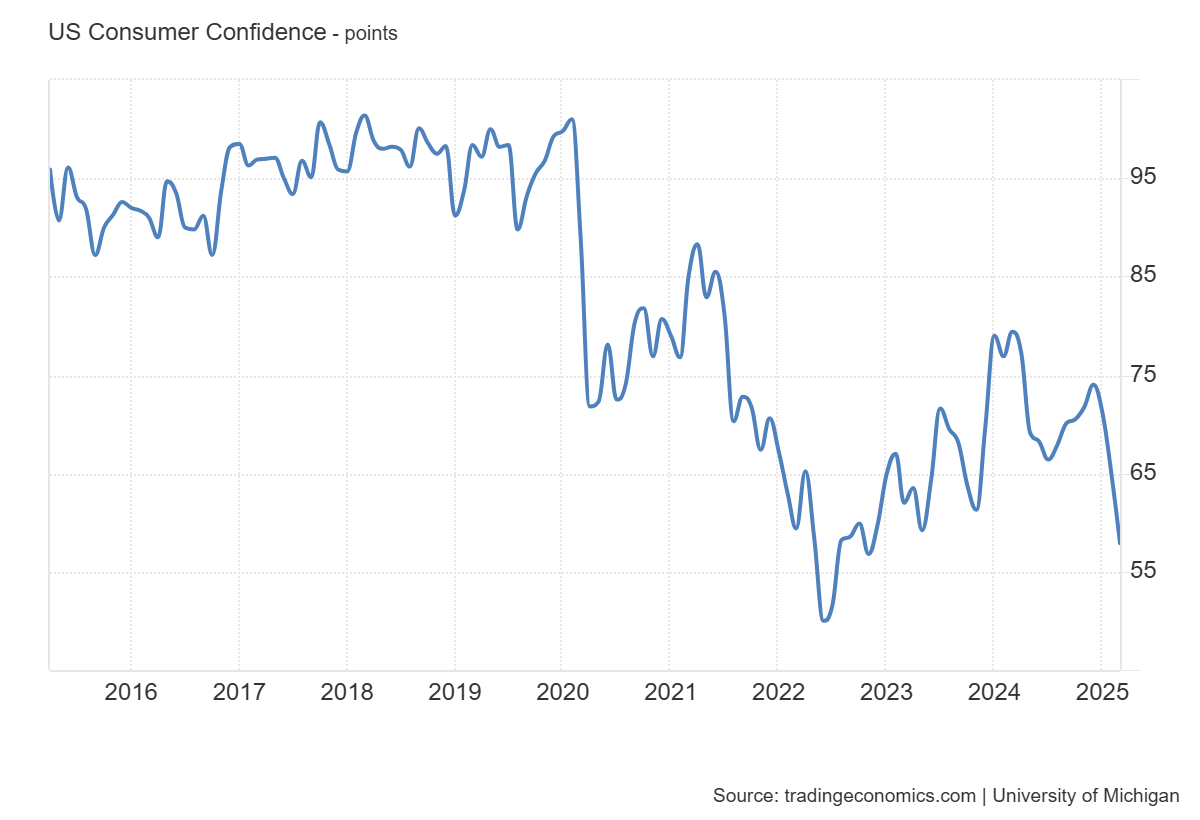
On the other hand, consumer sentiment continues to deteriorate. The chart below shows that US consumer sentiment has plunged to 57.9 in March 2025, the lowest level since November 2022. This sharp decline in sentiment increases demand for safe-haven assets like gold (XAU) as investors seek protection from economic uncertainty.
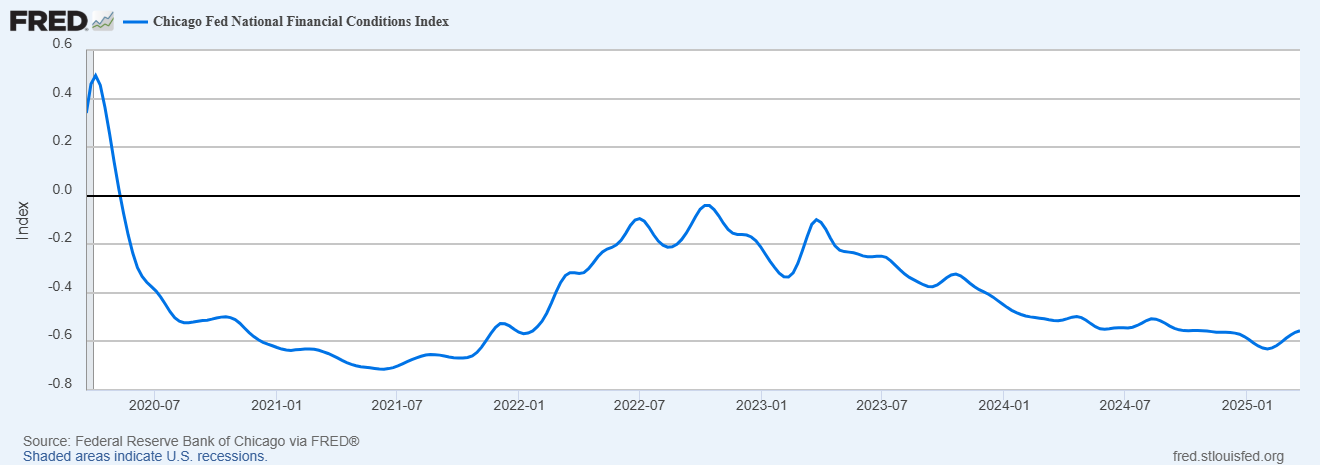
Moreover, the Chicago Fed’s National Financial Conditions Index climbed back to -0.556 on March 21, showing a shift toward tightening, even if conditions remain loose. Market volatility and rising inflation worries are amplifying investor anxiety. As fear spreads across markets, gold and silver (XAG) will likely see stronger inflows, driving prices higher in the near term.
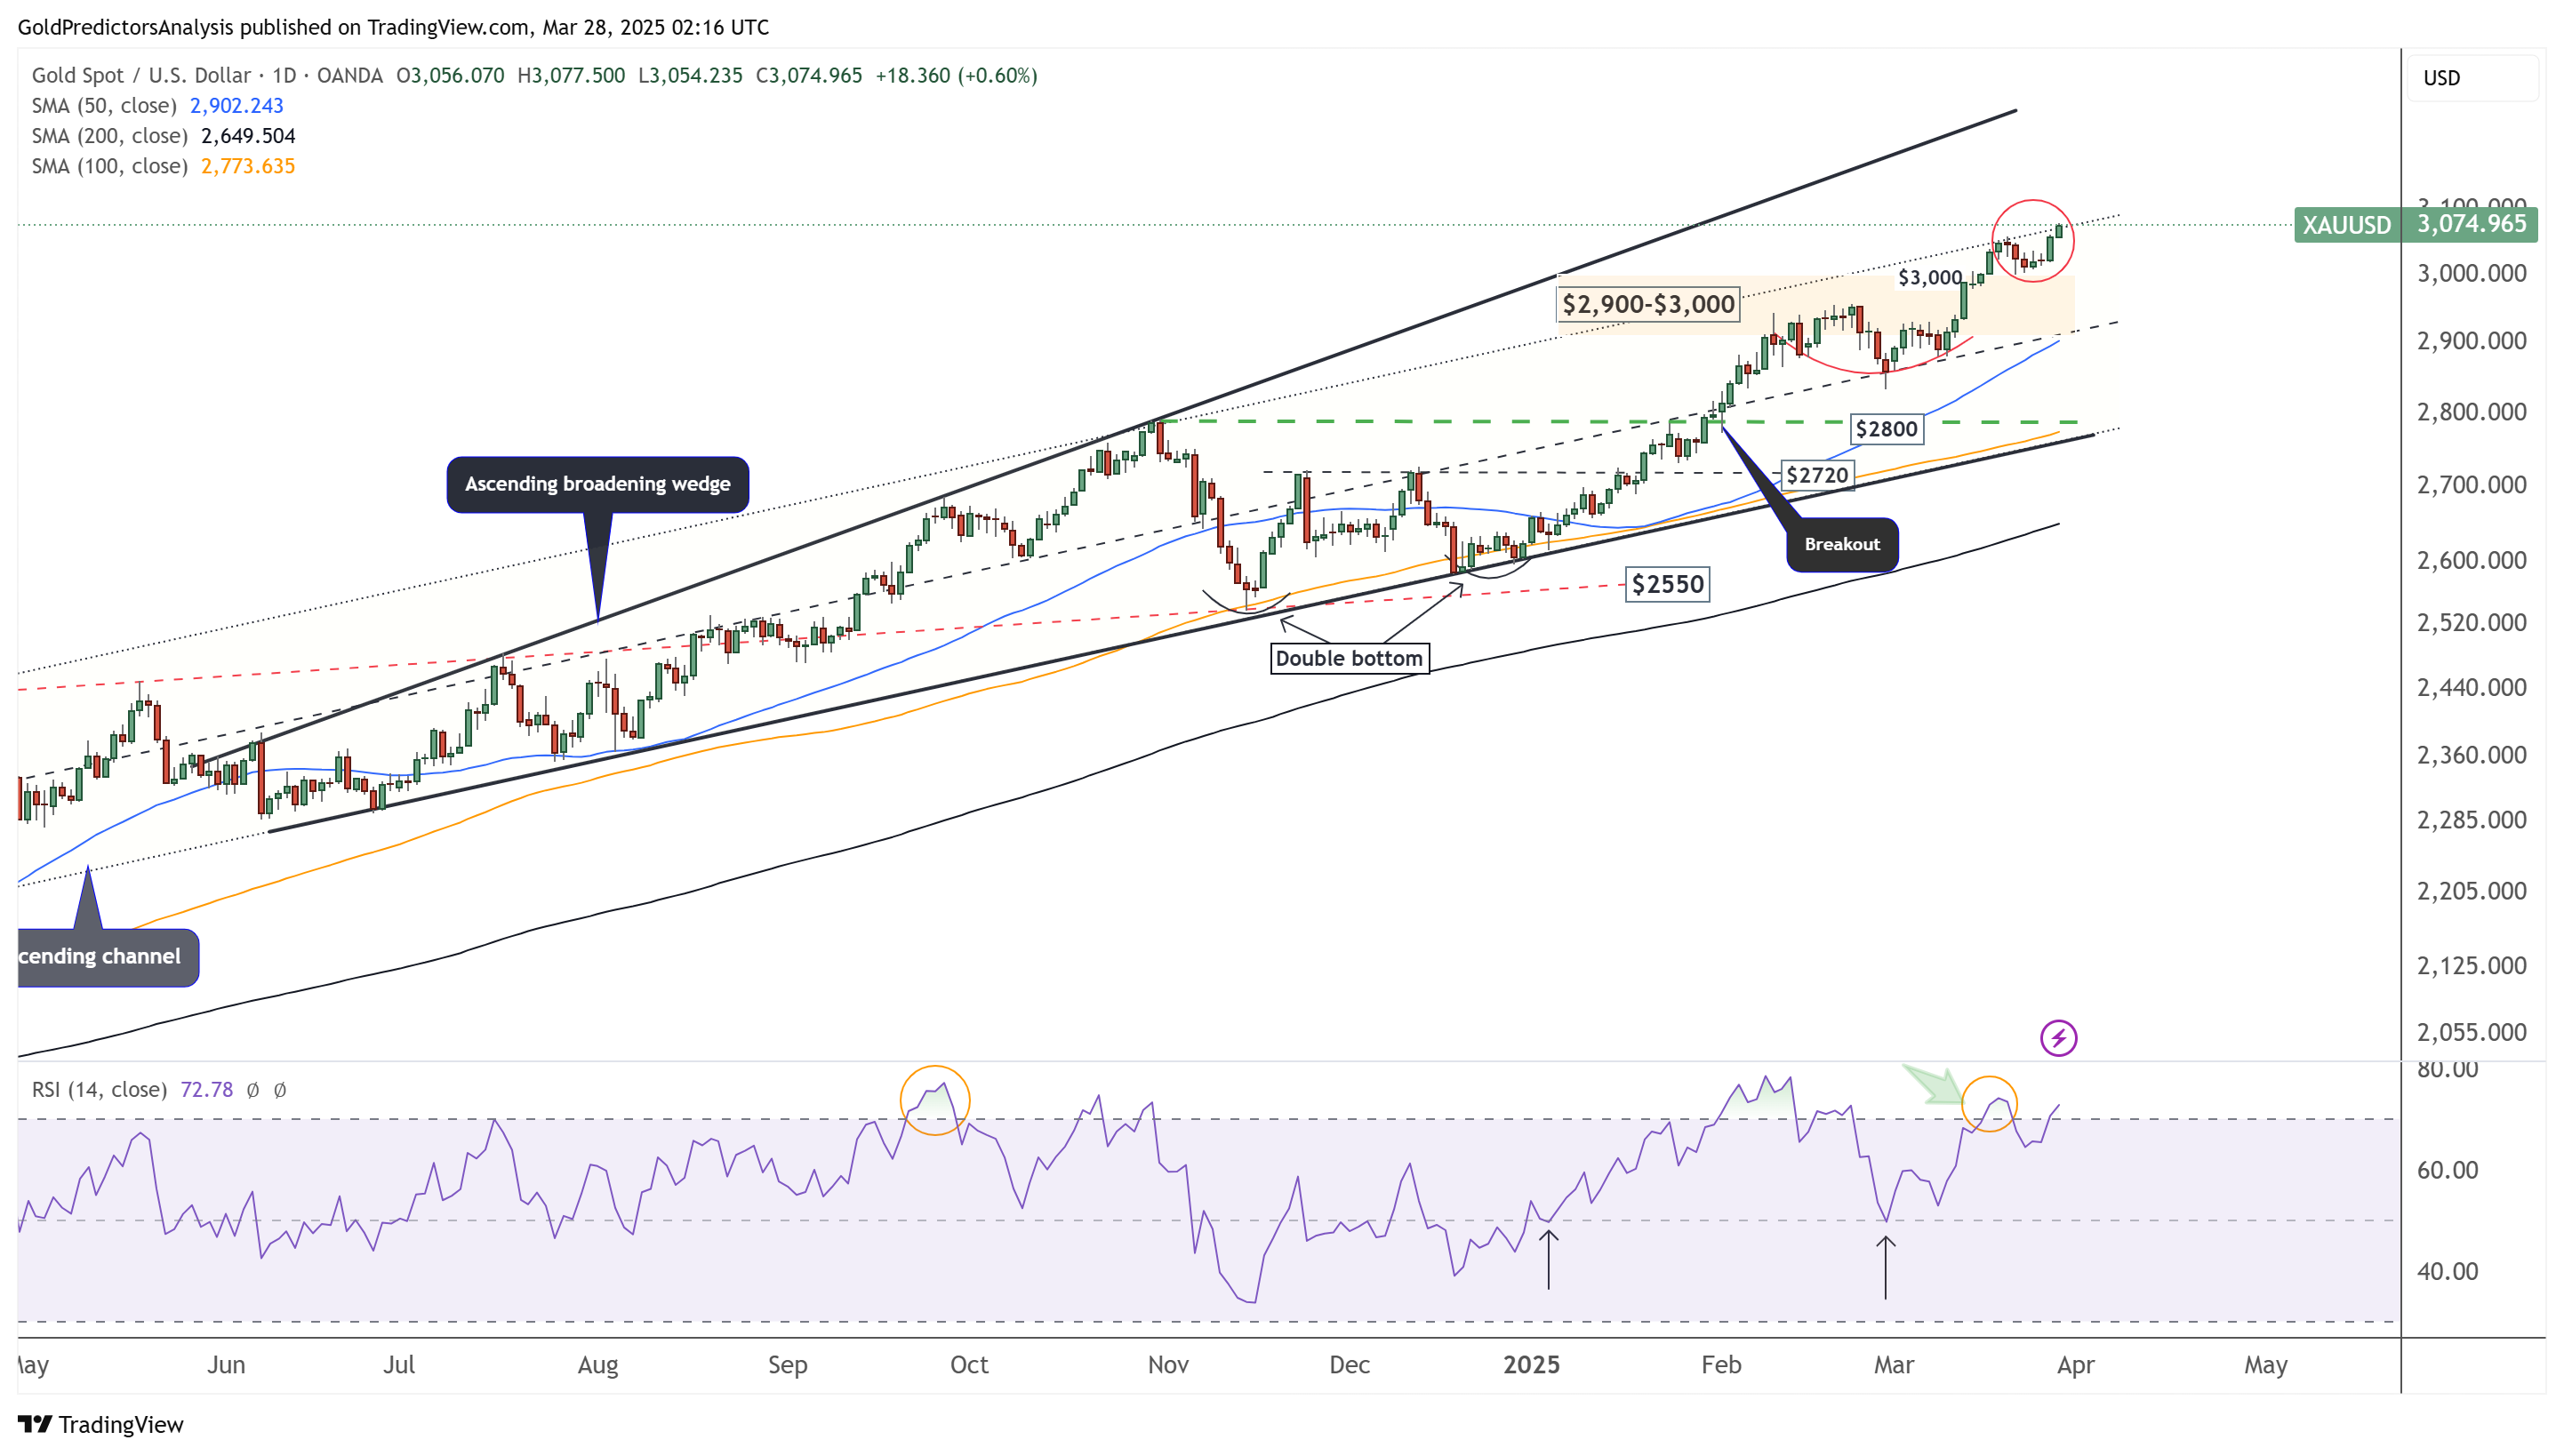
Spot gold is breaking above $3,050, opening the door for higher prices above $3,200. Moreover, silver also draws support from these macro shifts. With 10-year Treasury yields pushing toward the 4.4% mark and inflation expectations rising, both metals are positioned to benefit as traditional financial assets face renewed pressure.

Gold (XAU) Technical Analysis
Gold Daily Chart – Breakout
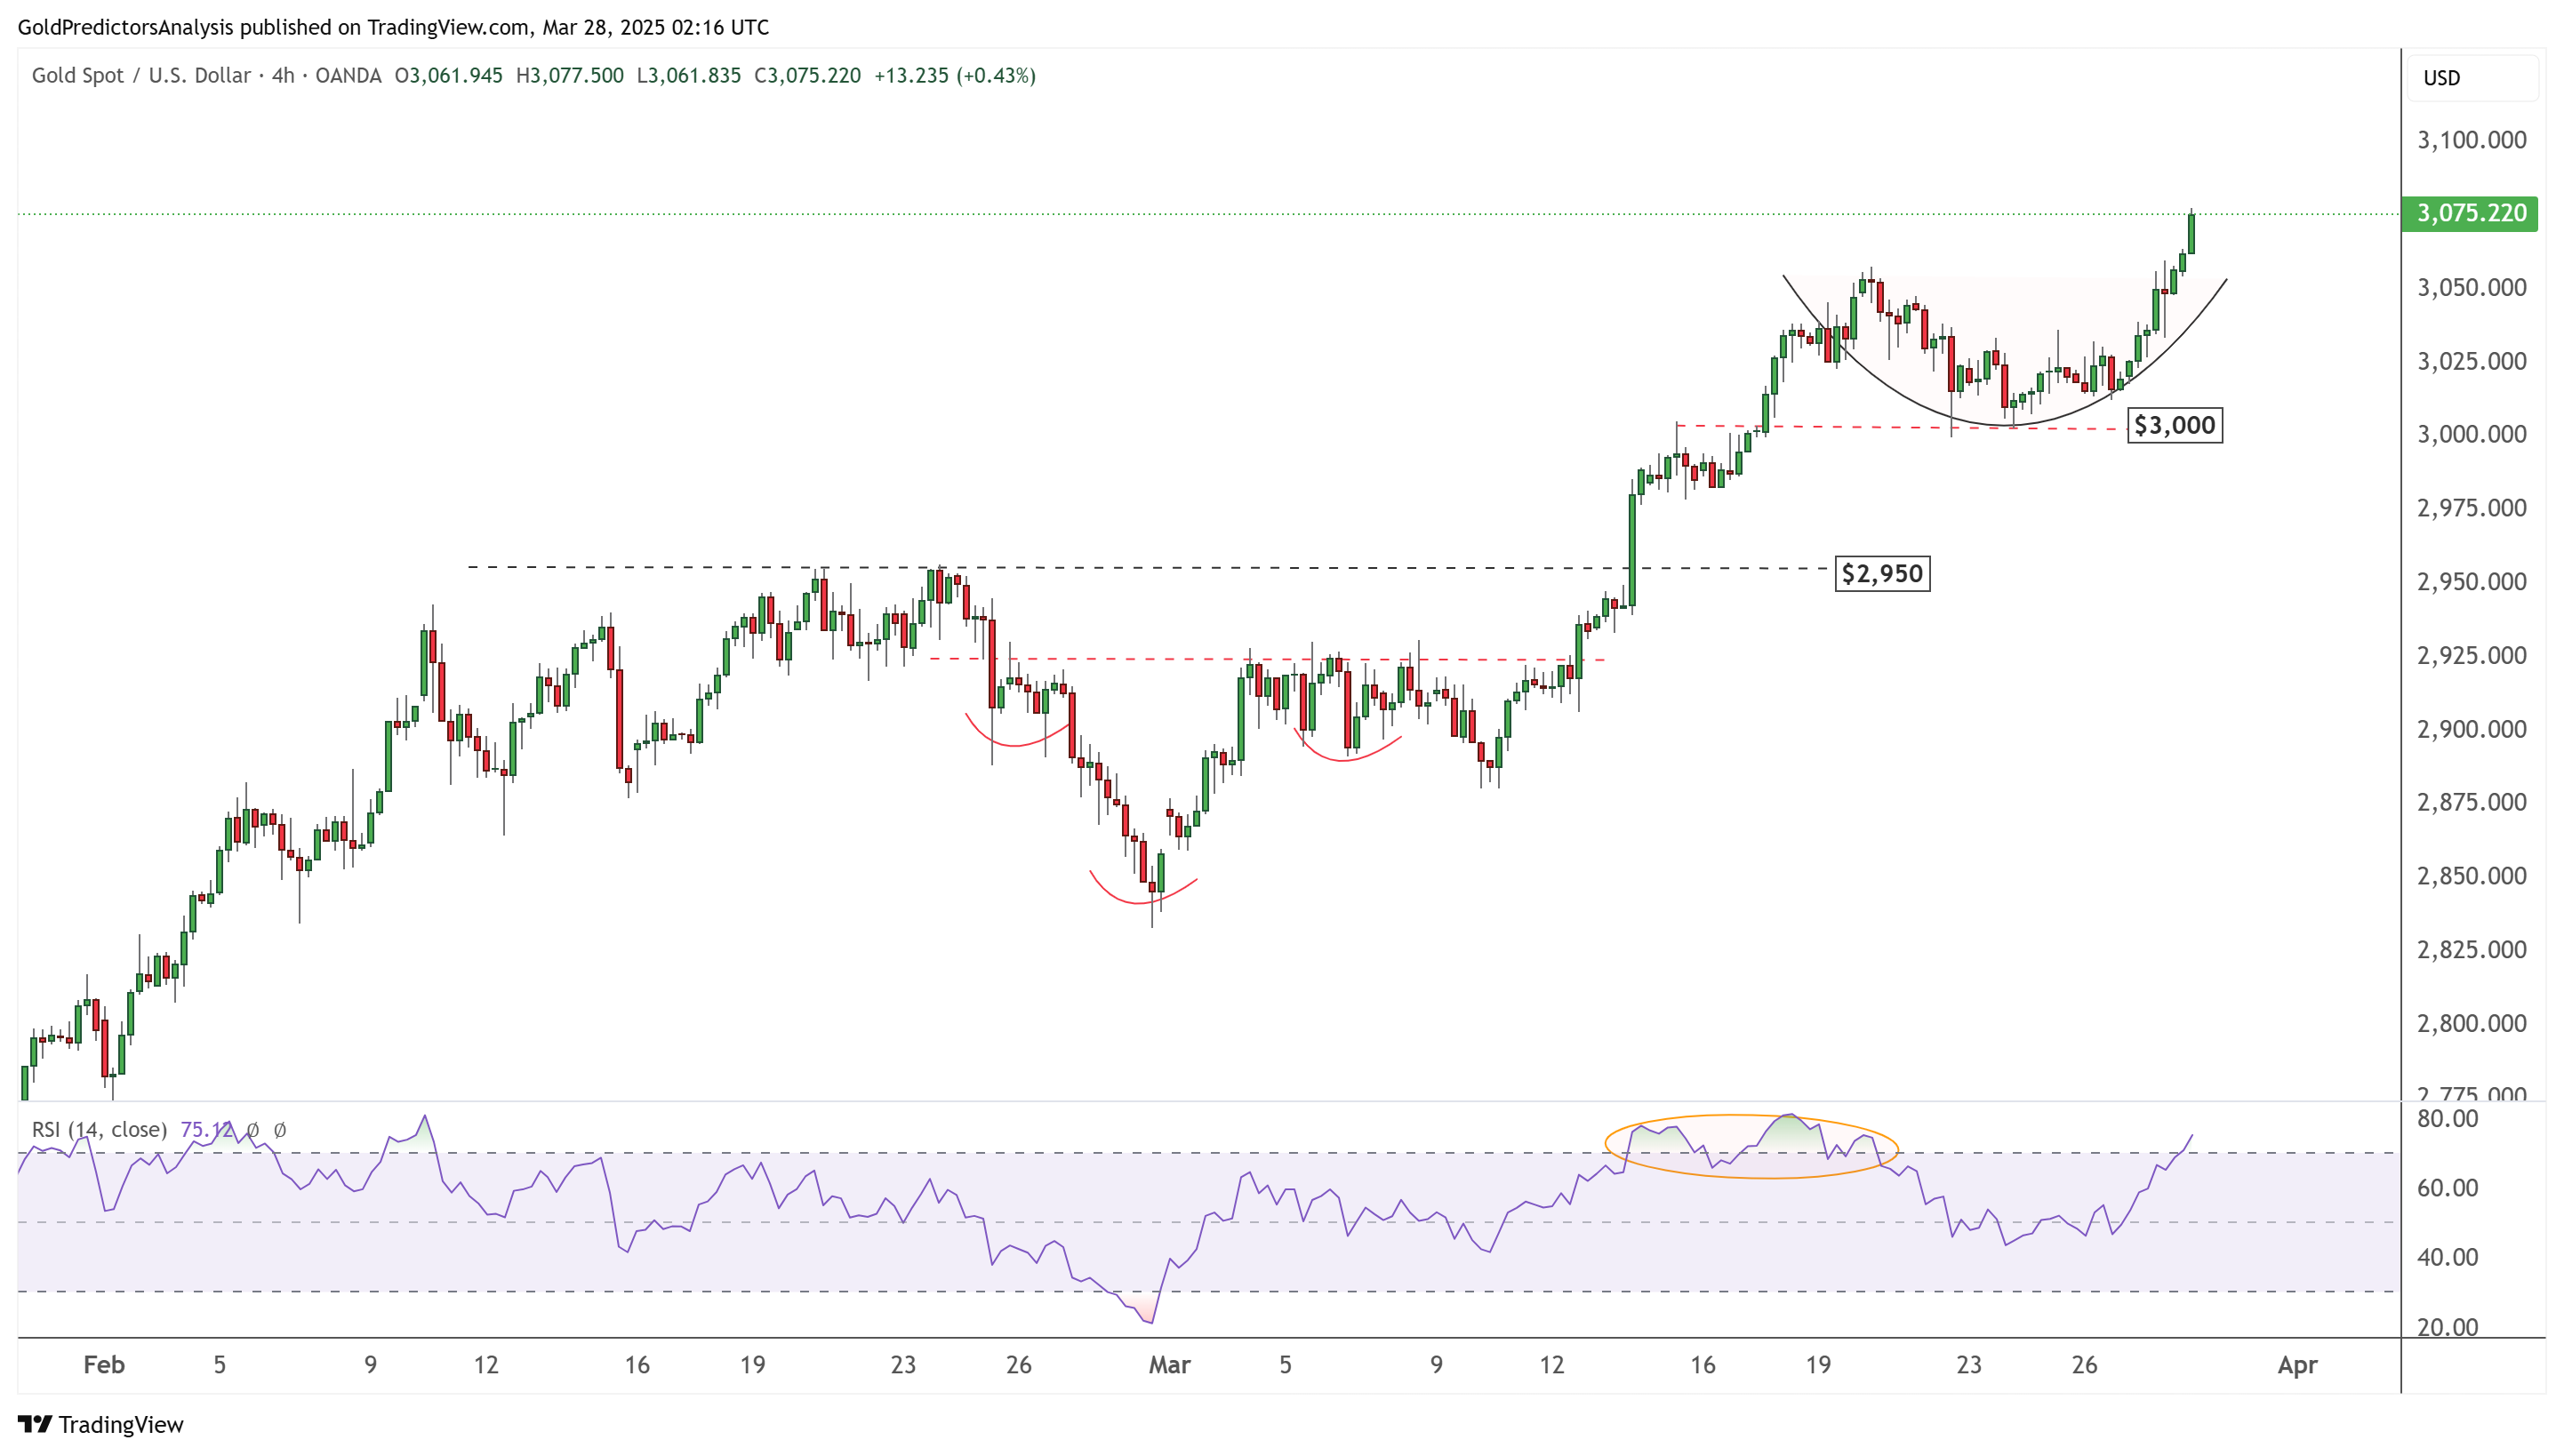
The daily chart for gold shows that the price has broken the record level of $3,050 and is attempting to break the upper boundary of ascending channel resistance at $3,080. A breakout from this channel would open the door for a long-term sustained rally. The price ignores overbought conditions, indicating that gold is in surge mode with strong volatility. Short-term price action suggests that gold is preparing to move above $3,200 if the price breaks the $3,080 level.
Gold Price Forecast
Every new Gold analysis as it publishes, today's technical signal and key levels, live price — on one page.
See all Gold forecastsGold 4-Hour Chart – Cup Pattern
The 4-hour chart shows that the price formed a cup pattern following the inverted head and shoulders pattern. The breakout from this formation indicates that gold is entering a surge move.
Silver (XAG) Technical Analysis
Silver Daily Chart – Preparation for Surge
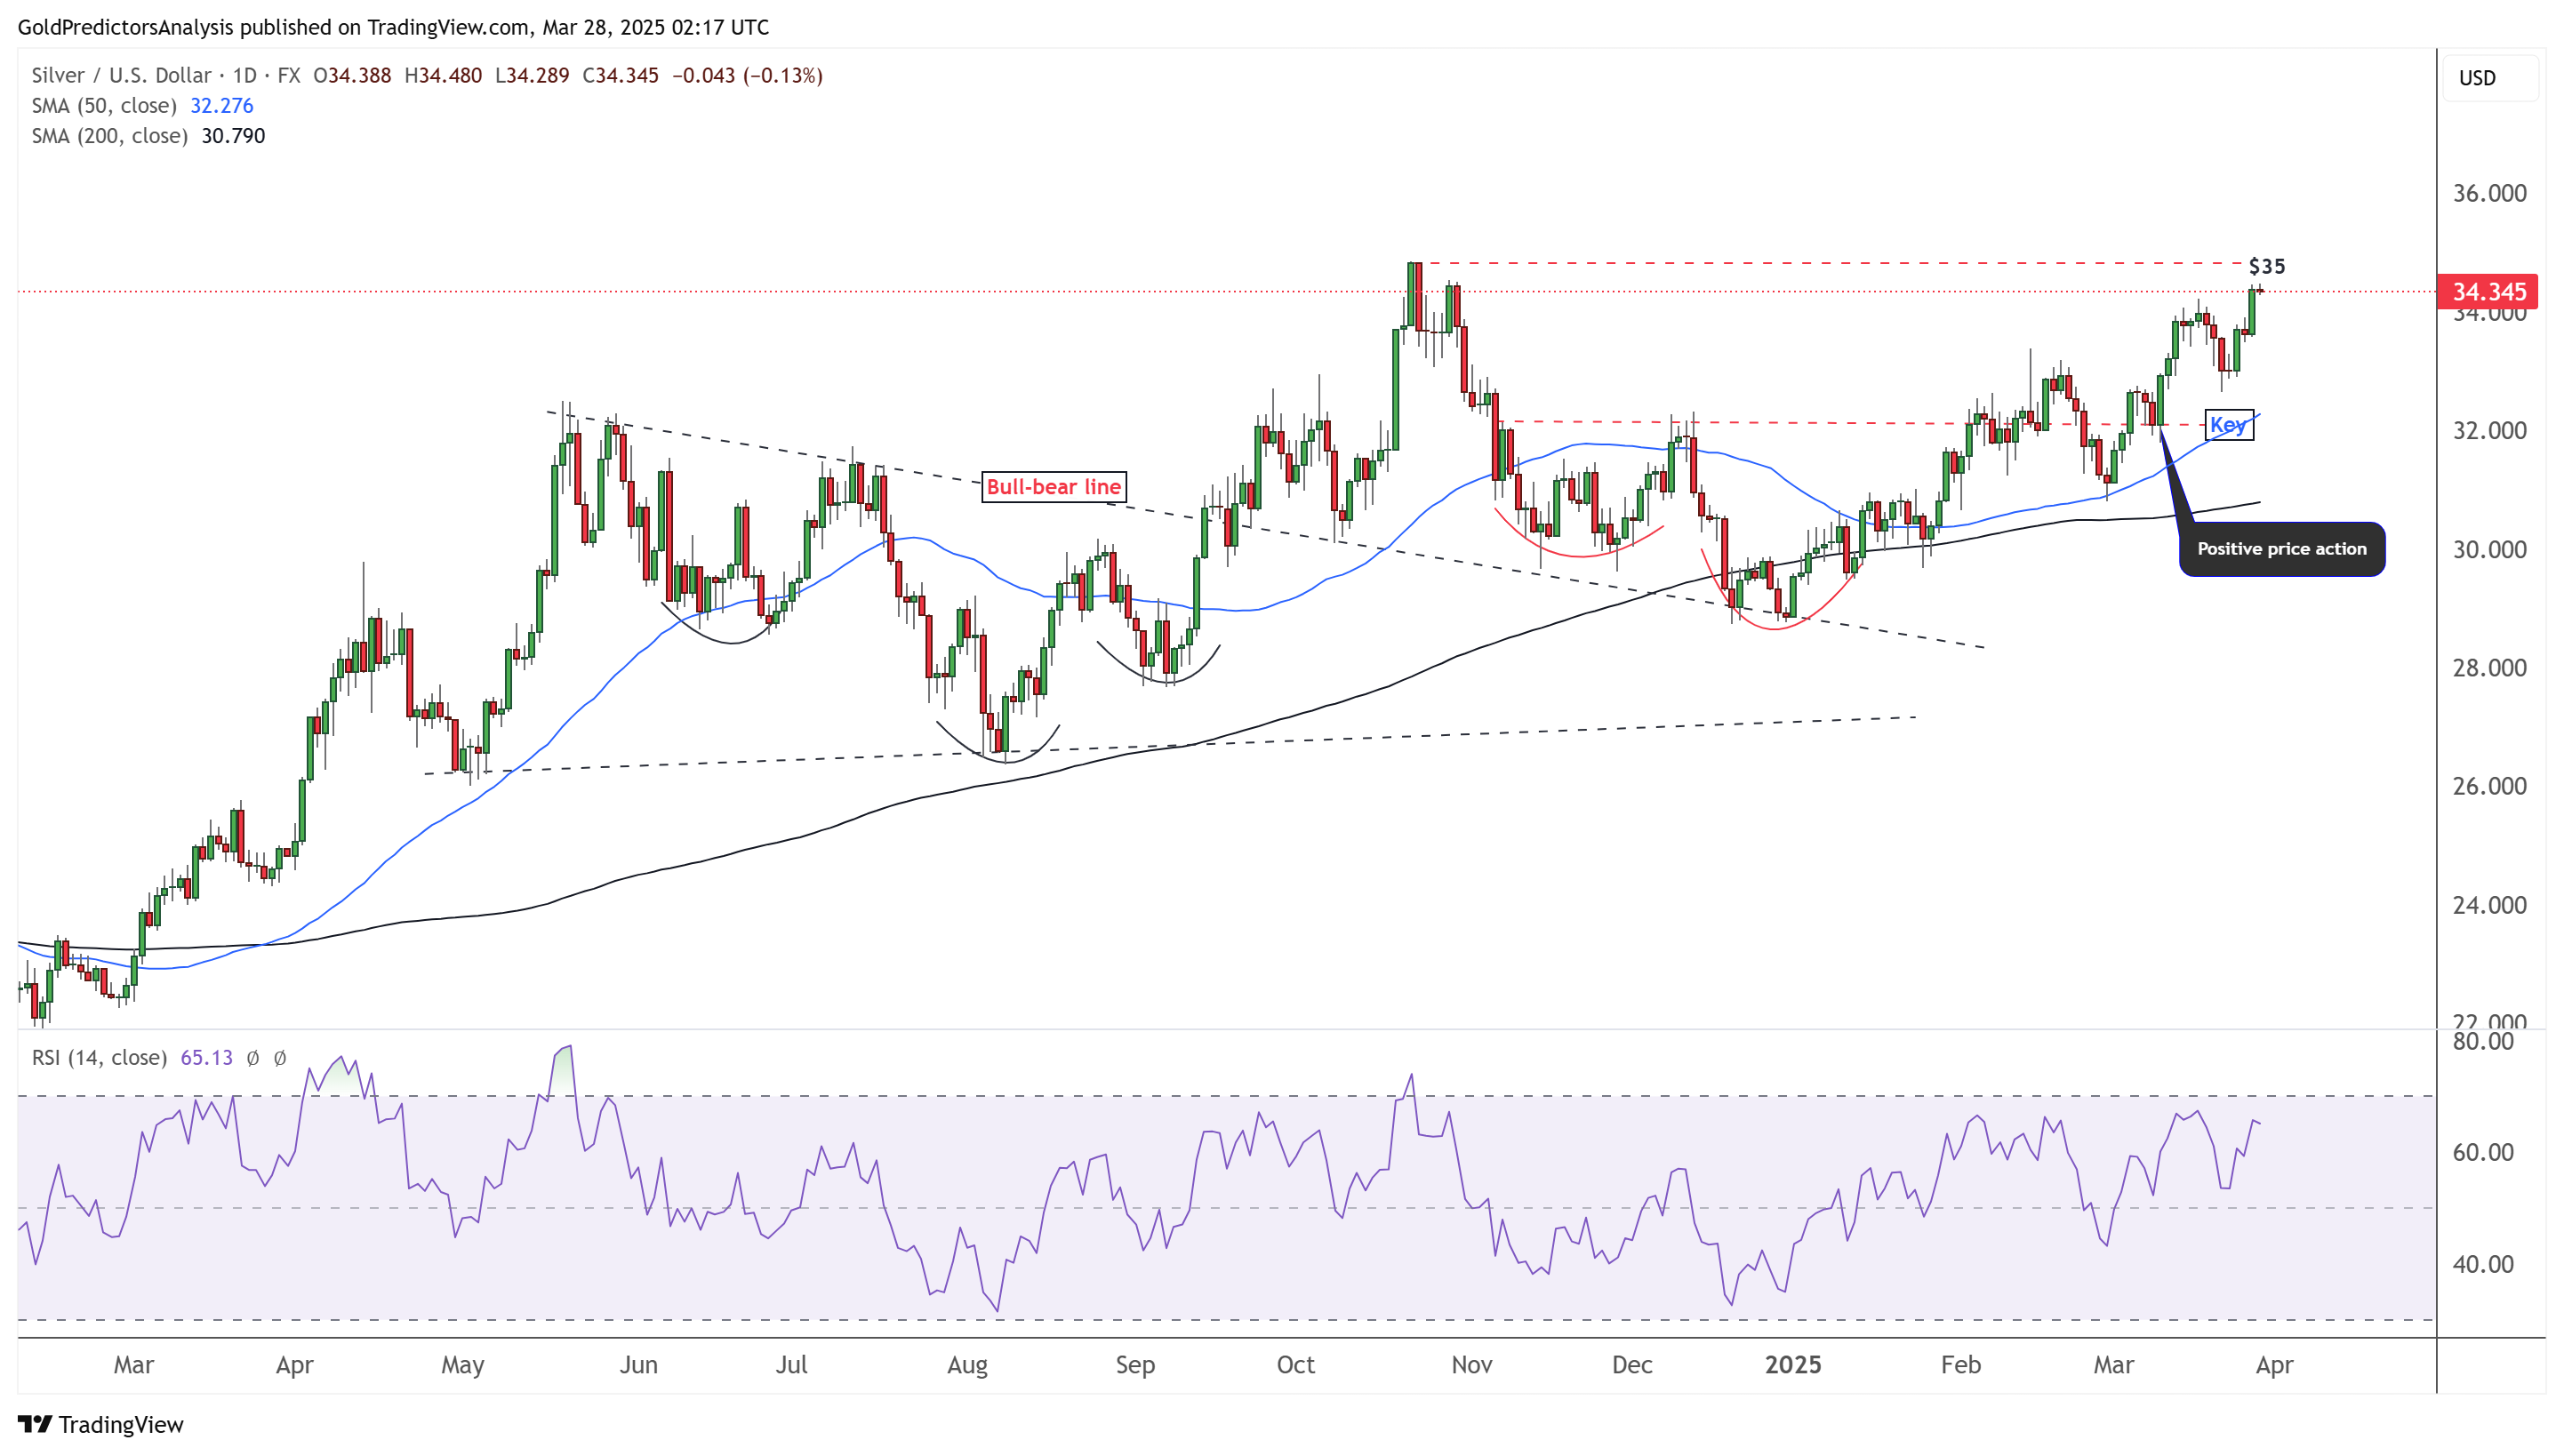
The daily chart for silver shows that the price is approaching the $35 target after forming a bullish price structure. Since this is the second touch of this resistance level after 2024, the likelihood of a breakout above $35 is higher. Despite nearing resistance, the RSI remains below 70, indicating room for further upside. Growing uncertainties in global financial markets suggest a sustained upward move in silver.
Silver 4-Hour Chart – Ascending Broadening Wedge
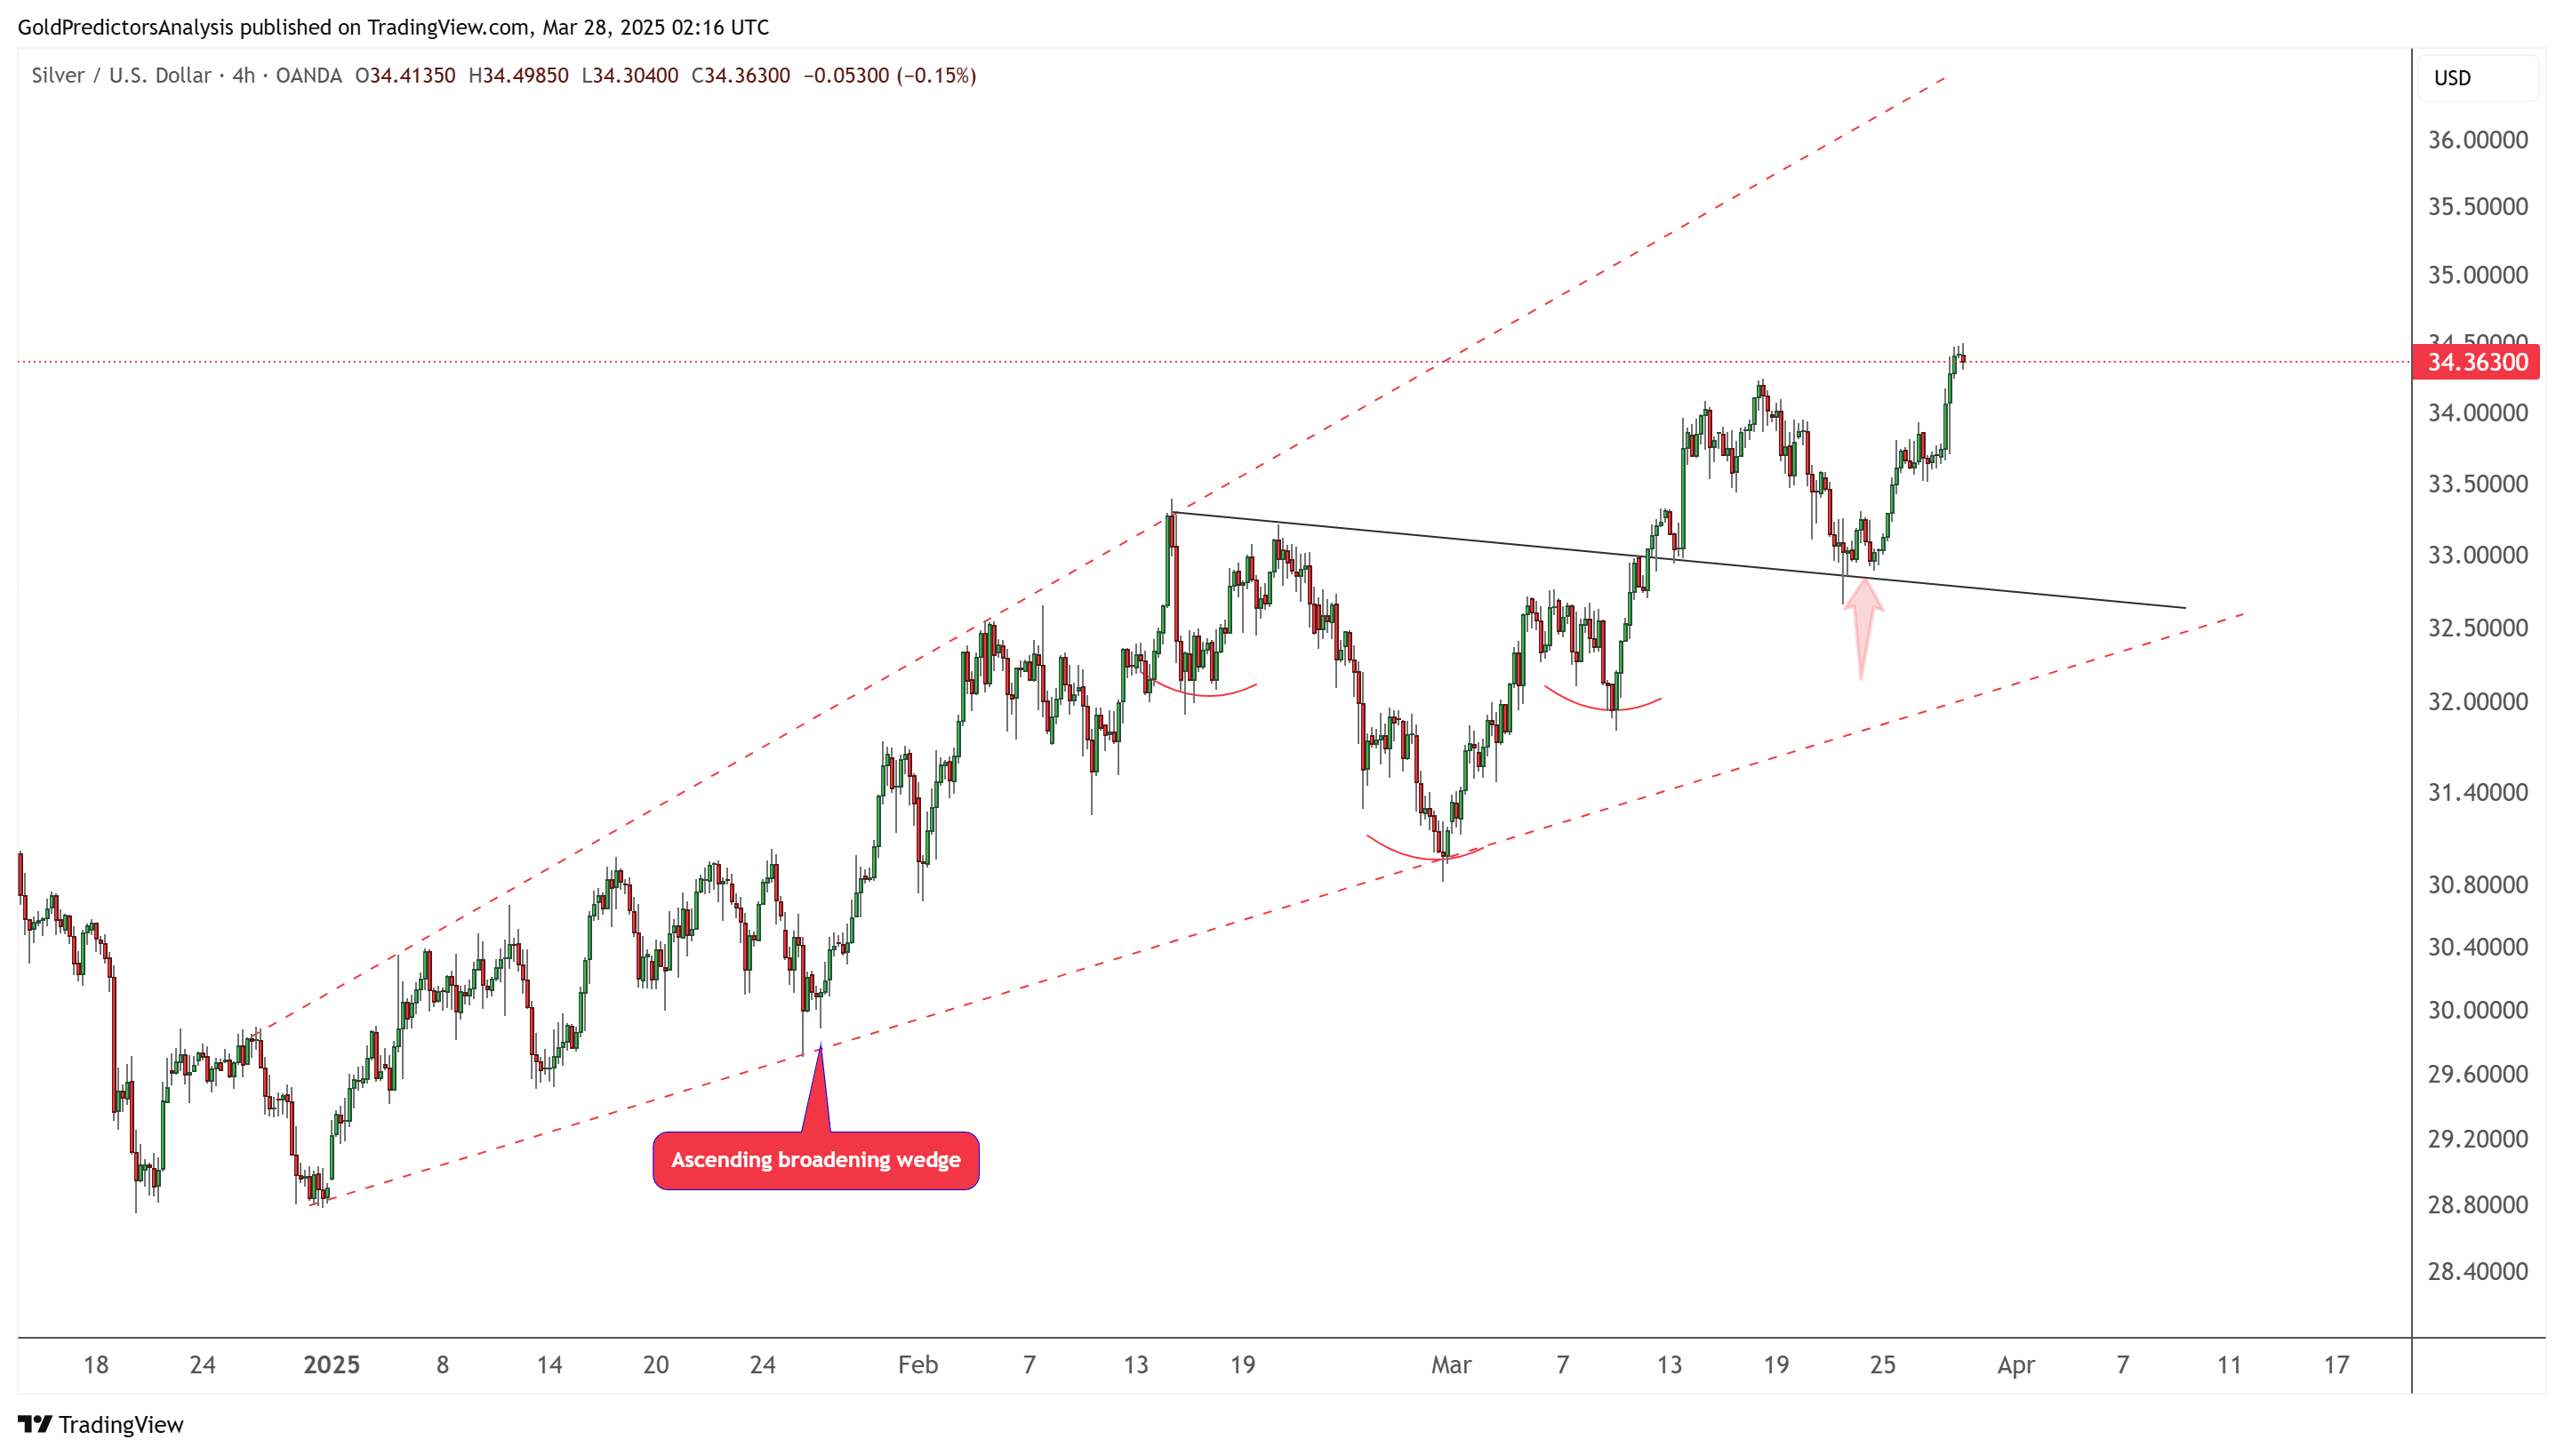
The 4-hour chart for silver shows that the price is moving within an ascending broadening wedge pattern and forming a bullish price action. The rebound from $33 at the black trendline, followed by a breakout above $34.20, indicates a sustained bullish trend toward $35.
US Dollar (DXY) Technical Analysis
US Dollar Daily – Bearish Pressure
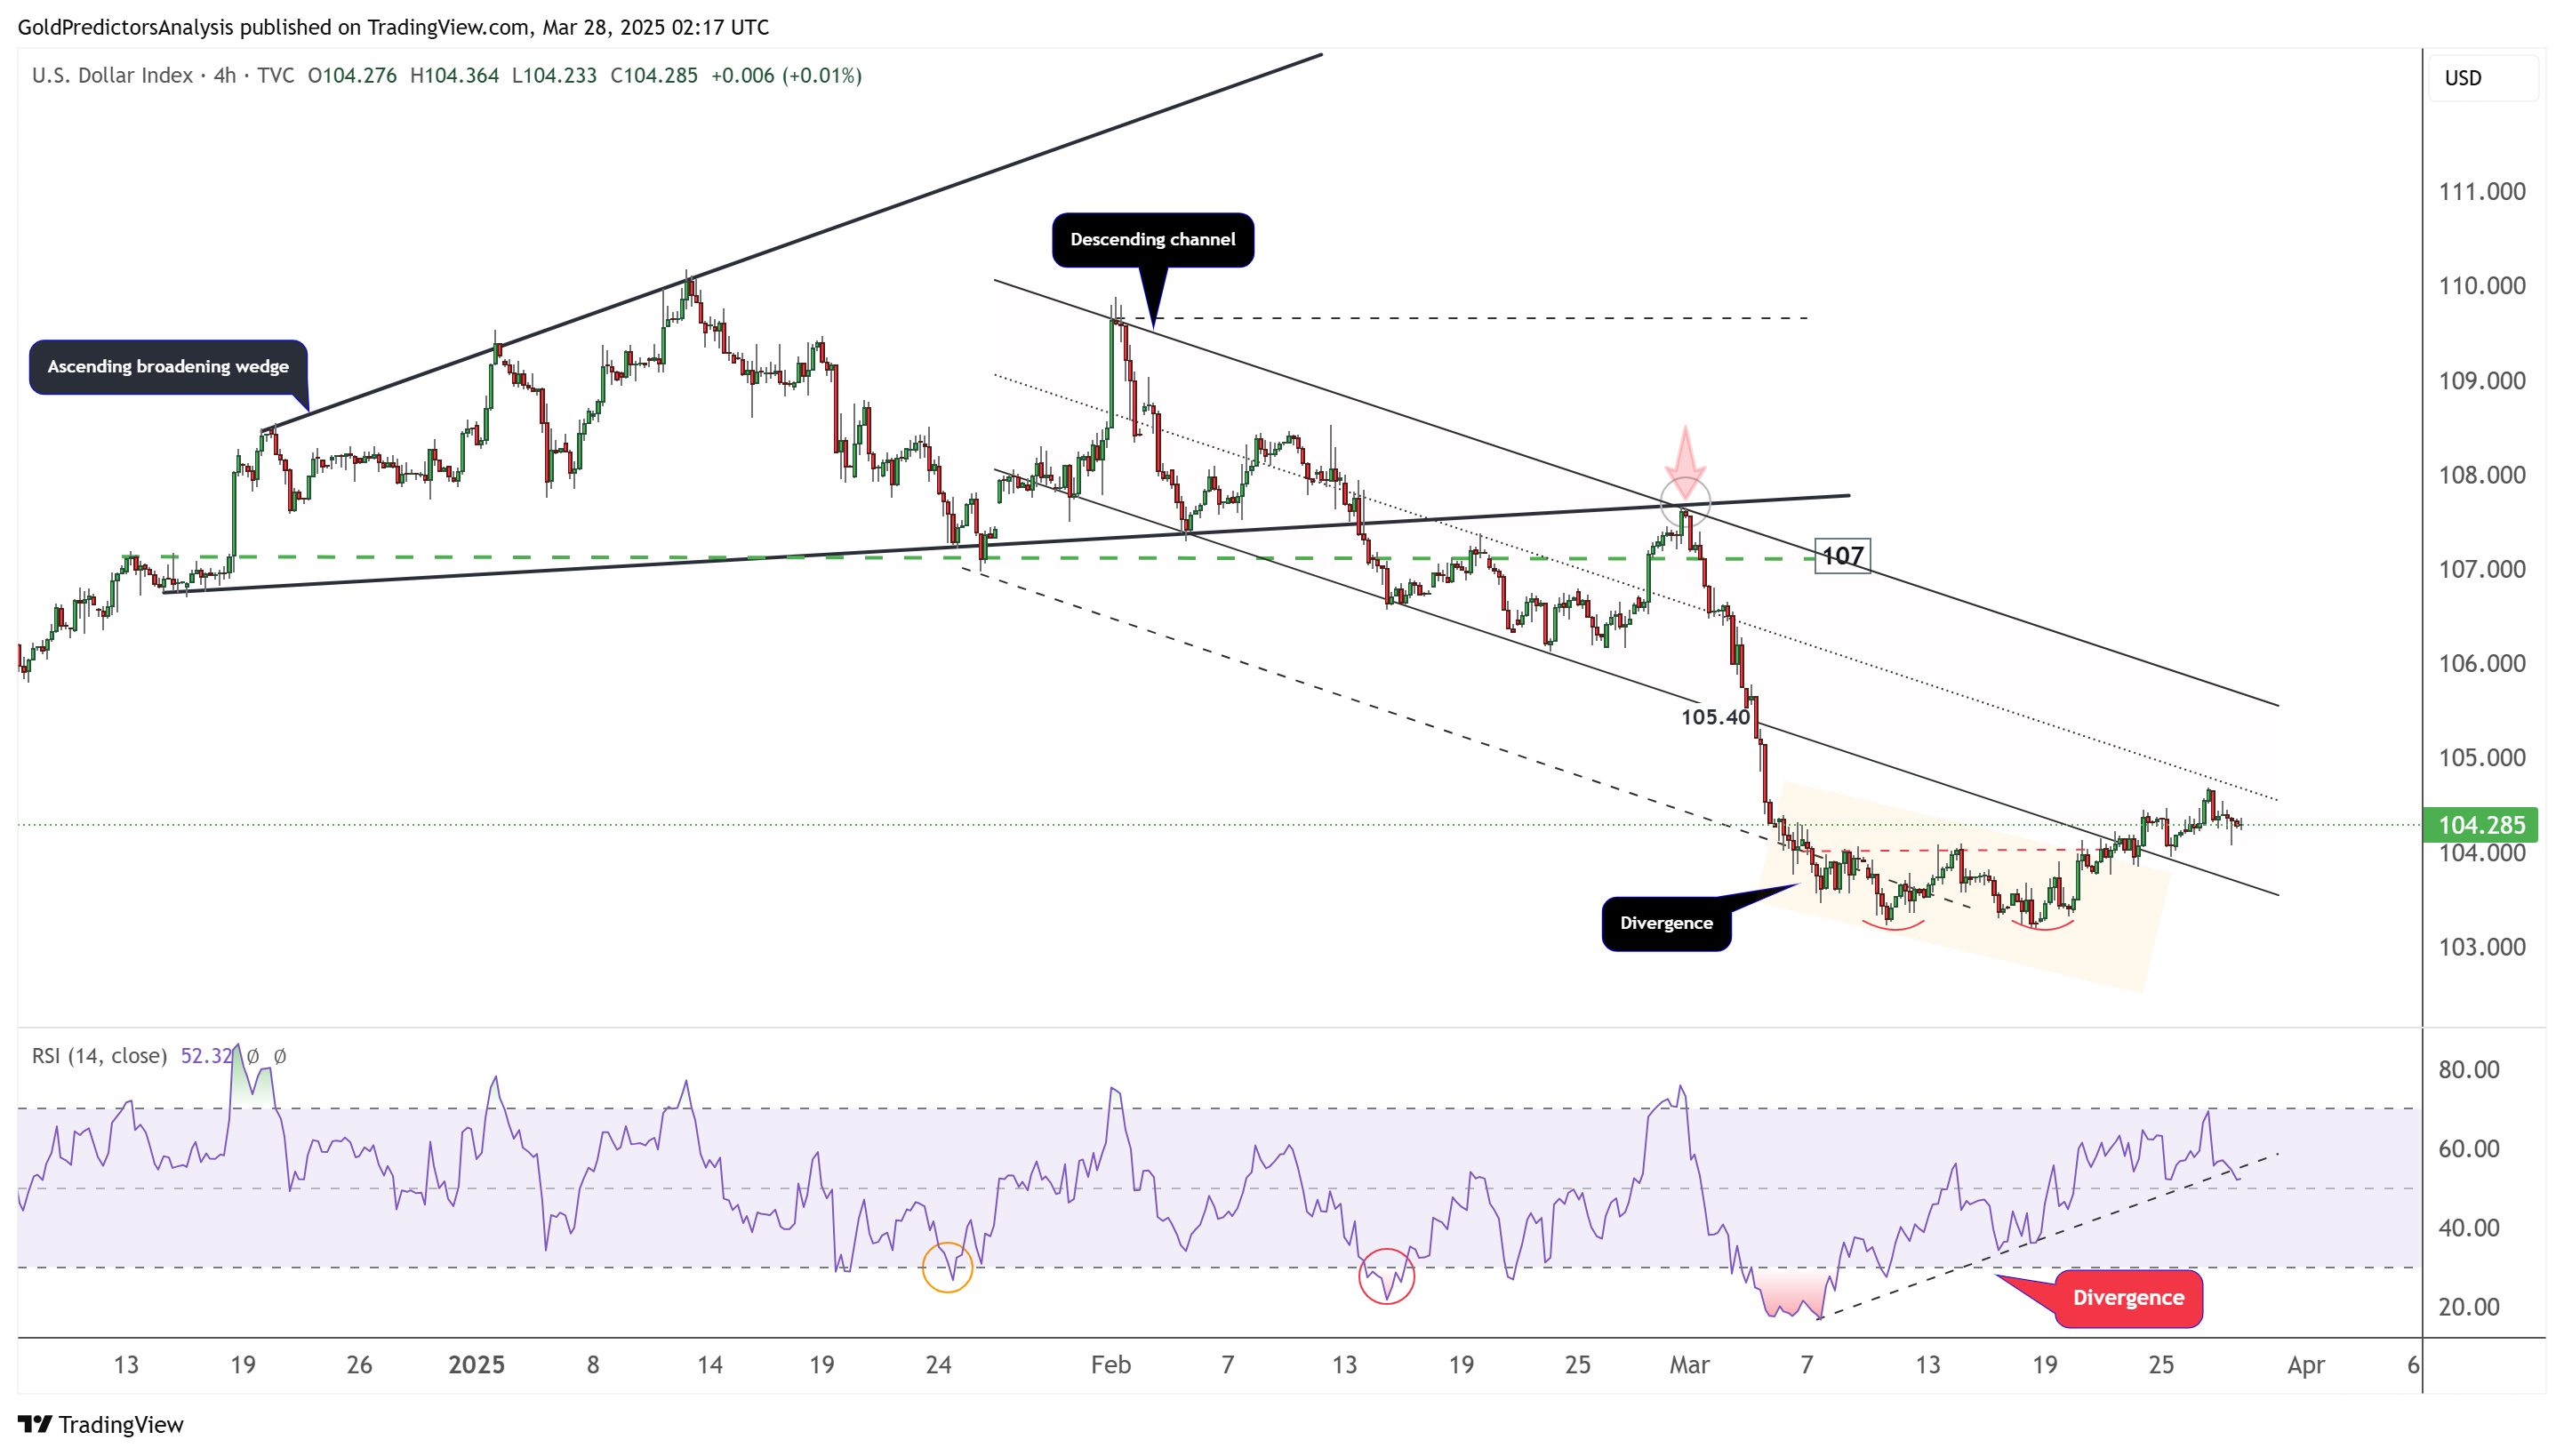
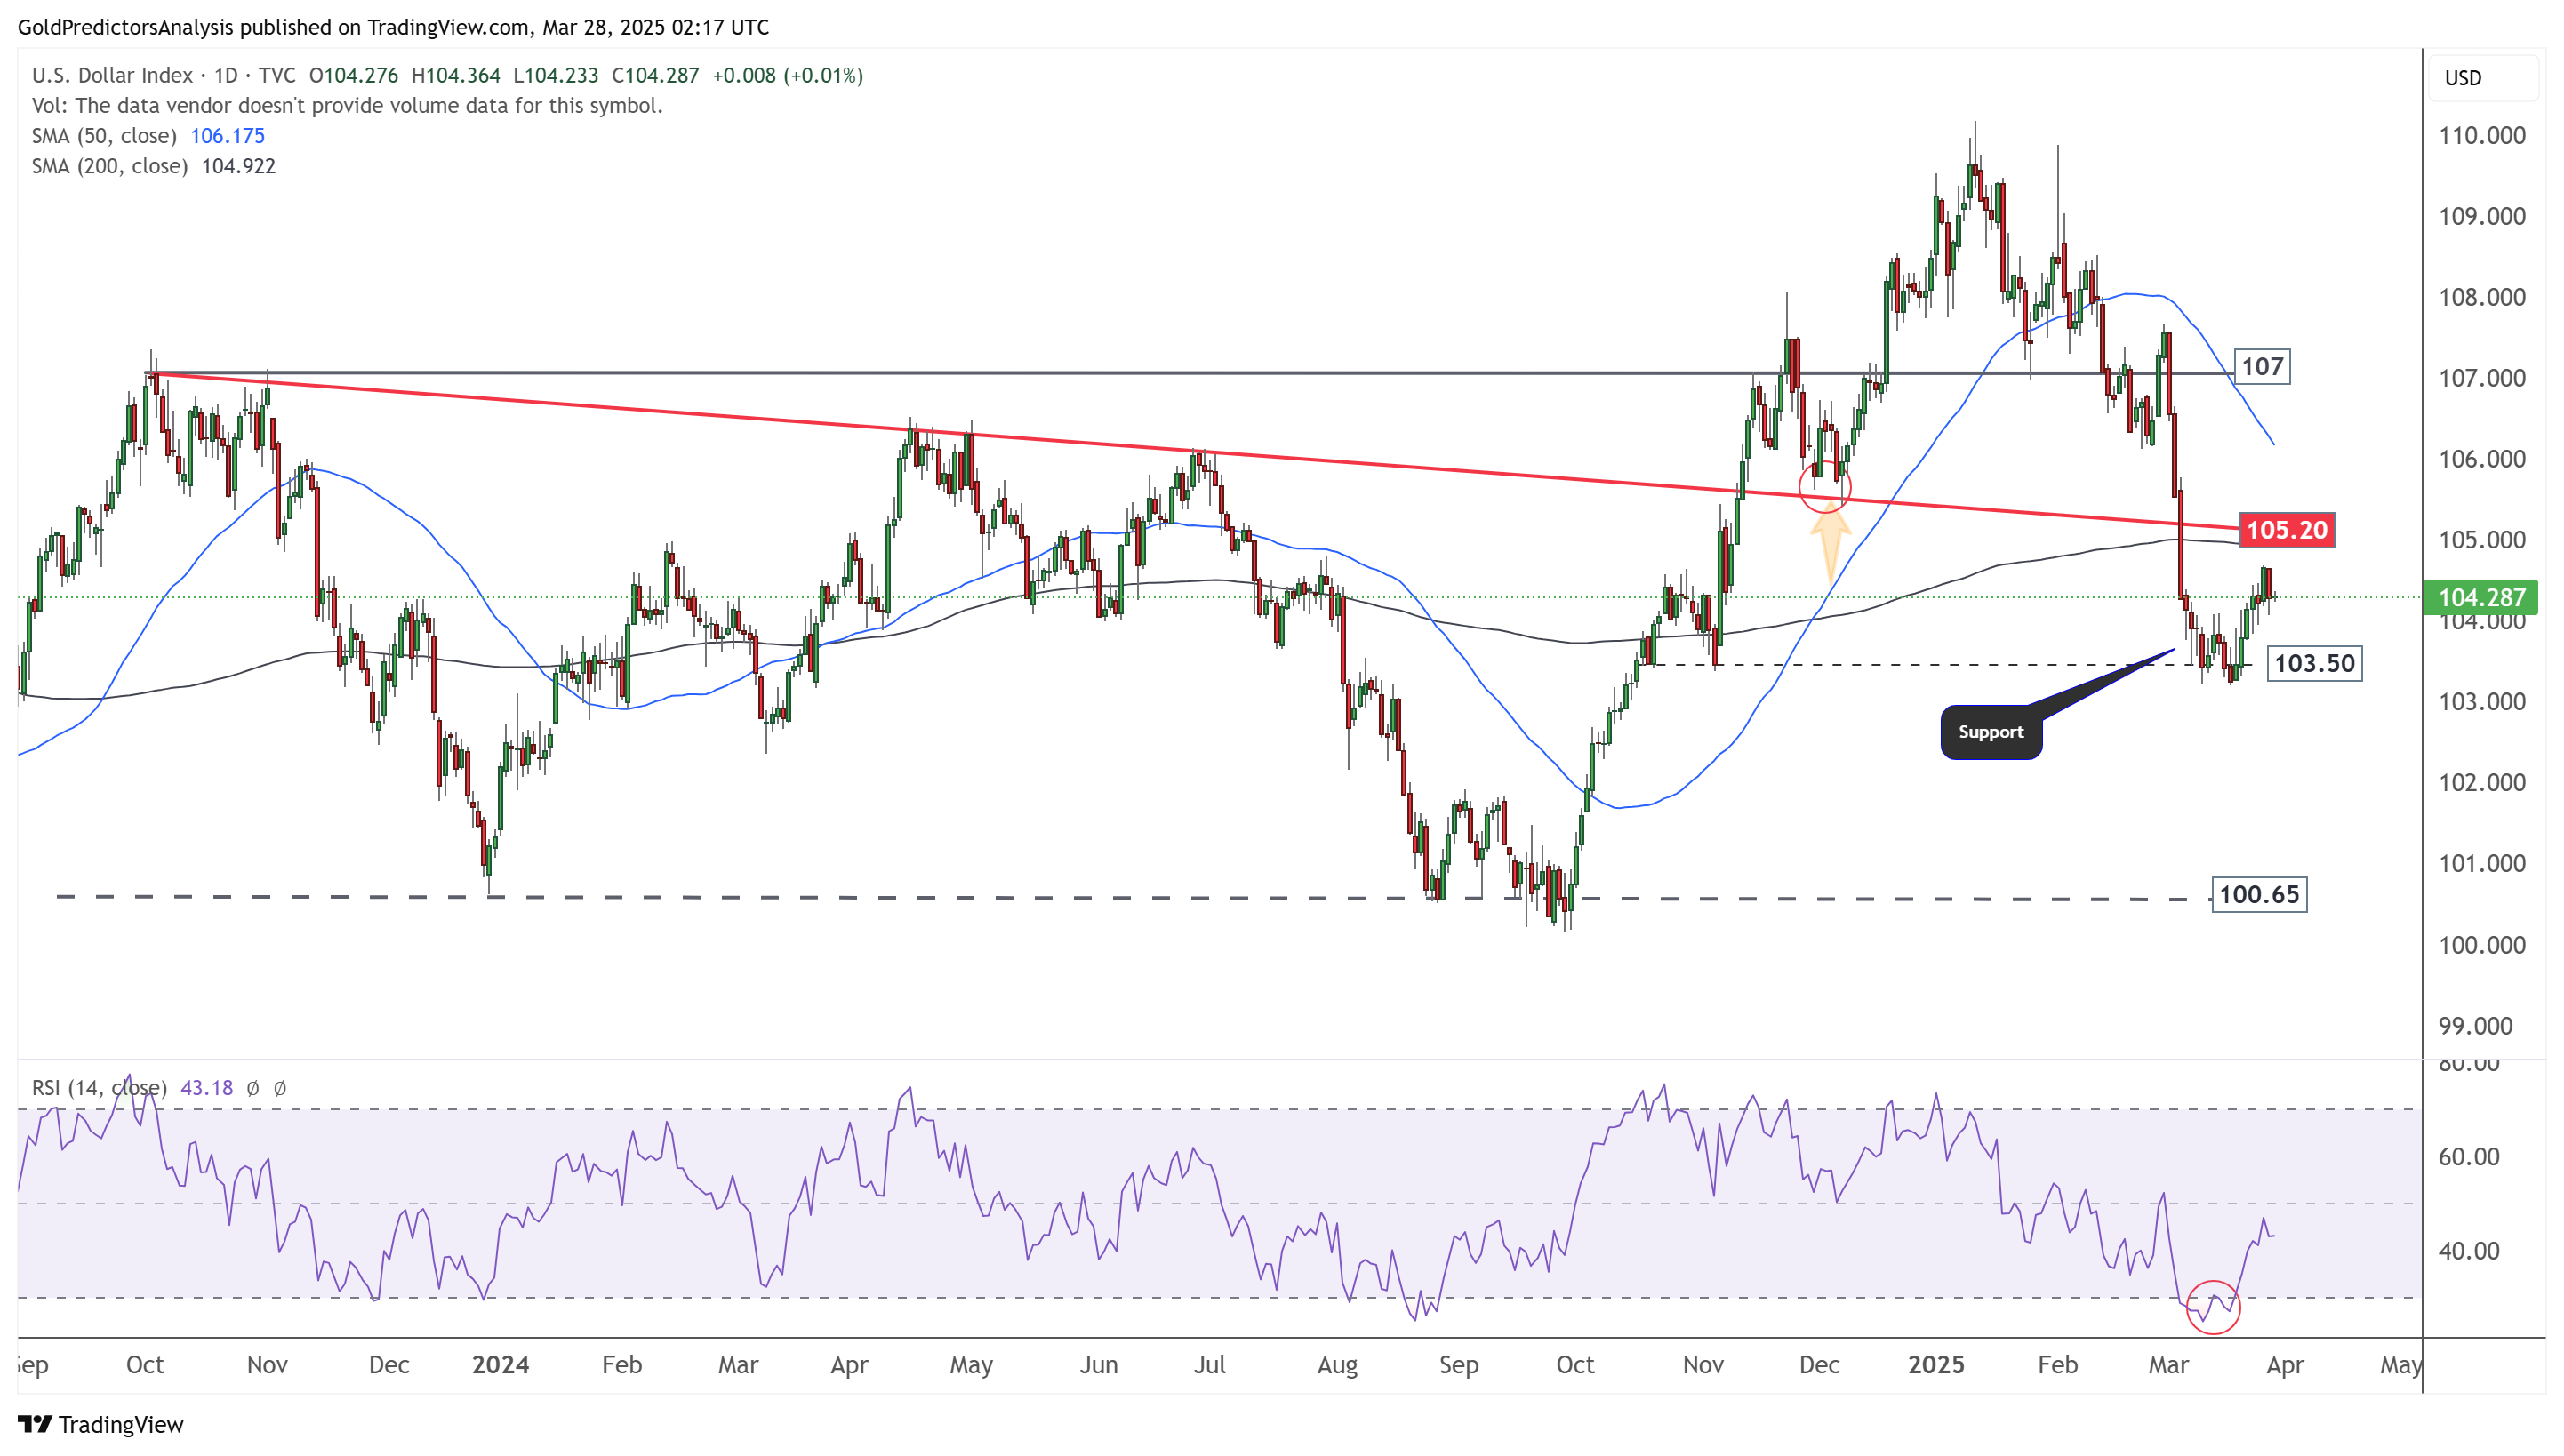
The daily chart for the US Dollar Index shows that the index rebounded from the 103.50 level but remains weak. It has approached the resistance at 105.20, but downward momentum will likely persist due to the ongoing economic crisis and bearish pressure. A break below 103.50 could push the US Dollar Index toward 100.65.
US Dollar 4-Hour Chart – Descending Channel
The 4-hour chart for the US Dollar Index shows a divergence from the support level at 103.50 but remains within the descending channel. This divergence has taken the index towards the target of 105.20. Bearish pressure persists despite the rebound from this level.