



The surge in oil prices last week has introduced selling pressure in gold (XAU) and silver (XAG) prices. Brent crude oil (BCO) reached near $118 last week due to fears of supply after the attacks in Saudi Arabia that kept the cost of energy elevated. However, Brent oil eased on Monday to about $115.80 during early Asian trading on Monday.
The expensive fuel can keep inflation high and increase expectations of high interest rates. The market expects the Fed to keep the interest rate unchanged in October but the expectation of rate hike in December is high.
The market is now watching for the US PCE inflation data on 29 October. I think that the correction in oil prices and soft inflation may give buyers strong reason to return. But the signals of further tightening could limit any recovery.
Gold Price Forecast: The Key Support at $3,950
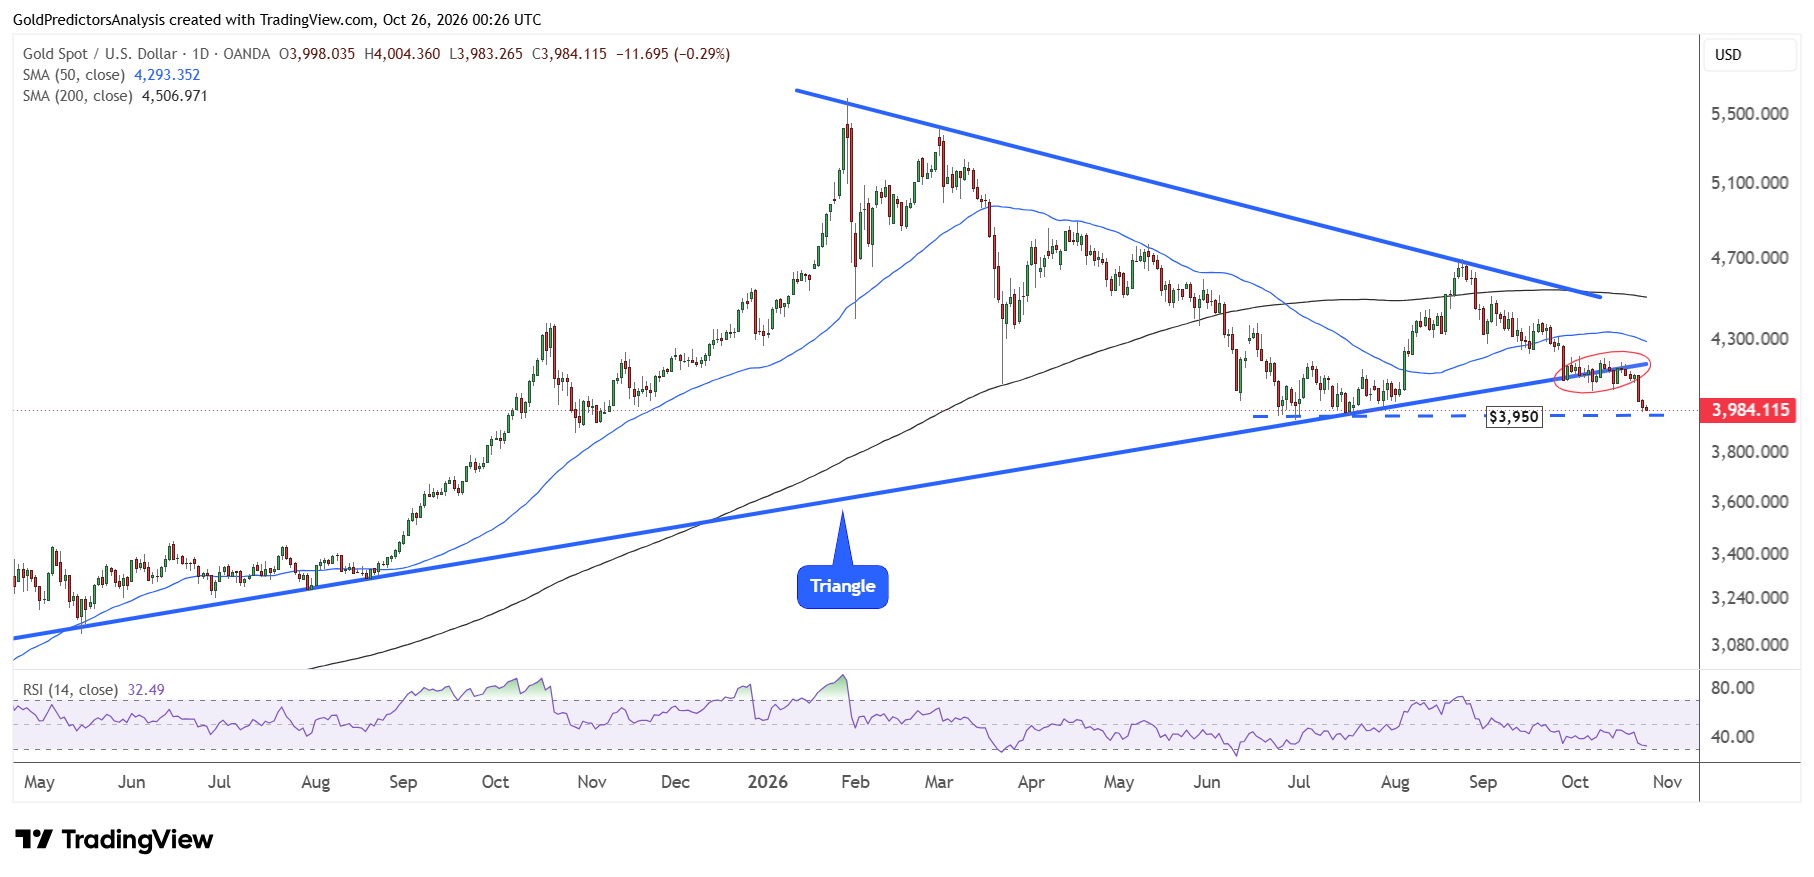
The daily chart for spot gold shows that the price broke triangle pattern at $4,100 and pushed the price towards the $4,000 area. The immediate support now remains at the $3,950 level as seen by the blue dotted support line. A break below $3,950 will likely open the way for deeper correction to the $3,800 level.
The RSI is now approaching the oversold region which may provide a possible reversal. But the 50-day and 200-day SMAs suggest negative trend. The price must break above the $4,500 area to indicate strength in the gold market.
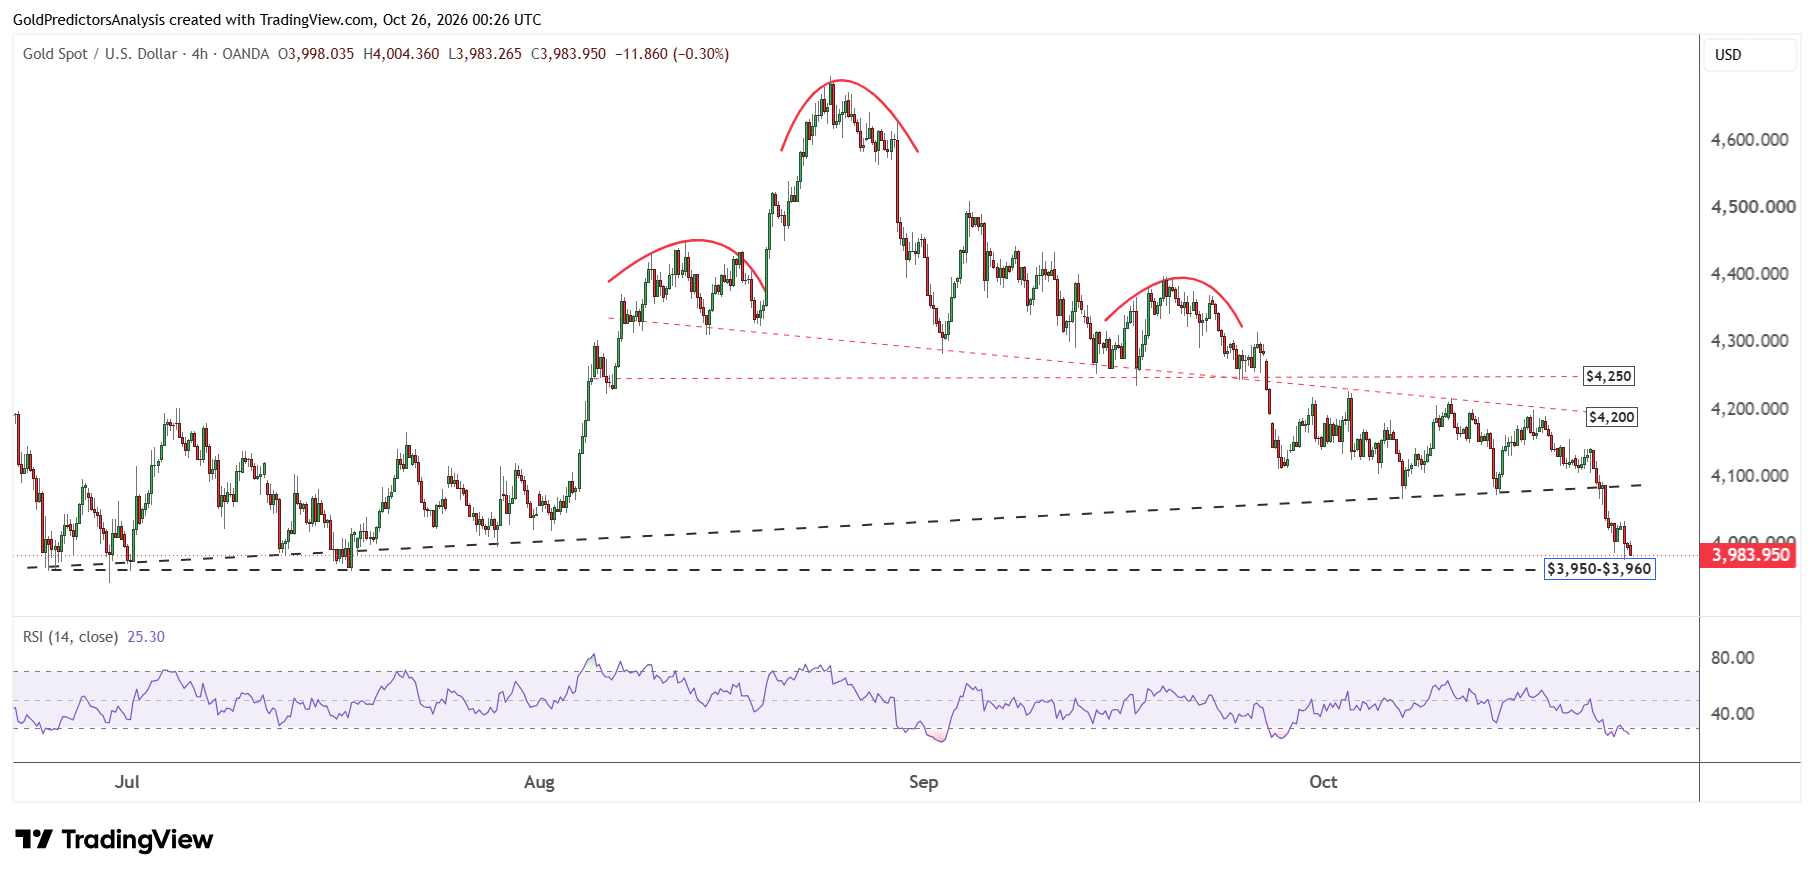
The 4-hour chart for spot gold also shows that the price is now consolidating above the $3,950 support level. The immediate resistance in gold price is $4070. A break above $4070 may push the price to the $4,250 level.
Overall, the 4-hour chart shows negative price action. The price remains in the negative trend as long as it remains below $4,250.
Gold Price Forecast
Every new Gold analysis as it publishes, today's technical signal and key levels, live price — on one page.
See all Gold forecastsSilver Price Forecast: $50 in Focus After the Break Below $55
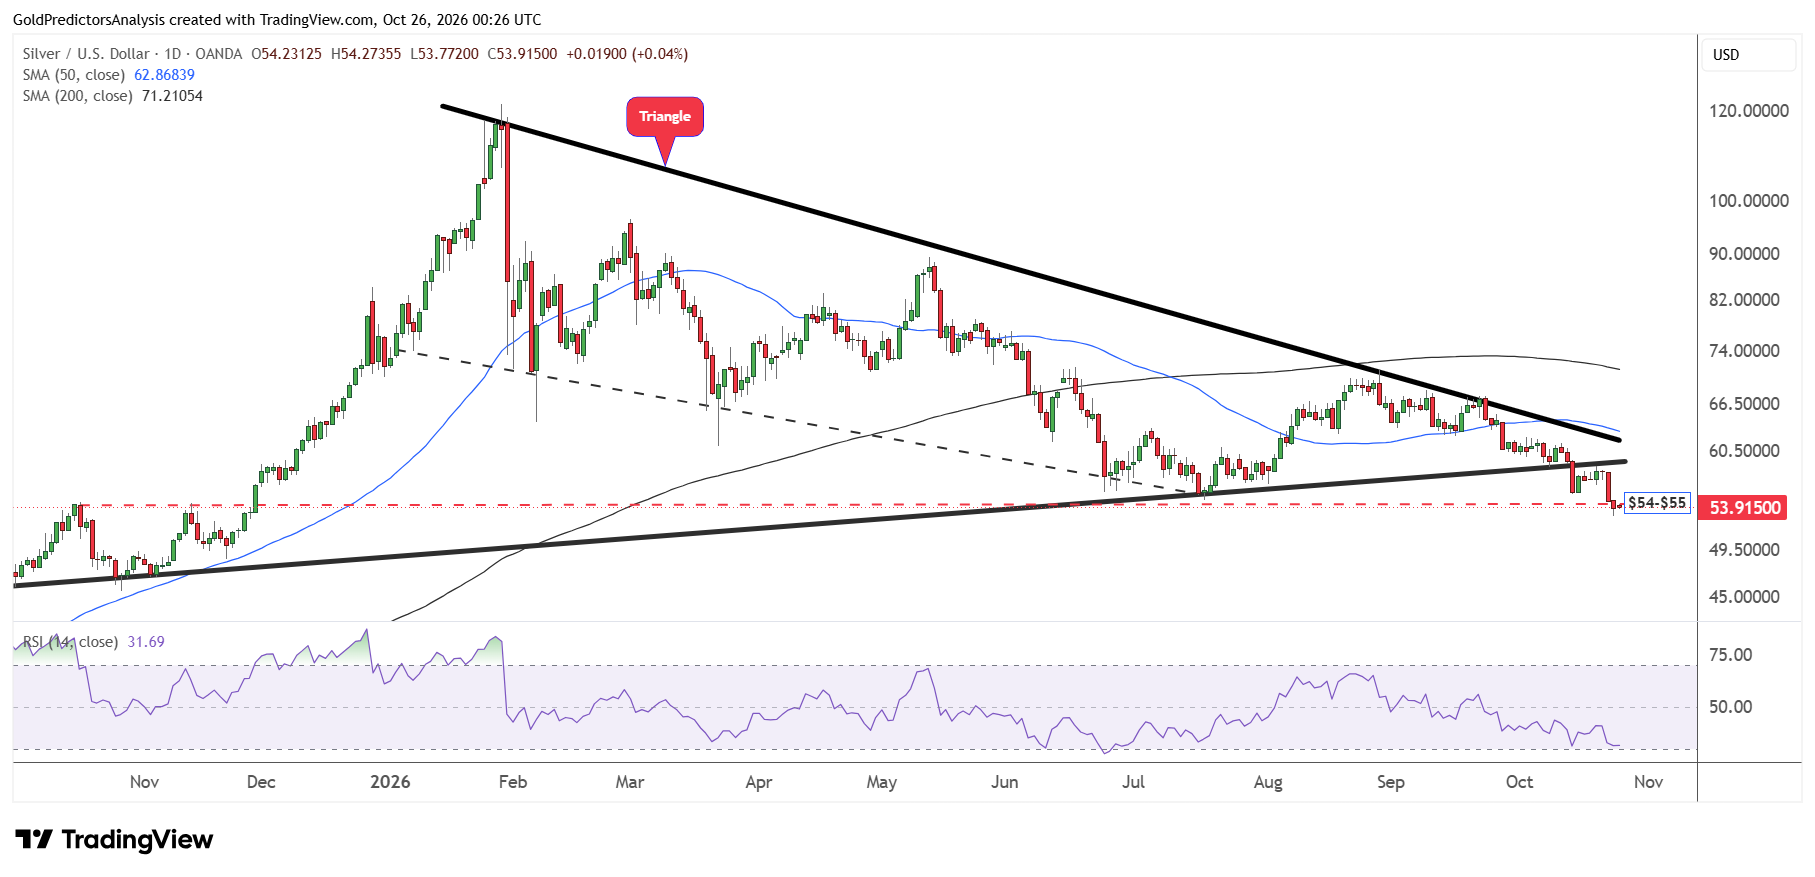
The daily chart for spot silver shows that the price closed below the $55 support level last week. This support is defined by red dotted trend line that stretches from the October 2025 highs.
Silver has also broken the triangle pattern at $58 which suggests a negative trend in the short term. The next important support in the silver market is $49-$50. If the price continues to drop towards this support, it will likely offer strong rebound.
The RSI is also approaching the oversold region. Therefore, if the price drops to $50 and then recovers above $55, it will likely offer a strong rally towards the $60 area.
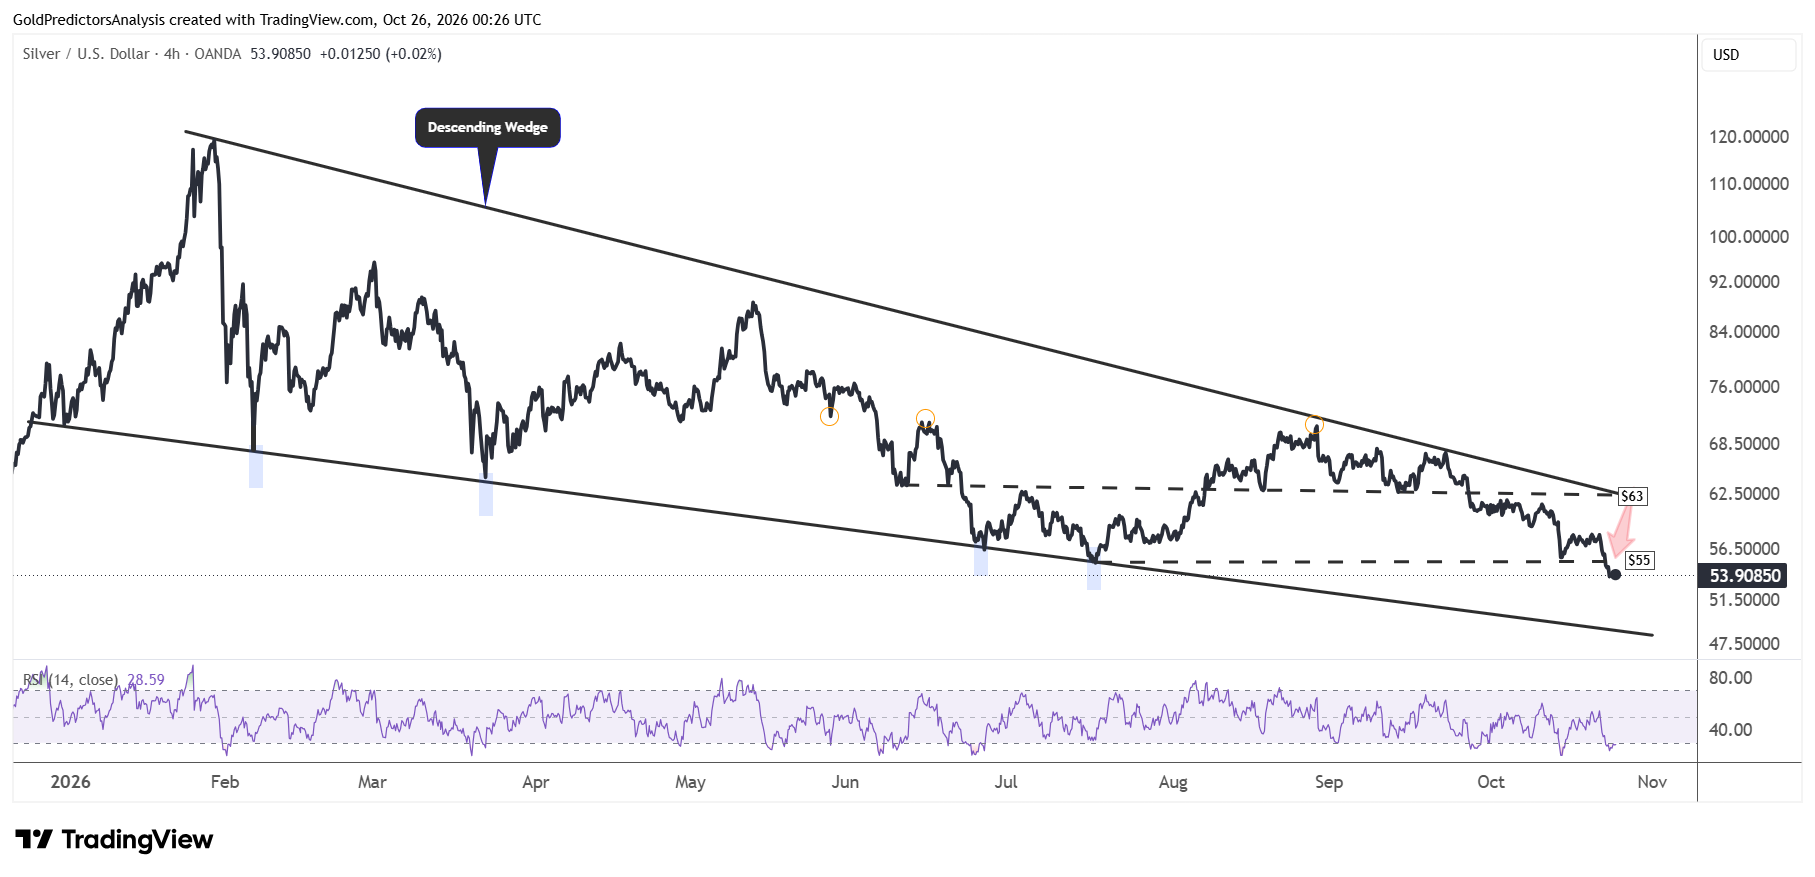
The 4-hour chart for spot silver shows that the price broke the $55 area and continues to trade in a bearish trend on Monday. The significant support in silver now remains at lower boundary of the descending wedge pattern near the $49-$50 area.
The price needs to recover above the $63 region to break the descending wedge and open further upside towards $72.
What to Watch Next
The surge in oil prices has pushed the gold and silver prices near the key support zones due to the expectations of higher interest rates. The market is now watching for the Fed decision on 28 October and PCE inflation data on 29 October for next signals. I think that the correction in oil prices and soft inflation may provide some support to gold and silver prices.
The gold price must hold the key $3,950 support level to avoid deeper correction to $3,800. Meanwhile, the silver price must hold the $49-$50 level. A break above $4,070 may push the gold price to $4,250. Silver requires a break above $60 to ease the bearish pressure.
Read more: $50 Silver in View as Oil Fuels Fed Rate Hike Fears