


Gold (XAUUSD) lost 8.92% last week, triggered a strong drop and closed the week at $3,538. The expectations for Fed rate hikes continue to support the US dollar and keep gold prices under pressure. Gold prices also faced similar conditions in 2022 after the Russia-Ukraine war when gold prices dropped nearly 22% due to higher interest rates.
Why Gold Fell in 2022 Before Recovering in 2023
Inflation and Rate Hikes Drove Gold’s 2022 Decline
The inflation was strong before the Russian invasion of Ukraine. The Russia-Ukraine war added fuel to inflation by adding another shock to the energy market and increasing concerns about supplies. WTI crude prices rose from $76 a barrel in January 2022 to above $122 in March 2022.
The high oil prices increased fuel and transport costs and reduced household spending. The high inflation environment in 2022 pushed the Fed to increase the interest rates.
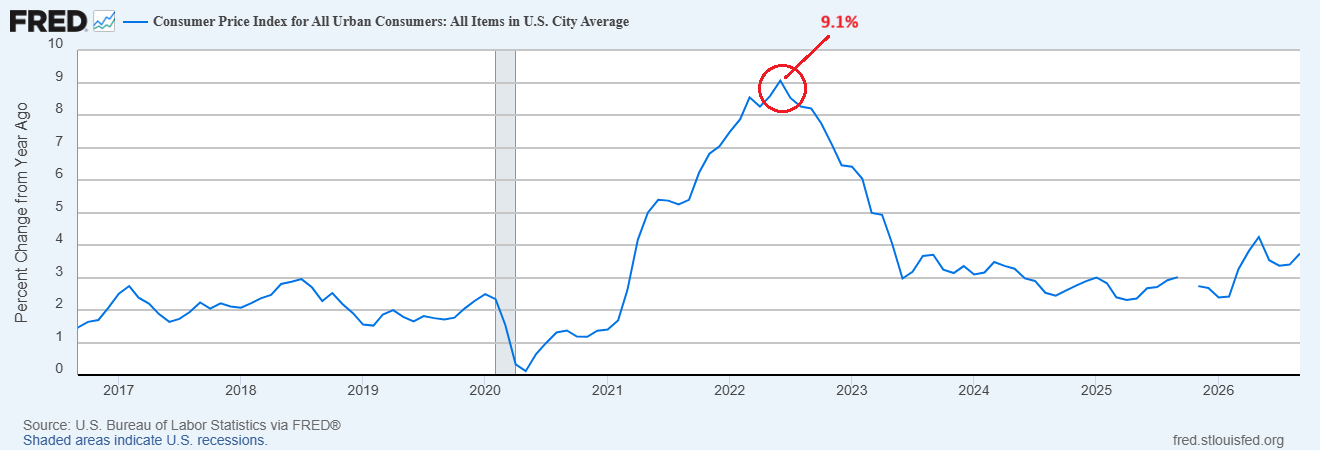
The chart below shows that the consumer inflation increased to 9.1% in June 2022 as energy prices increased by 41.6% from the previous year. Core PCE also surged above 5% in early 2022 which suggested that price pressure extended beyond energy.
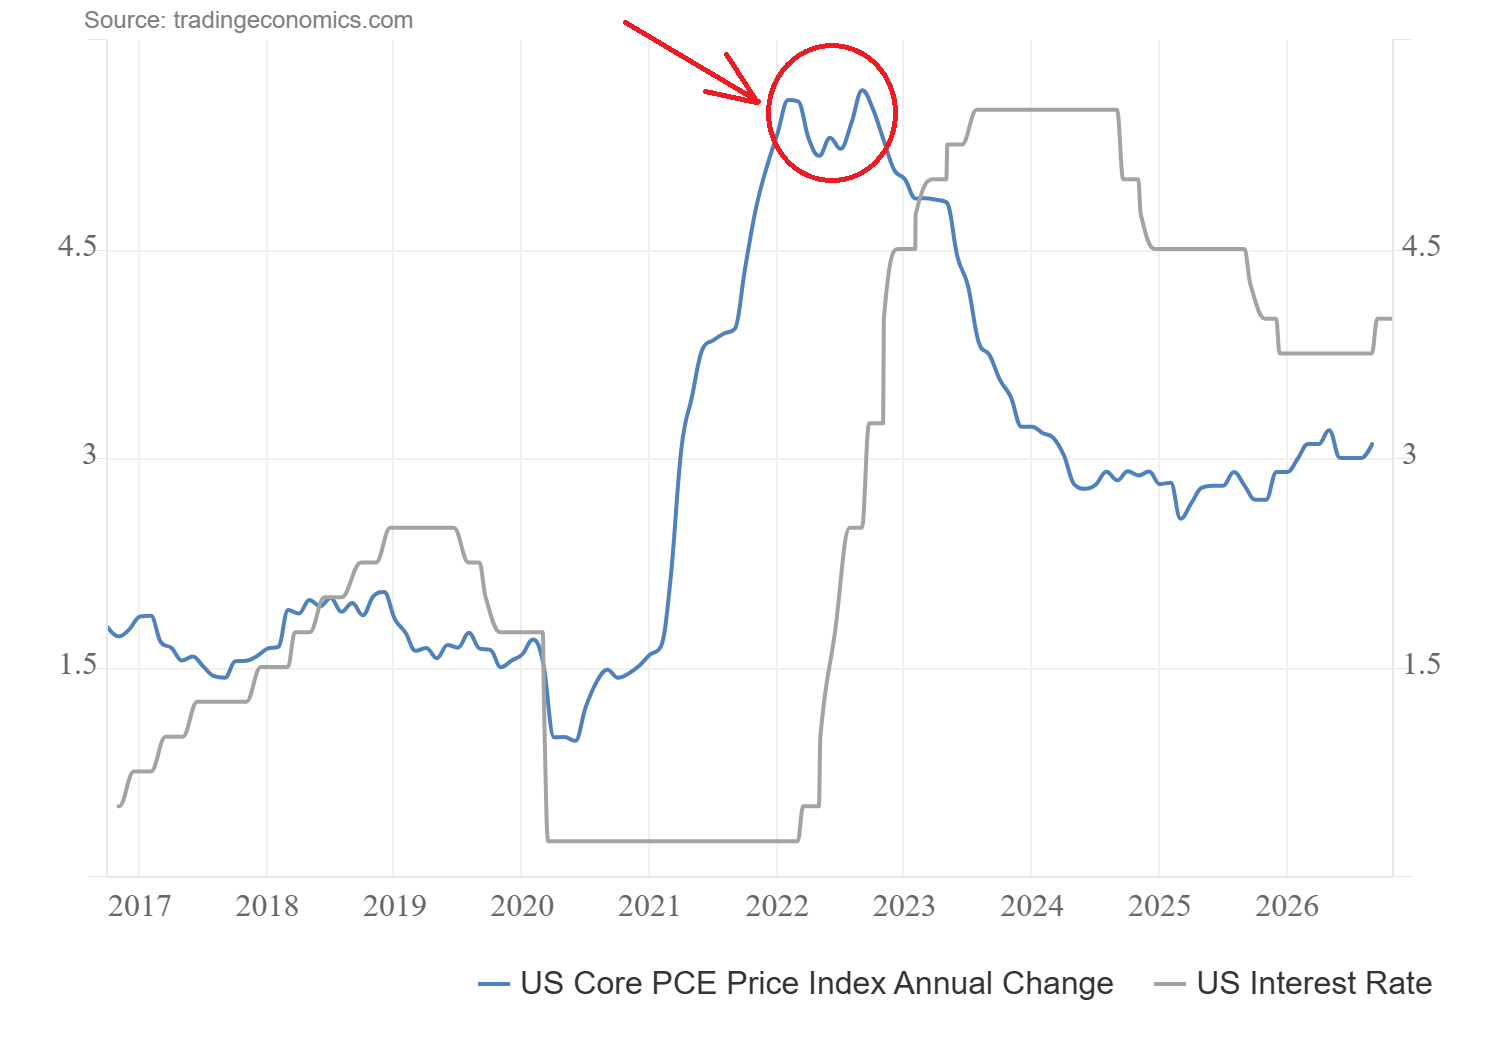
The surge in inflation in 2022 encouraged the central bank to raise rates. The chart below shows that the Fed started to act in March 2022 when the PCE inflation was above 5%. The Fed increased the interest rates from 0.25% in February 2022 to 5.5% in July 2023.
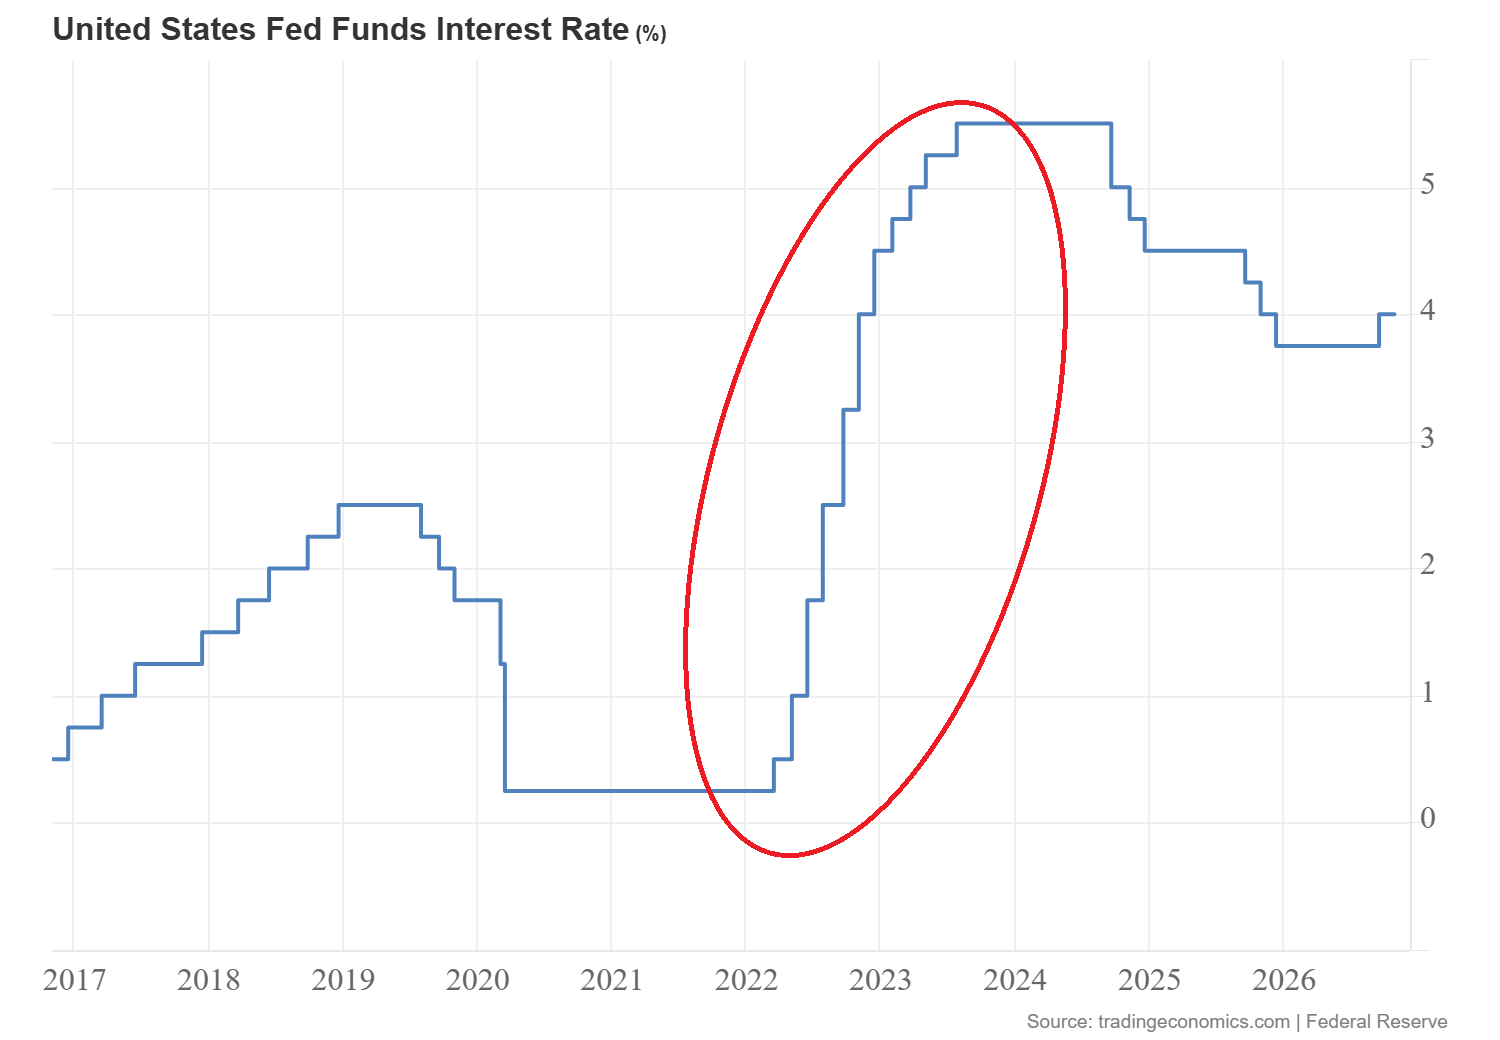
The Fed started to increase the interest rate in March 2022 from the target range of 0%-0.25%. The target range reached 4.25%-4.50 by December. It further increased to 5.25%-5.50% in July 2023. The chart below shows the scale of tightening by the Fed.
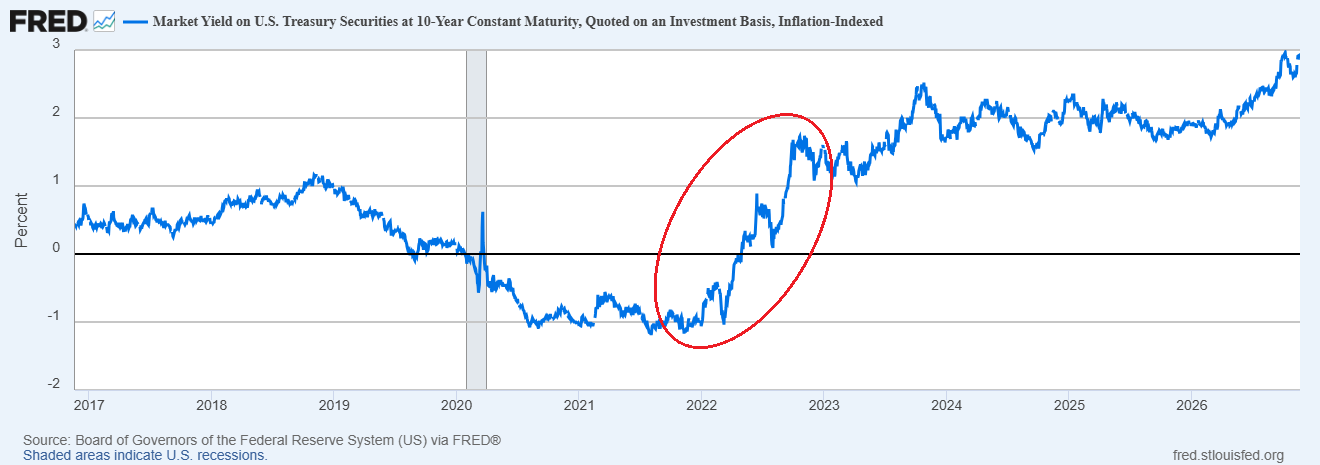
The 10-year inflation indexed Treasury yield increased from minus 0.97% in January 2022 to positive 1.58% in December 2022.
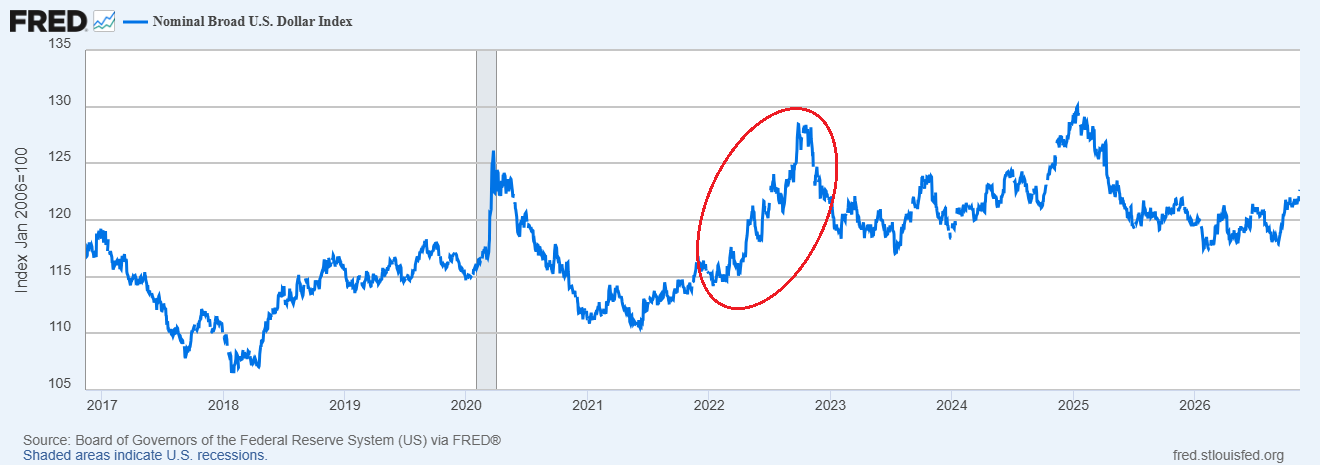
The strength in US dollar further added pressure. The broad dollar index increased from nearly 115 at the start of the year to 121 at the end of the year and gained over 5%. The strong US dollar increased pressure on gold prices in 2022.
Gold Price Forecast
Every new Gold analysis as it publishes, today's technical signal and key levels, live price — on one page.
See all Gold forecastsGold Recovered in 2023 Despite Further Rate Hikes
Gold prices initially benefited from the demand for protection and marked high in March 2022. But the price declined nearly 22% from the highs of March and dropped towards $1,615 by September 2022. This suggests that the initial wave of war triggered selling pressure in gold prices due to the high interest rates.
The next year in gold was different. The Fed was still raising rates but gold prices surged higher in 2023. This means that gold prices do not require rate cut to form a bottom.
The demand for gold also explains this situation. Central banks benefited from the lower prices in 2022. As per the World Gold Council, the central banks purchased 1,037 tonnes in 2023 while the global ETFs lost 244 tonnes.
Why Gold Prices Are Falling in 2026
Rate Hike Expectations Keep Gold Under Pressure
The current environment shares some features with 2022. The US-Iran war in 2026 has triggered energy disruptions, persistent inflation and strong US dollar. These conditions have triggered a strong drop in gold prices after marking the record high of $5,600 in January 2026.
The Fed Governor Lisa Cook mentioned that the renewed inflation pressure comes from the crisis in the Middle East, the impact of tariffs and investment in AI infrastructure. This is broad inflation problem rather than oil only.
The PCE inflation data for September shows that headline inflation increased to 3.6% while core inflation increased to 3.1%. Both measures remained above the 2% objective of the Fed. That keeps pressure on policymakers to bring inflation down.
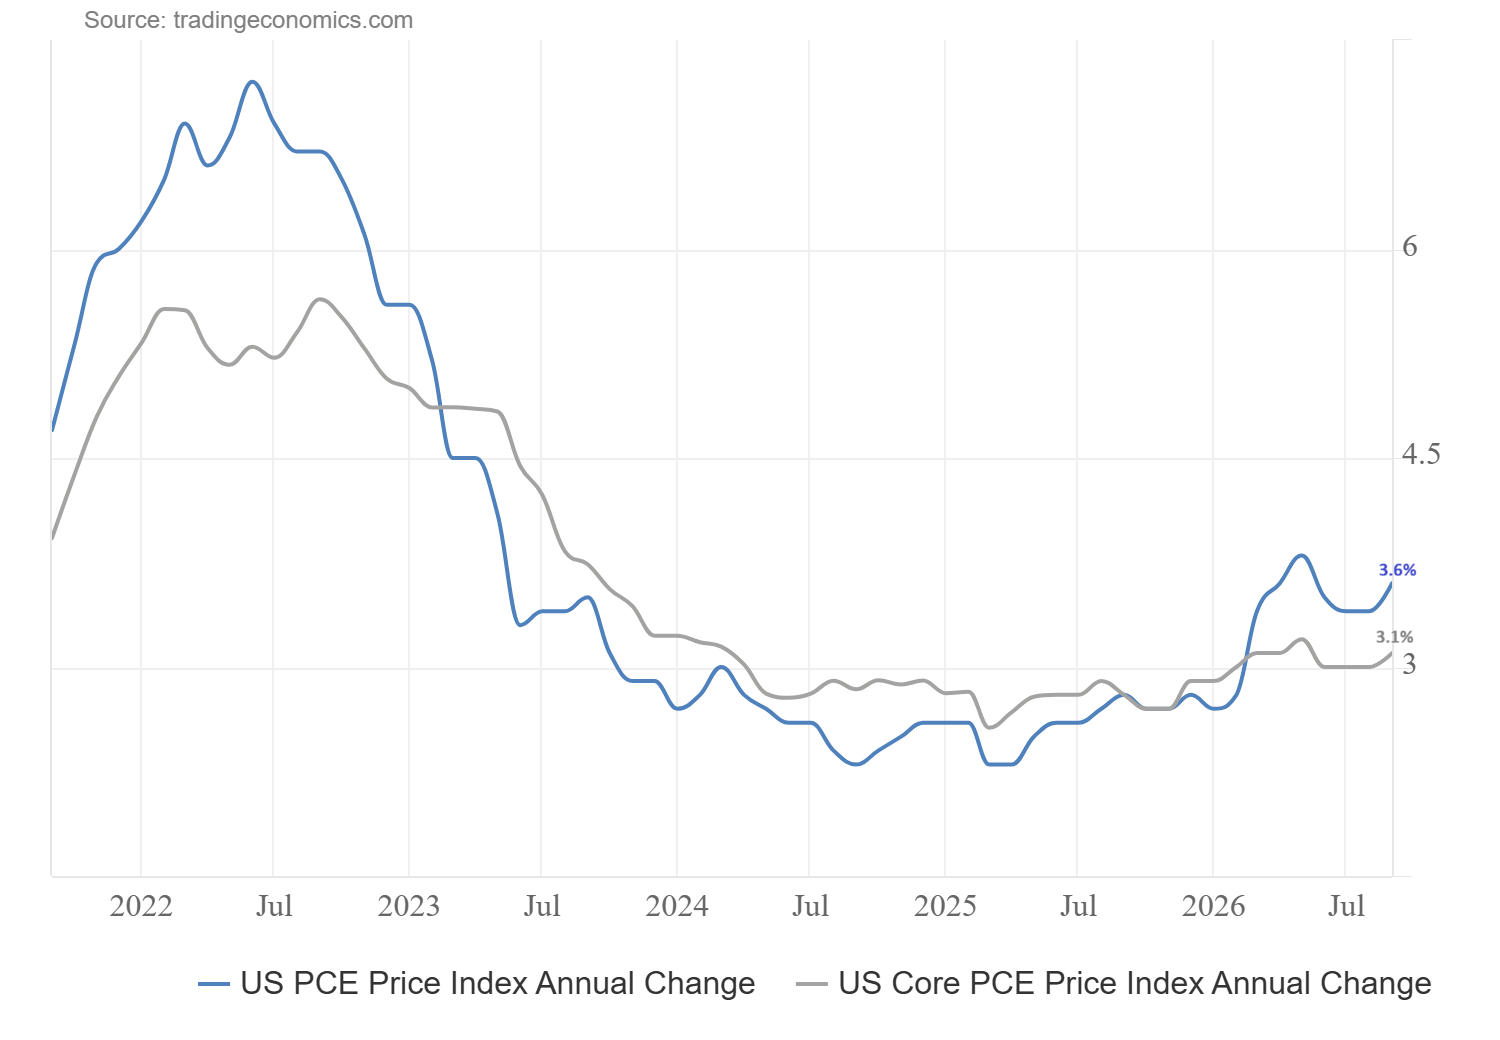
Cook also estimated the headline PCE inflation in October at 3.8% and core inflation at 3.2% before the release of next PCE inflation data on 25 November. She also mentioned that the 25 basis point increase in September might not be sufficient.
The market highly expects the Fed to raise rates in December during the next Fed meeting. If inflation remains hot, further hikes may follow in 2027. The highly expected hike by the Fed is already reflected in prices. Therefore, the market will depend on the upcoming economic data and future directions for interest rates
Could Lower Oil Prices Ease Pressure on Gold?
Oil prices continue to drop in November after marking a high of $120 in October. WTI oil has dropped to near $82 while Brent oil has dropped to $92. If oil prices continue to drop and consolidate below $90, it may ease the inflation over time. However, it will require the assessment of price pressures across other goods and services.
The chart below shows that the one year inflation expectations dropped from 4.7% in October to 3.7% in November. The long-term expectations also dropped to 3.3% from 3.5%.
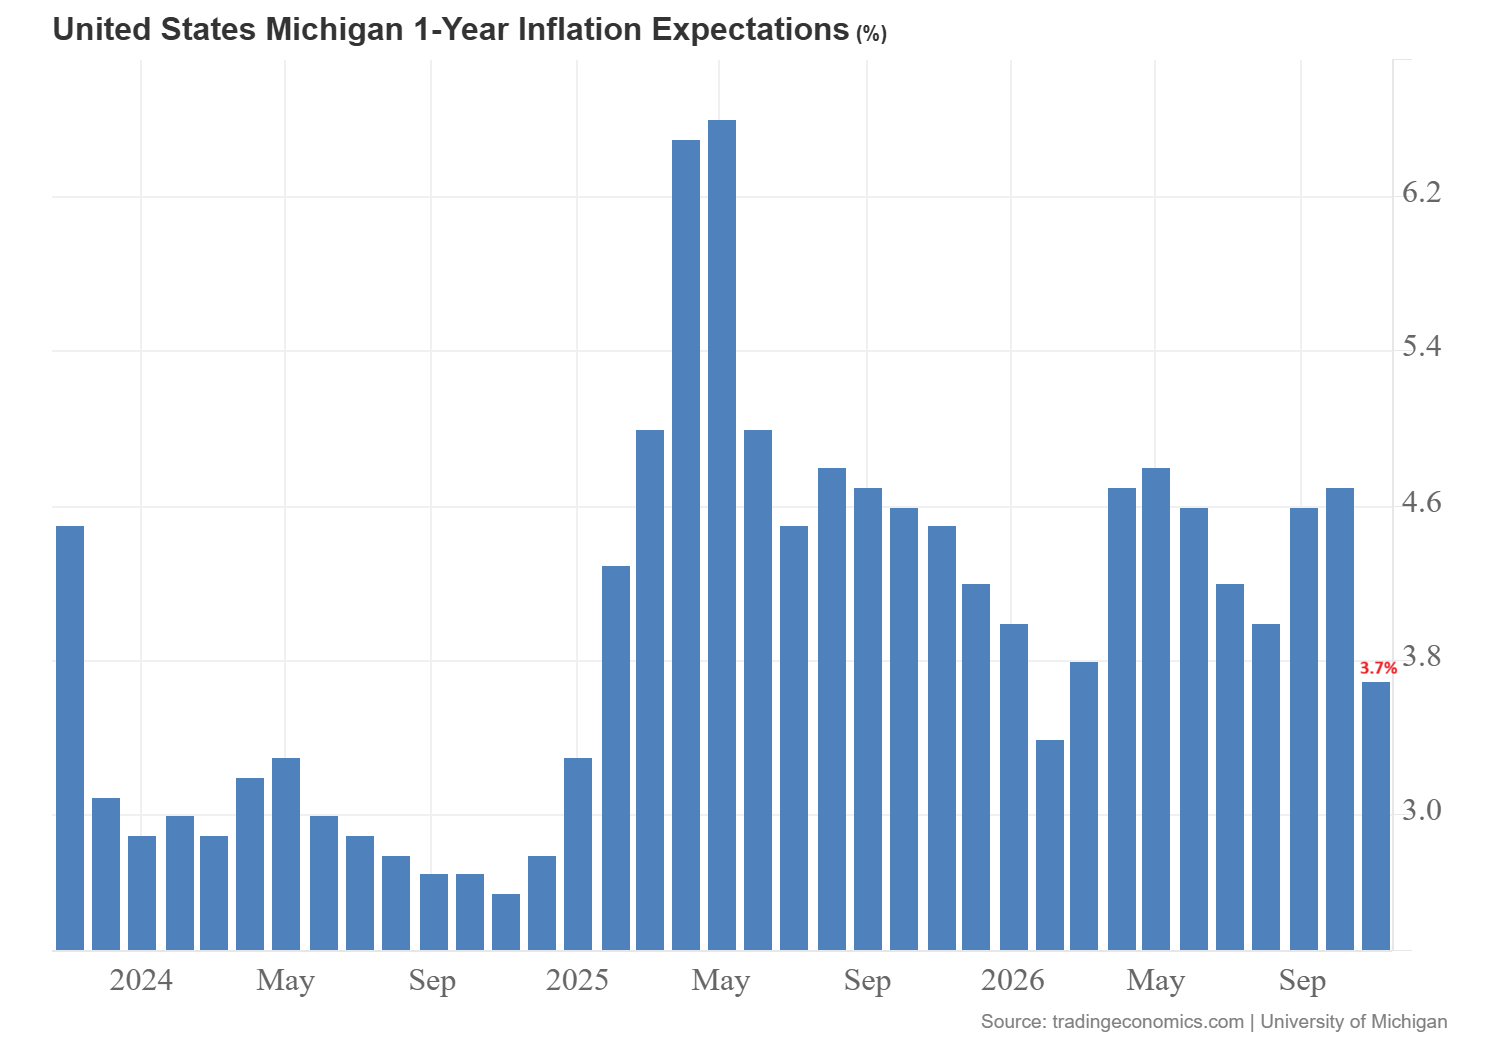
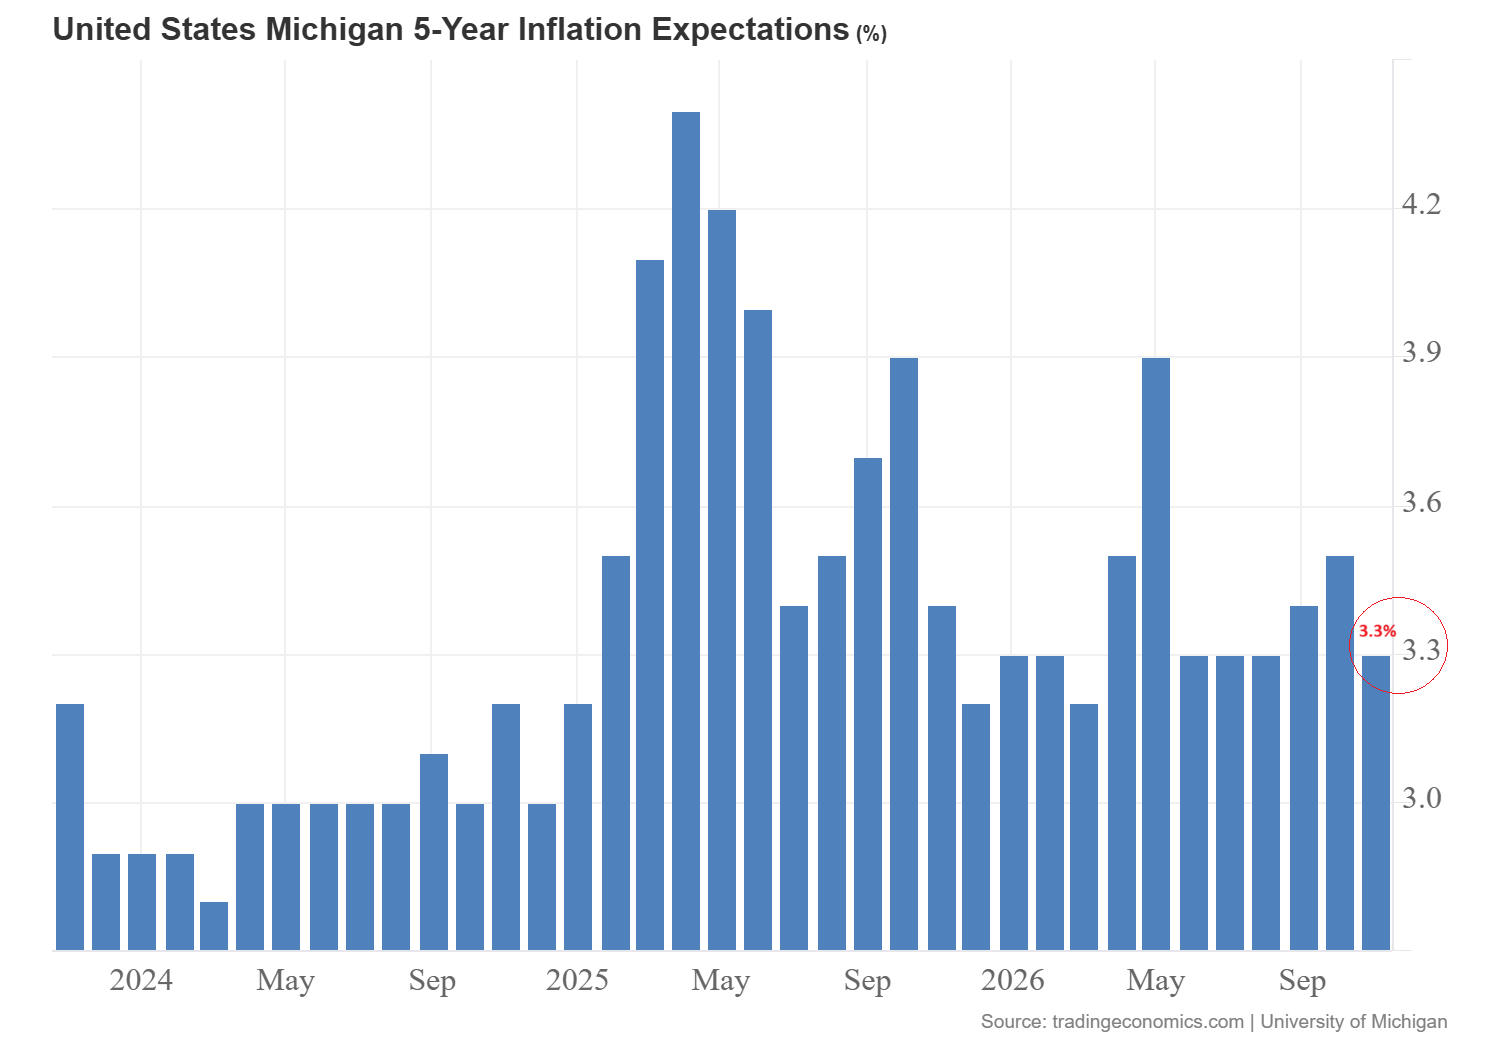
This indicates that households remain less worried about inflation as compared to previous measures.
This creates the balanced outlook for gold as the drop in inflation expectations may reduce the pressure for aggressive Fed tightening. But the outlook for gold still depends on upcoming inflation and economic data.
Can Central Bank Buying Support a Gold Recovery?
Central banks take advantage of lower prices as in 2022. The World Gold Council estimates that central banks and other official institutions bought 321 tonnes in Q3 2026, which is 42% increase from the previous year. These purchases reached 675 tonnes in first nine months of 2026.
These figures suggest that the reserve managers continued to buy during the gold corrections. This buying pressure provides support to gold prices.
The chart below shows that the holdings in China increased from 2,346.43 tonnes in Q2 to 2,409.57 tonnes in Q3 2026. This indicates that China continued to accumulate during broader correction.
The monthly report from the World Gold Council further shows buying pressure. World Gold Council reported further addition of 26 tonnes in October which takes China’s official holdings to about 2,435 tonnes. October was 24th consecutive month of reported buying.
Gold Price Forecast: Key Support Levels After the Selloff
Monthly Gold Chart: Why $3,400–$3,500 Support Matters
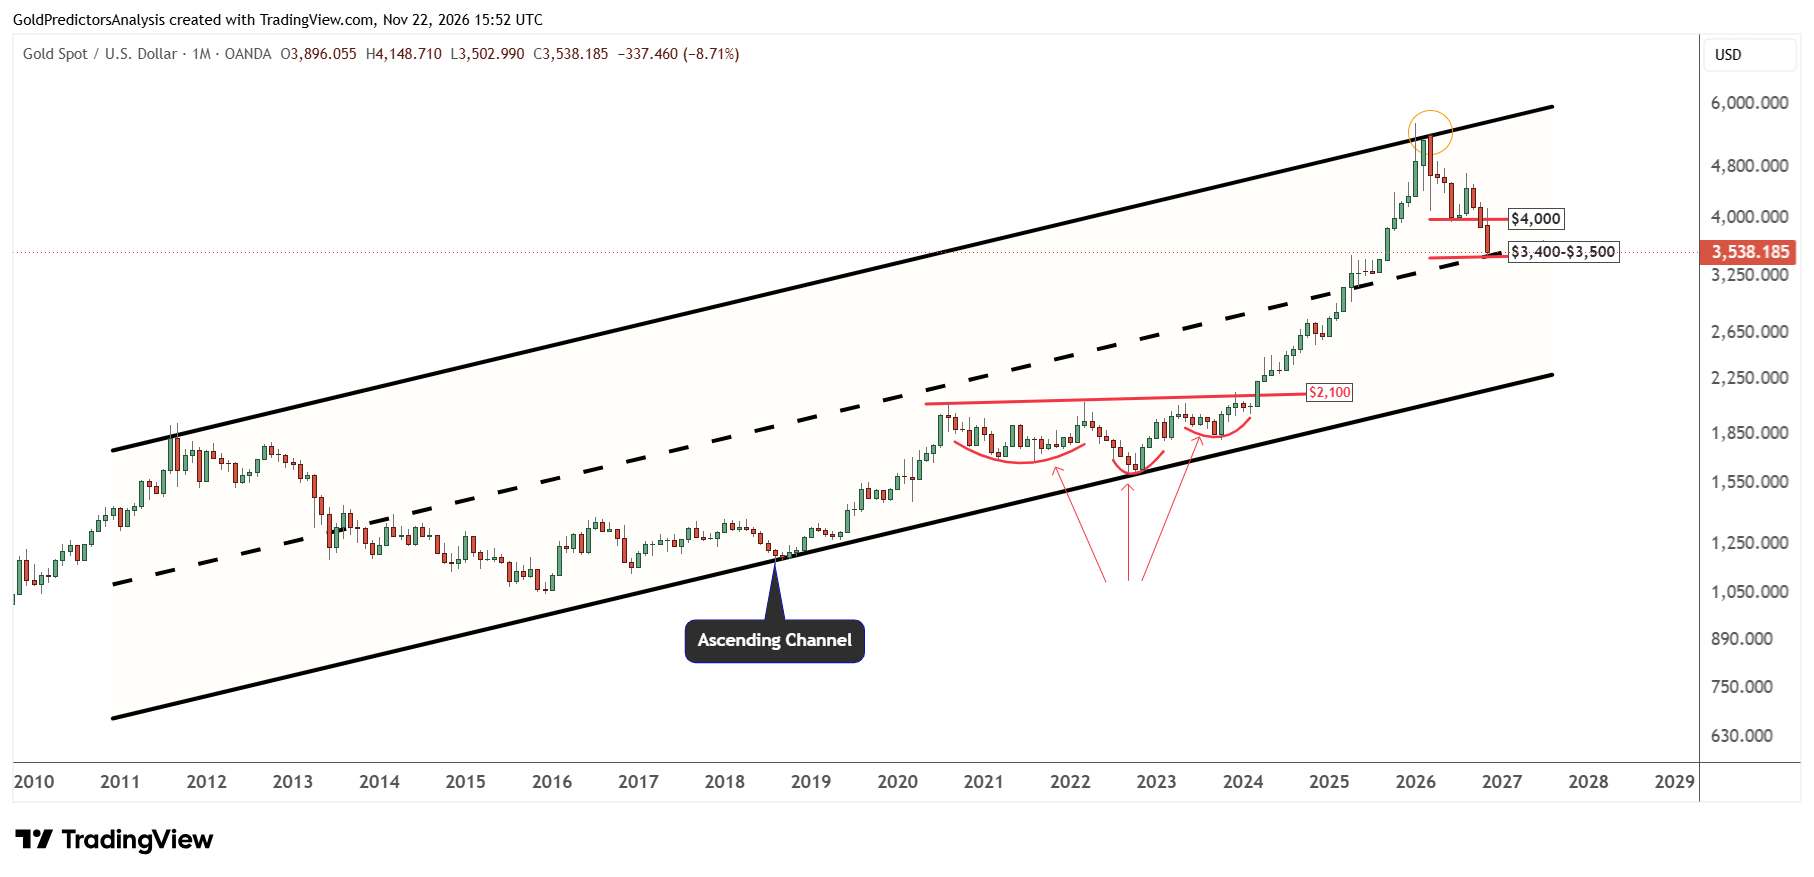
The monthly chart for gold shows that the price has been trading within ascending channel pattern for the past 15 years. The price hit the resistance of this channel at $5,600 in January and triggered a strong drop towards the midline of this channel. The midline lies between $3,400 and $3,500. But a break below this zone may trigger deeper correction towards the $3,000 level.
The formation of inverted head and shoulders pattern from August 2020 to February 2024 suggests positive price action within bullish structure. This suggests that this correction may be considered an opportunity for long term investors to accumulate at lower levels.
To understand the outlook for deeper correction in the spot gold market, the monthly line chart below shows the formation of broader ascending channel pattern. This ascending channel stretches from the lows of 1976 towards the record highs. The price broke above this ascending channel in 2025 to reach a record high in the $5,600 area. After this record high, the price corrected back within the channel and entered a deeper correction.
If the price breaks below the $3,400-$3,500 region, it will likely drop towards the blue dotted trend line that stretches from the highs of 1980 and runs through the highs of 2011. This support lies in the $3,000 area. Once the price reaches this region, it may trigger a strong rebound towards the $4,000 region.
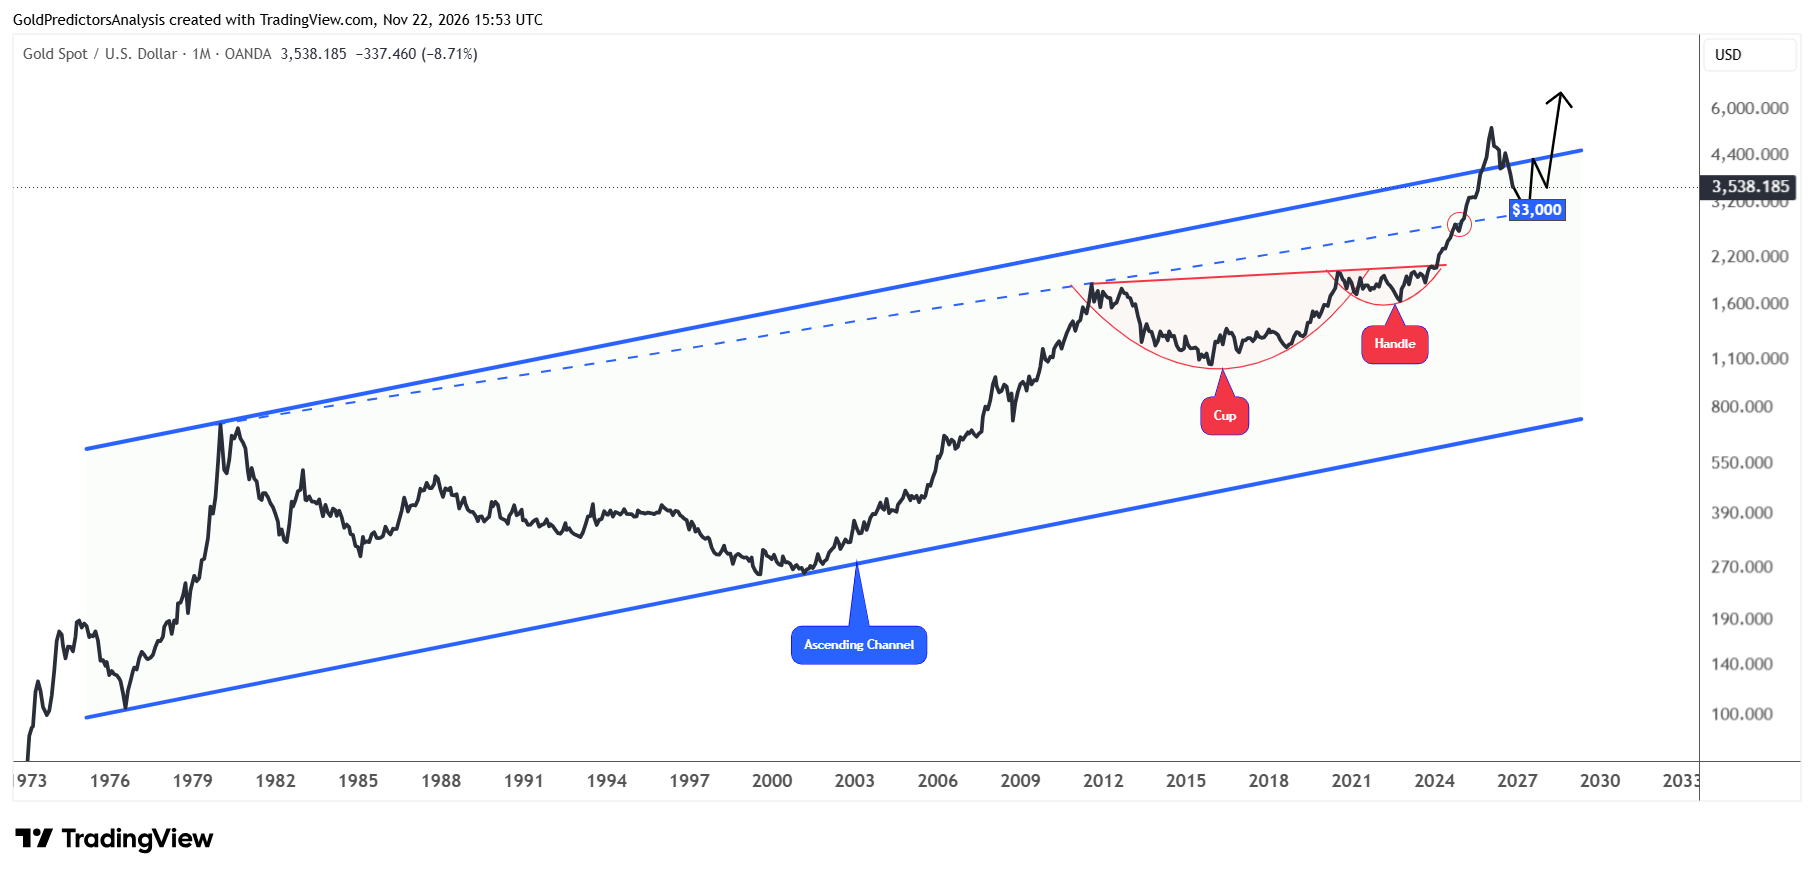
The monthly spot gold chart shows the formation of a cup and handle pattern from the highs of 2011 to the breakout in 2023. This cup and handle formation shows strong bullish pattern and suggests that gold prices may rally again once this correction is over.
Weekly Gold Chart: Can Oversold Conditions Support a Rebound?
To further understand the recent correction and the price targets, the weekly chart below shows that the breakdown from the triangle in the $4,000 area has triggered strong drop towards the first target in the $3,500 region. The price lost 8.92% last week and closed at $3,538.
However, a break below the $3,400-$3,500 area will likely open the way for another drop towards the $3,000-$3,200 area, which is considered a strong support region in the gold market.
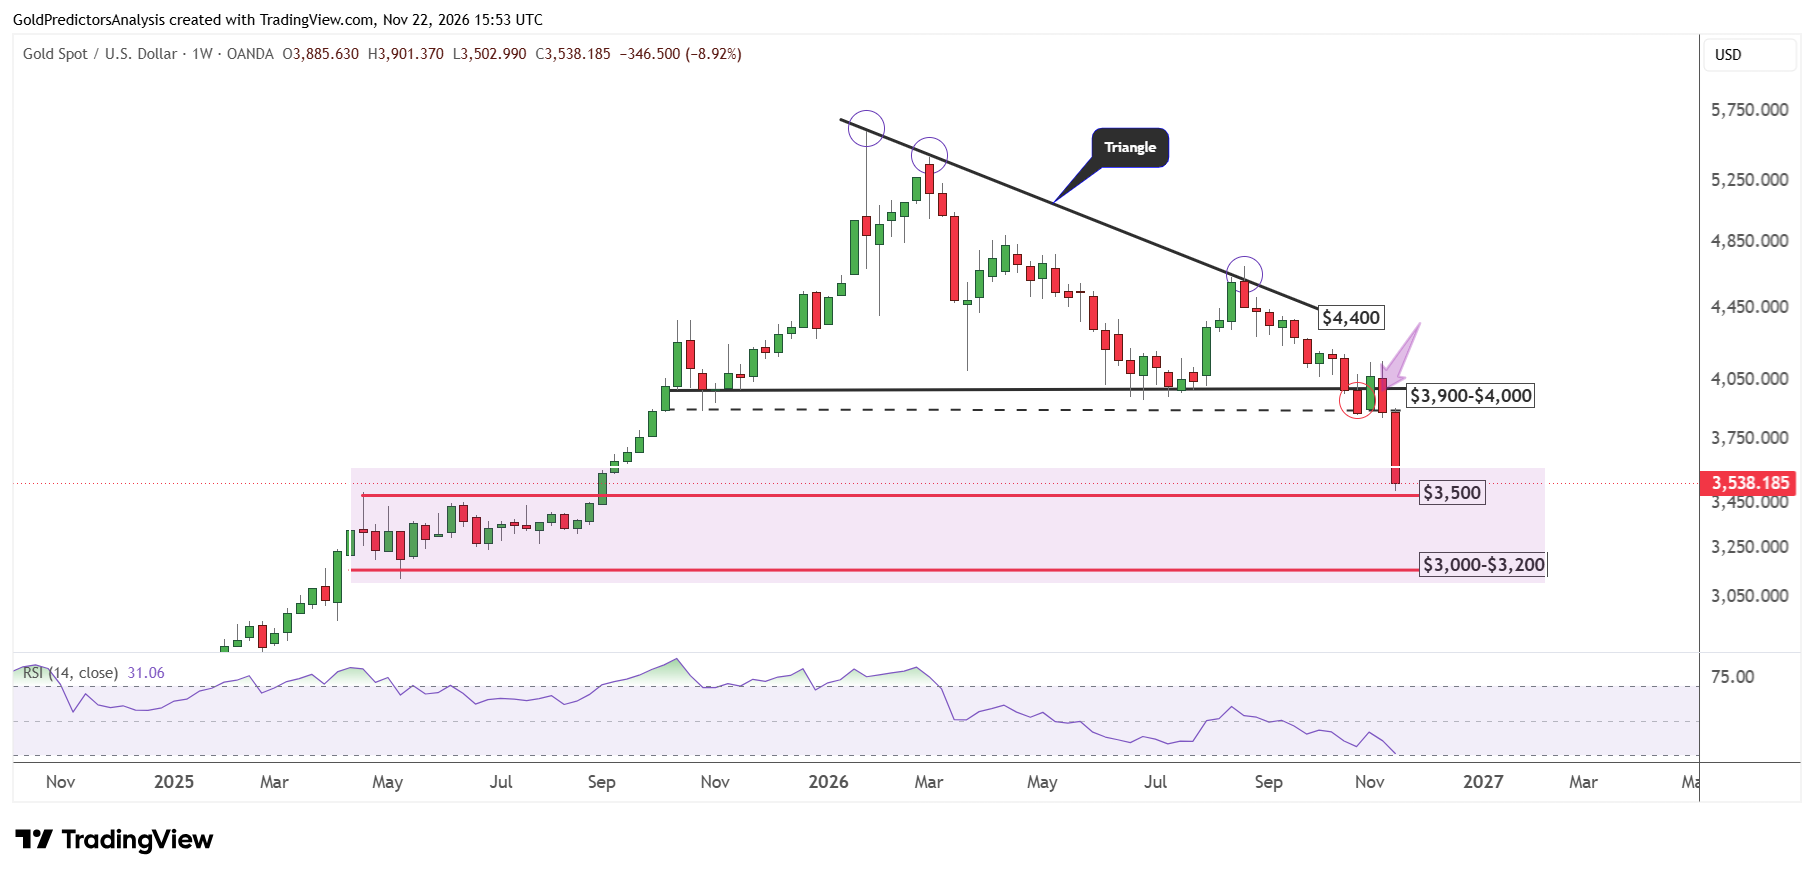
It is interesting to note that the RSI indicator has reached the oversold boundaries as the price approaches the key support areas. This oversold condition in the RSI was last seen in September 2022, when gold prices marked a low and triggered a strong rally higher.
This is similar to the situation when the Federal Reserve started to increase rates in 2022 to combat inflation after the outbreak of the Russia-Ukraine war. If a similar situation occurs and gold prices mark a low here, prices may rally higher again.
Long-Term Gold Shows Constructive Structure
Despite the strong drop in 2026, the overall price structure remains strongly bullish as seen in the yearly chart below. The chart shows that the price could move much higher from current levels.
The chart highlights that the price gained nearly 700% from the lows of 1976 to the highs of January 1980. Then the price gained another nearly 700% from the lows of 2001 to the highs of 2011. The price formed a low in December 2015 and has continued to rally higher. If prices continue to rally higher, a 700% gain could take them to above $8,000 which is close to the long-term target of the $9,000-$10,000 region.
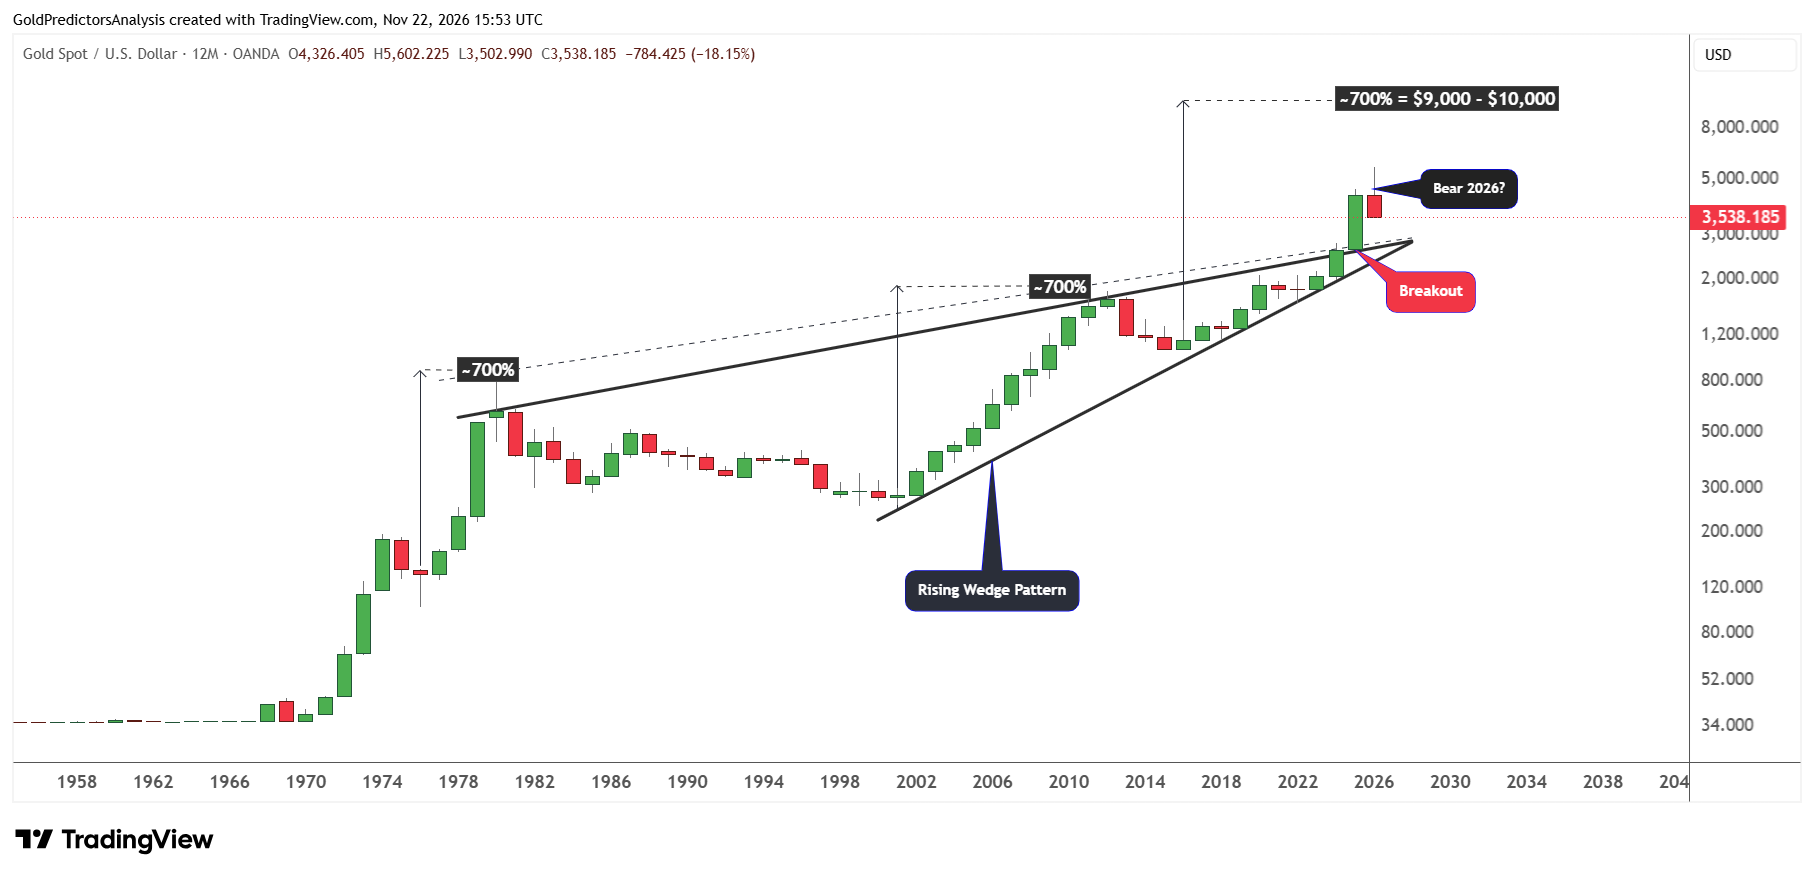
But the main problem is the yearly candle for 2026. Now, only about one month remains before the end of 2026 and December is usually a choppy and overlapping month for gold as per the seasonal analysis. If gold closes the year below the $4,326 region, it will form a negative yearly candle and increase the risk of consolidation in early 2027.
But a close below $3,500 in 2026 will increase the risk of further downside in 2027. The price will likely remain strongly bullish as long as the price holds the $2,700-$3,000 support area in the long term.
Final Thoughts
The Russia-Ukraine war in 2022 raised fears of energy shortages, drove up crude oil prices and increased inflationary pressure. This forced the Fed to hike interest rates which strengthened real interest rates and the US dollar and pressured gold prices.
The current situation shares some features with 2022. Gold prices are facing pressure from the strength of the US dollar. The US dollar has gained strength due to US tariffs, AI spending fears and strong technology sell-offs, triggering a strong drop in gold prices.
Despite the drop in gold prices, the long-term outlook will remain bullish as institutional buyers may take advantage of lower gold prices. China imported 1100 tonnes of Gold in the 8 months to August. The low prices may encourage further buying.
The gold price has approached the key support zone of $3,400-$3,500 and is looking for the next direction. A break below $3,400 may push prices further down to $3,000-$3,200. This correction in gold is a medium-term correction within the long-term uptrend.
Read more: Silver Leads Losses as Dollar Gains