
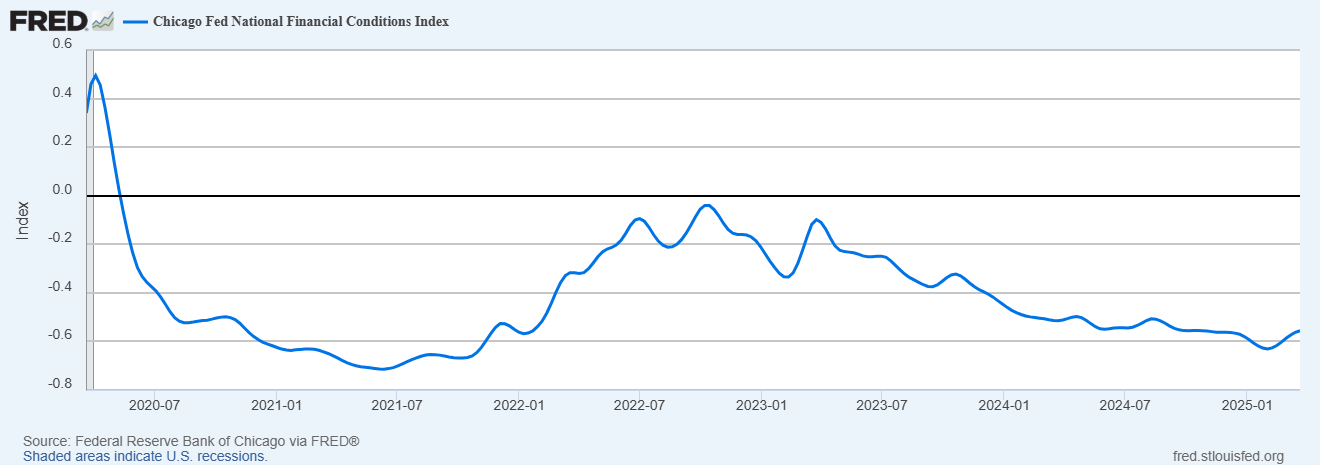
The Chicago Fed National Financial Conditions Index rose to -0.556 in March, showing tighter financial conditions. This tightening indicates more stress in credit markets, typically leading investors to seek safety in Treasury bonds. As demand for Treasuries increases, yields fall, which aligns with the recent drop in the 10-year Treasury yield. The decline in yields also pressures the US dollar, as lower returns on US assets reduce foreign demand. This drop in the US Dollar Index, approaching the key support level of 103.50, increases the probability of hitting the next target at 100.65. Such a move would weaken the dollar’s global appeal.
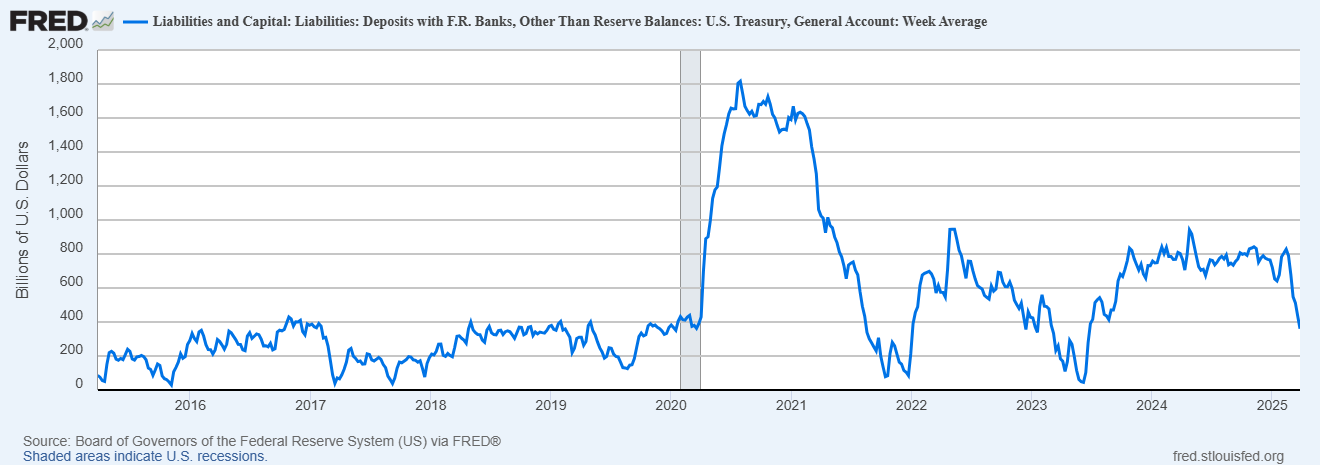
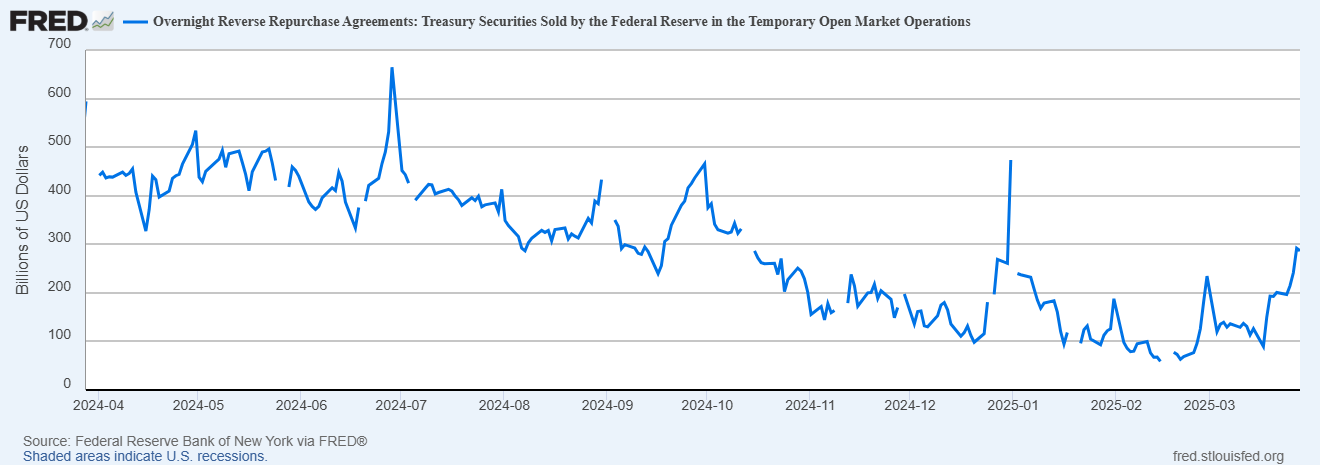
The Treasury is rapidly drawing down its General Account (TGA) at the Federal Reserve, adding liquidity to the markets. This injection supports risk assets and signals that the government compensates for tighter private financial conditions. However, some of this liquidity is being neutralized by an increase in reverse repo operations, as shown in the chart below. This tug-of-war between liquidity injection and absorption creates mixed signals. If reverse repos continue rising, they could suppress the stimulative effect of the TGA drawdown, which may limit further drops in yields and add uncertainty to the US Dollar’s direction.
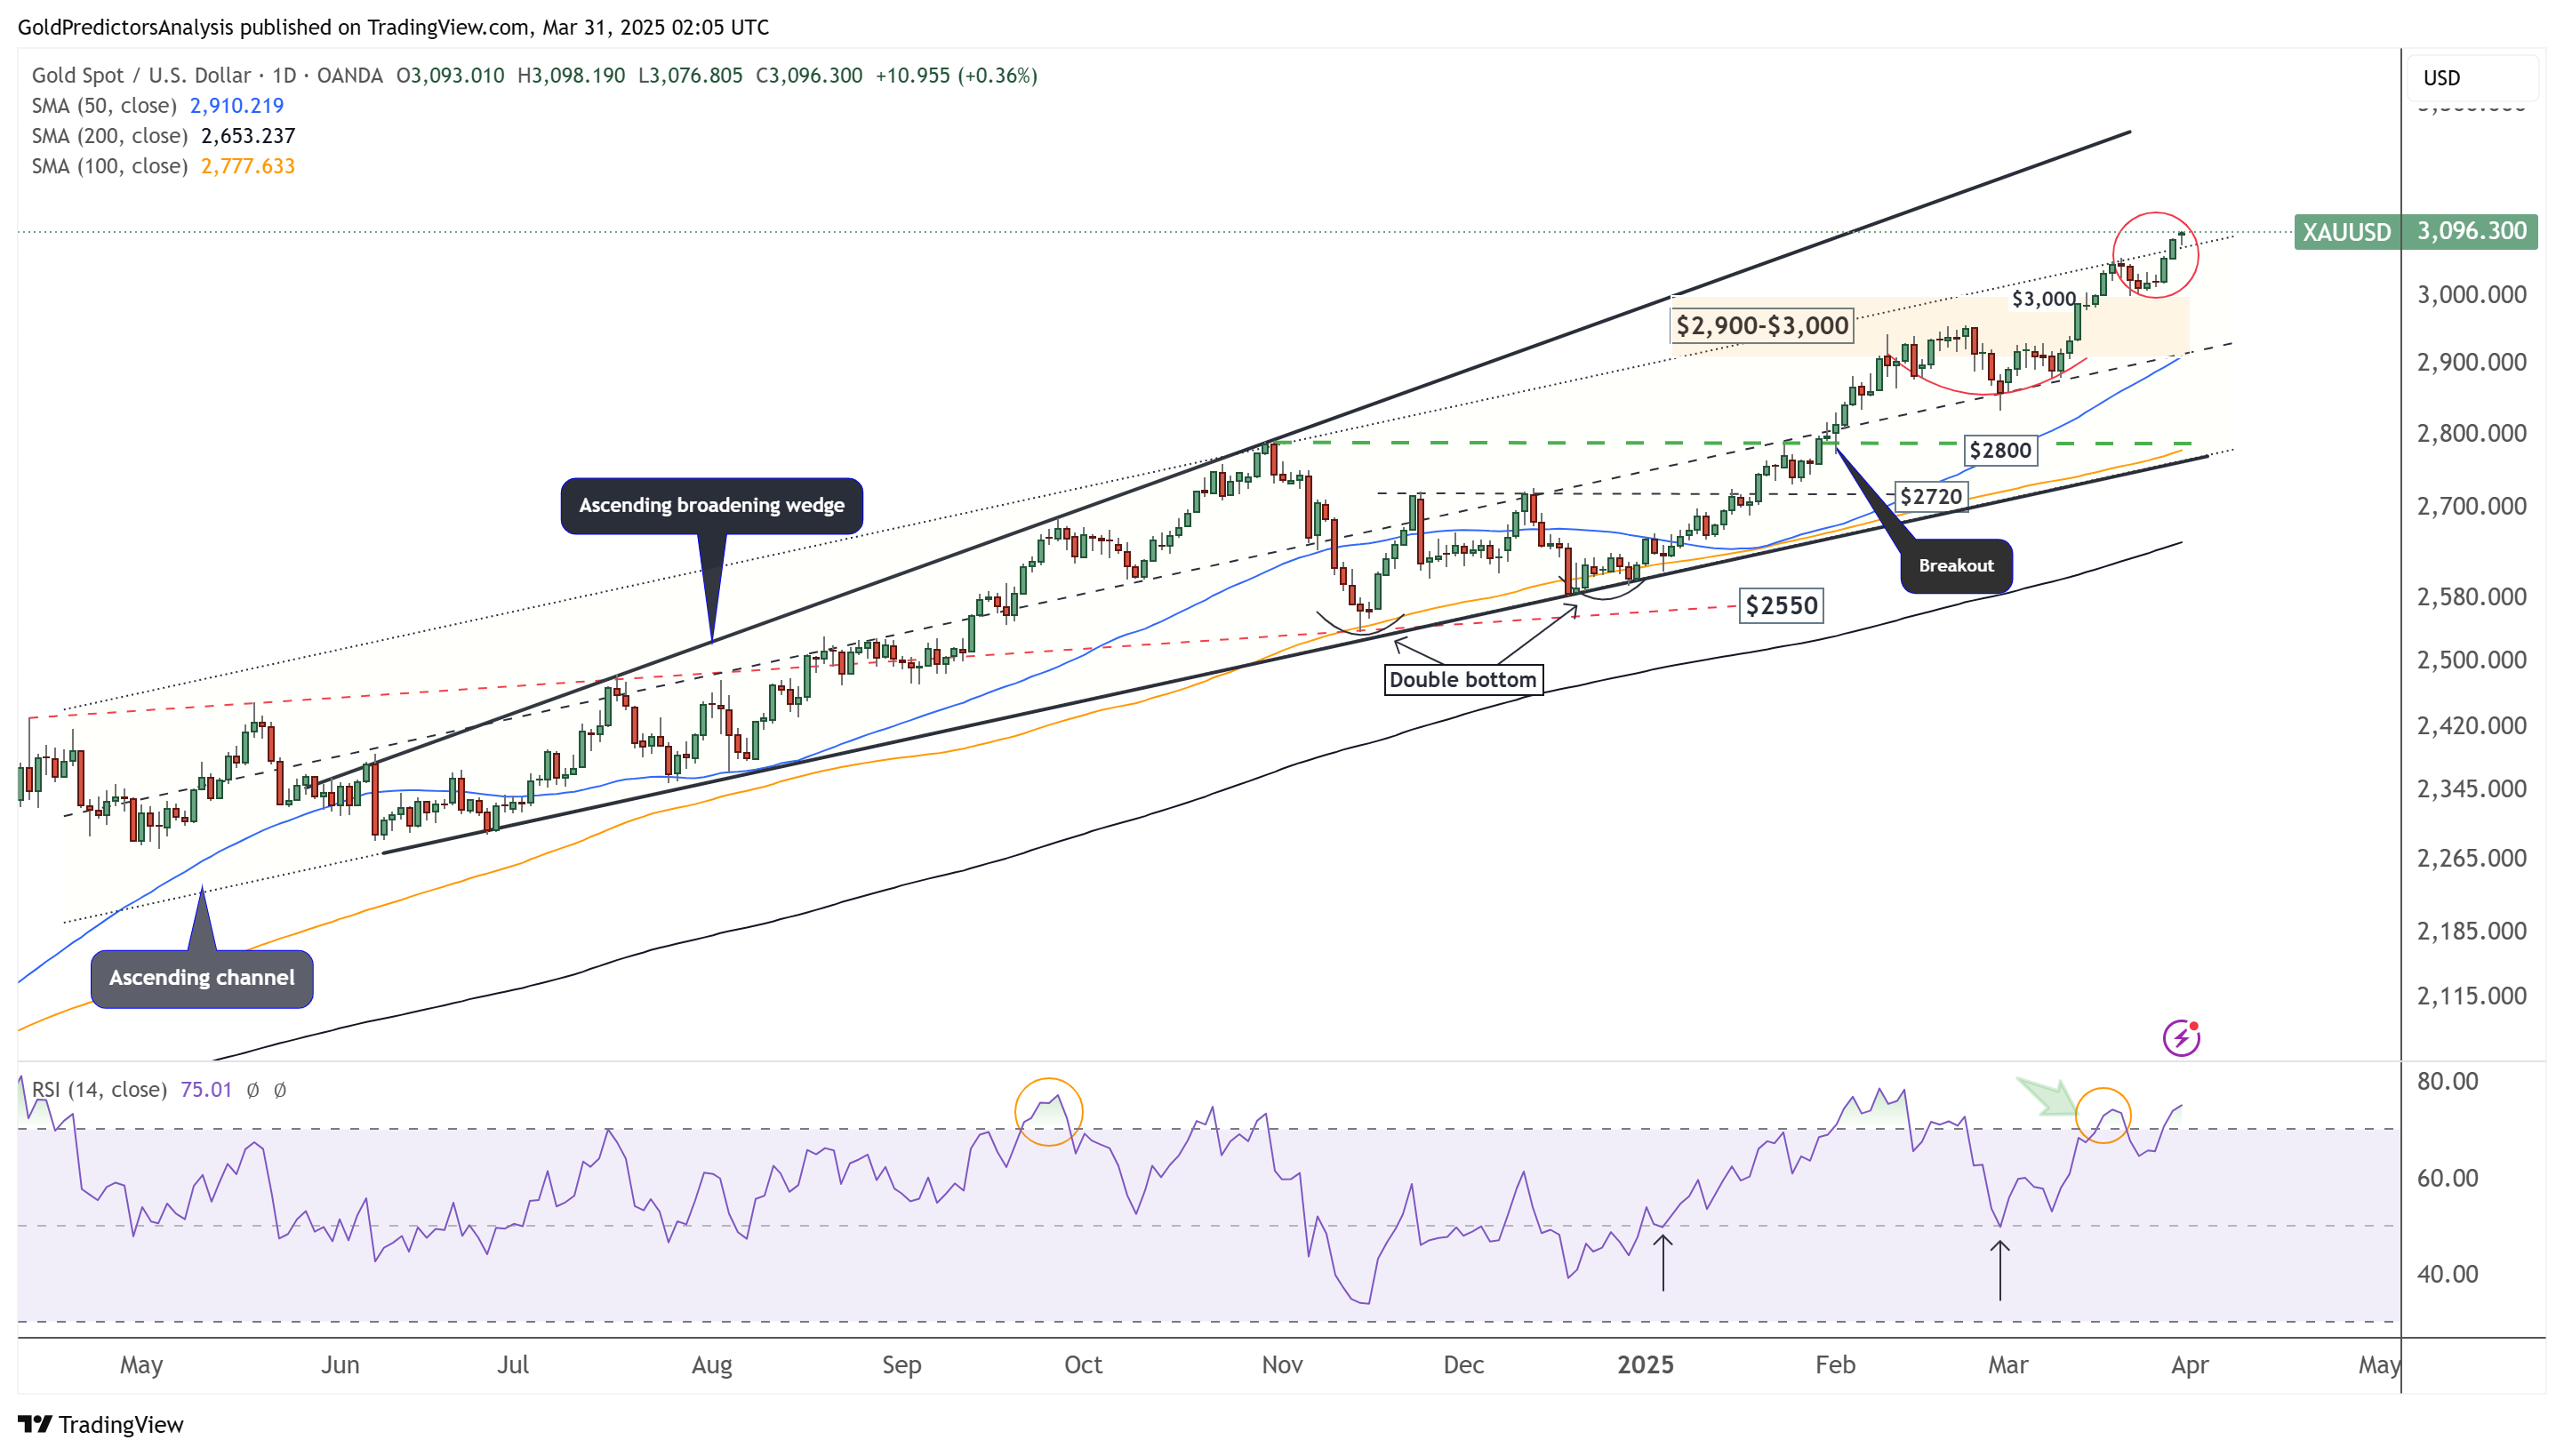
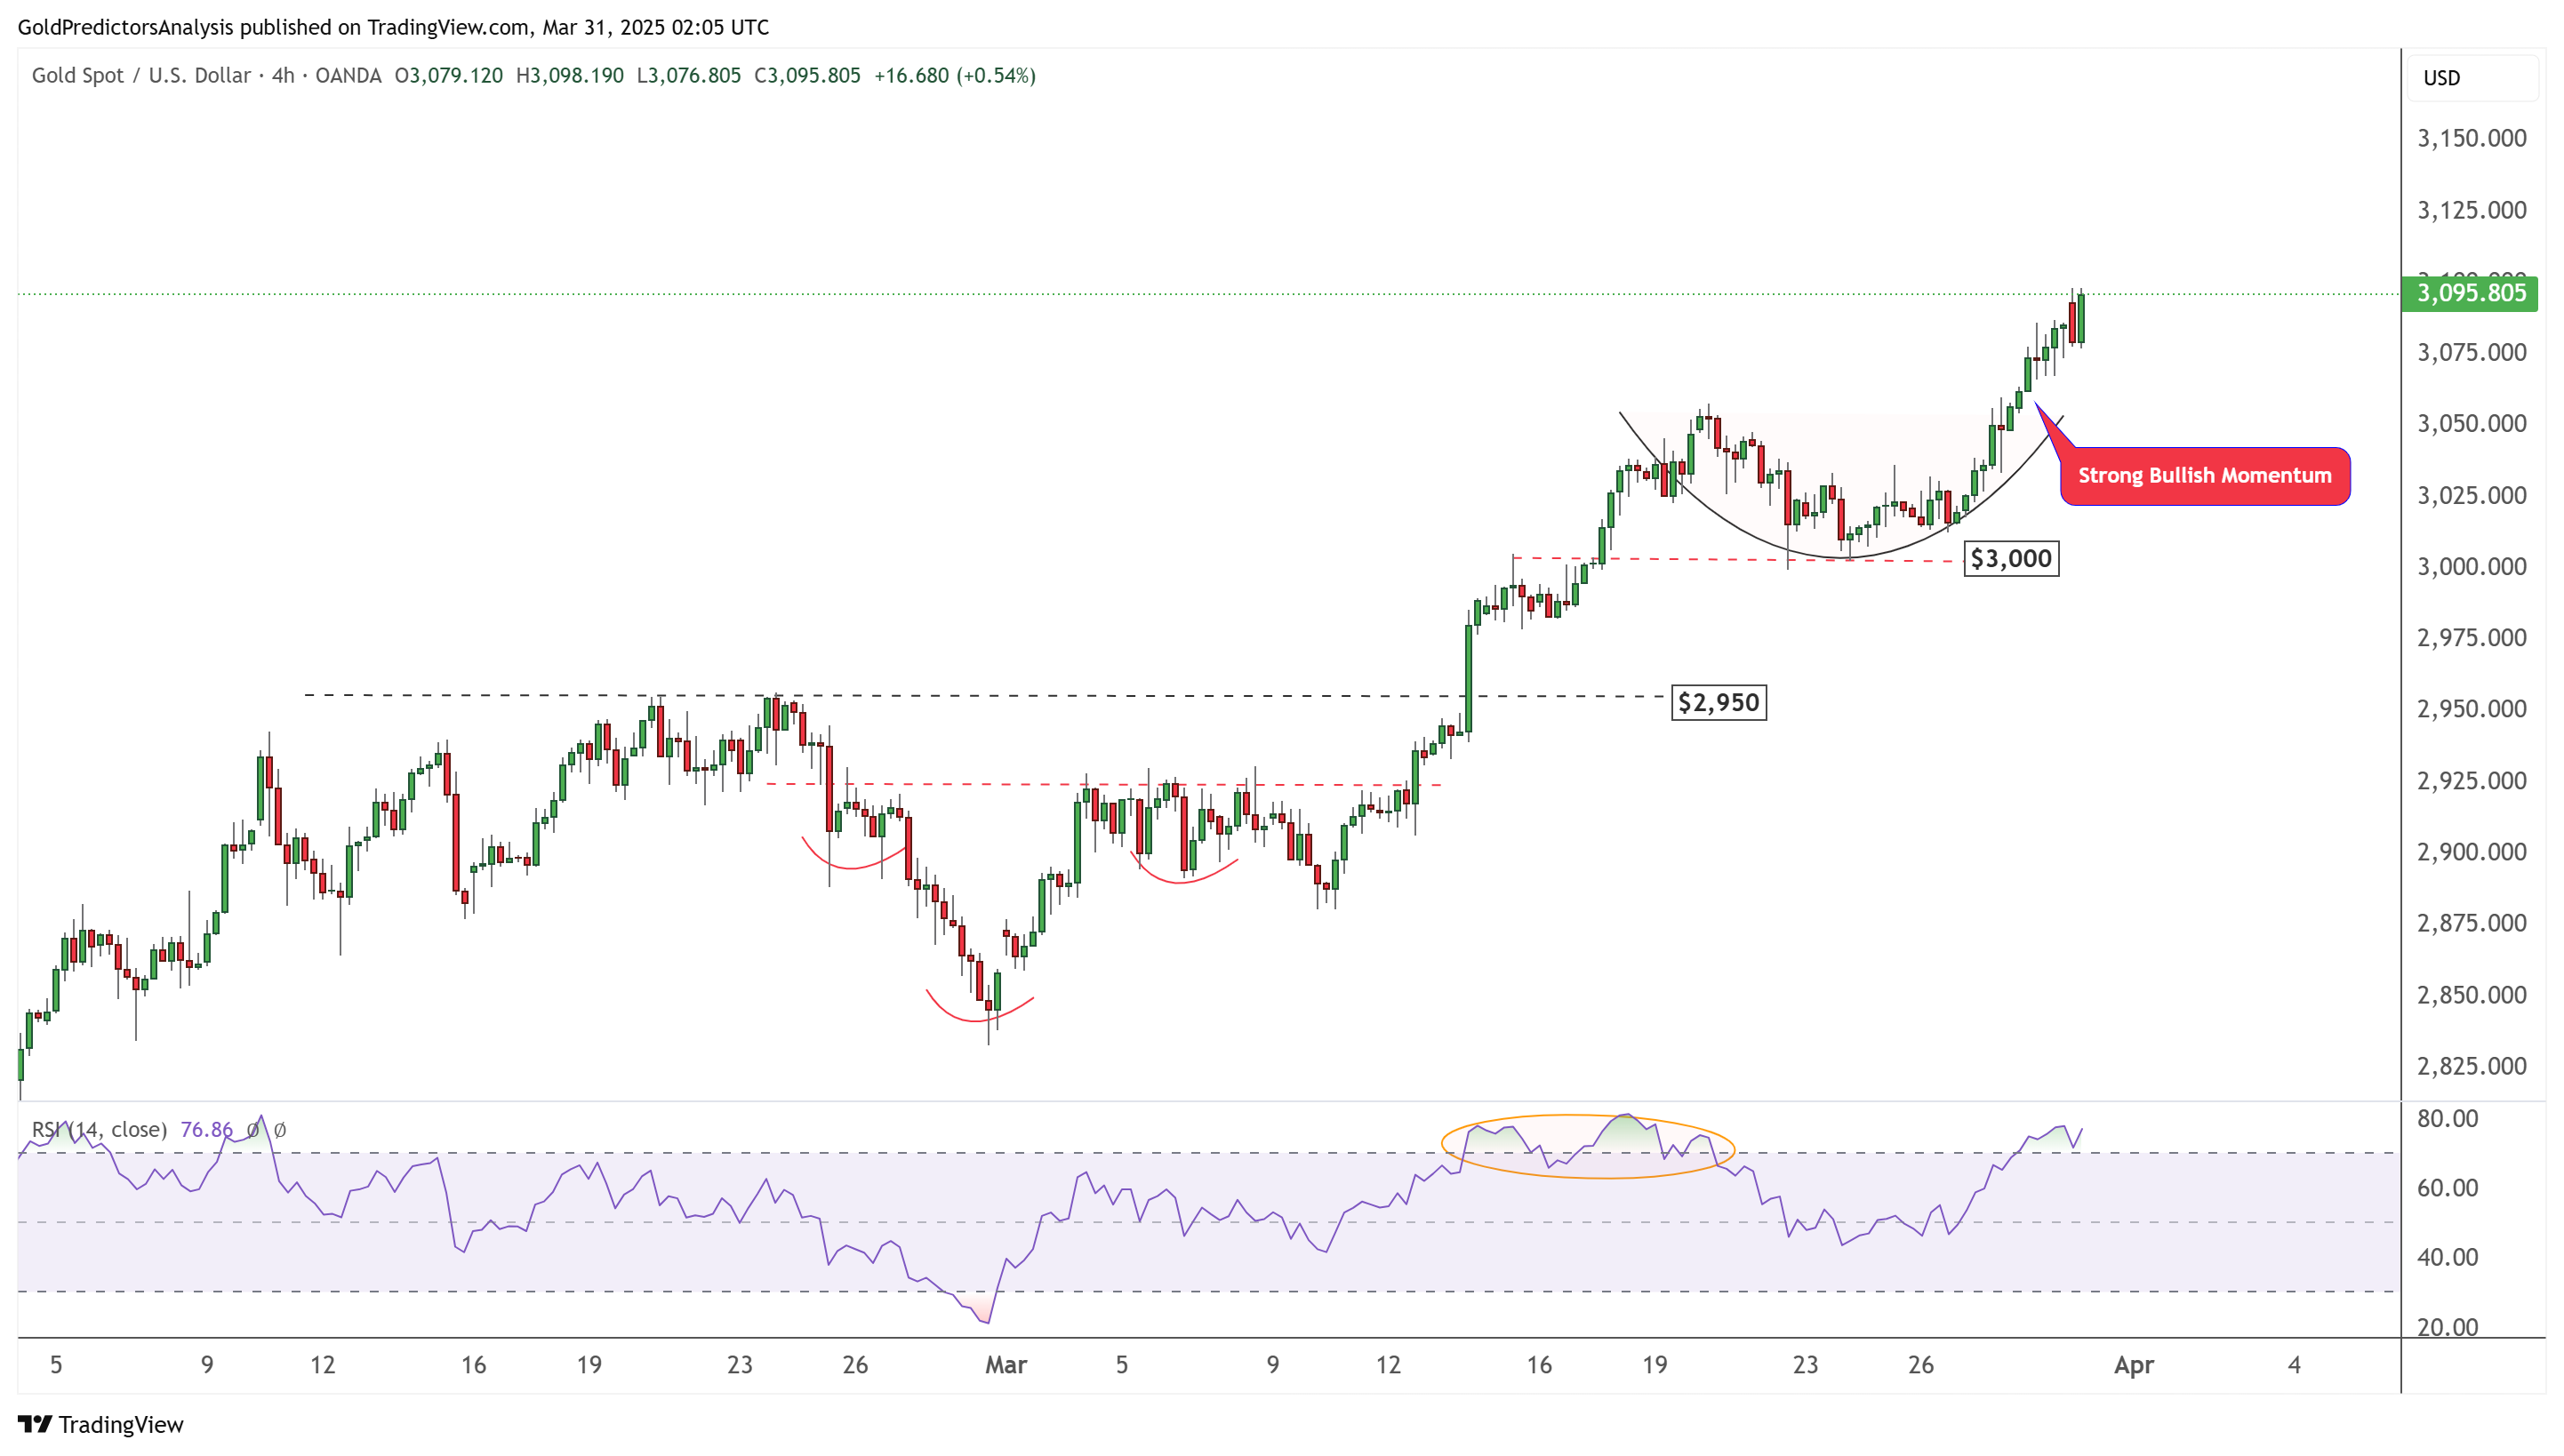
Gold (XAU) prices surged past resistance at $3,057 to close at $3,085, marking a new all-time high. This breakout, supported by a shallow retracement and solid support at $3,000, confirms strong bullish momentum and justifies a new long-term target. The rally is driven by falling Treasury yields, a weakening dollar, and rising uncertainty in financial markets. Meanwhile, expectations of further Fed rate cuts and capital outflows from US markets override any dollar-strength narrative tied to tariffs, further fueling gold’s rise.

Gold (XAU) Technical Analysis
Gold Daily Chart – Bullish Momentum
The daily chart for gold shows that the price closed strong on Friday, breaking the resistance line of the ascending channel. This strong weekly close indicates bullish momentum, and the price is likely to continue higher. Despite the overbought conditions observed in the RSI on the daily chart, the bullish momentum in the gold market suggests further upside.
Gold Price Forecast
Every new Gold analysis as it publishes, today's technical signal and key levels, live price — on one page.
See all Gold forecastsGold 4-Hour Chart – Strong Bullish Momentum
The 4-hour chart for gold further confirms the strong bullish momentum, as the price has broken higher after forming a cup pattern. The price has remained strong since the breakout, indicating continued upside in the gold market.
Treasury Yields (TNX) Technical Analysis
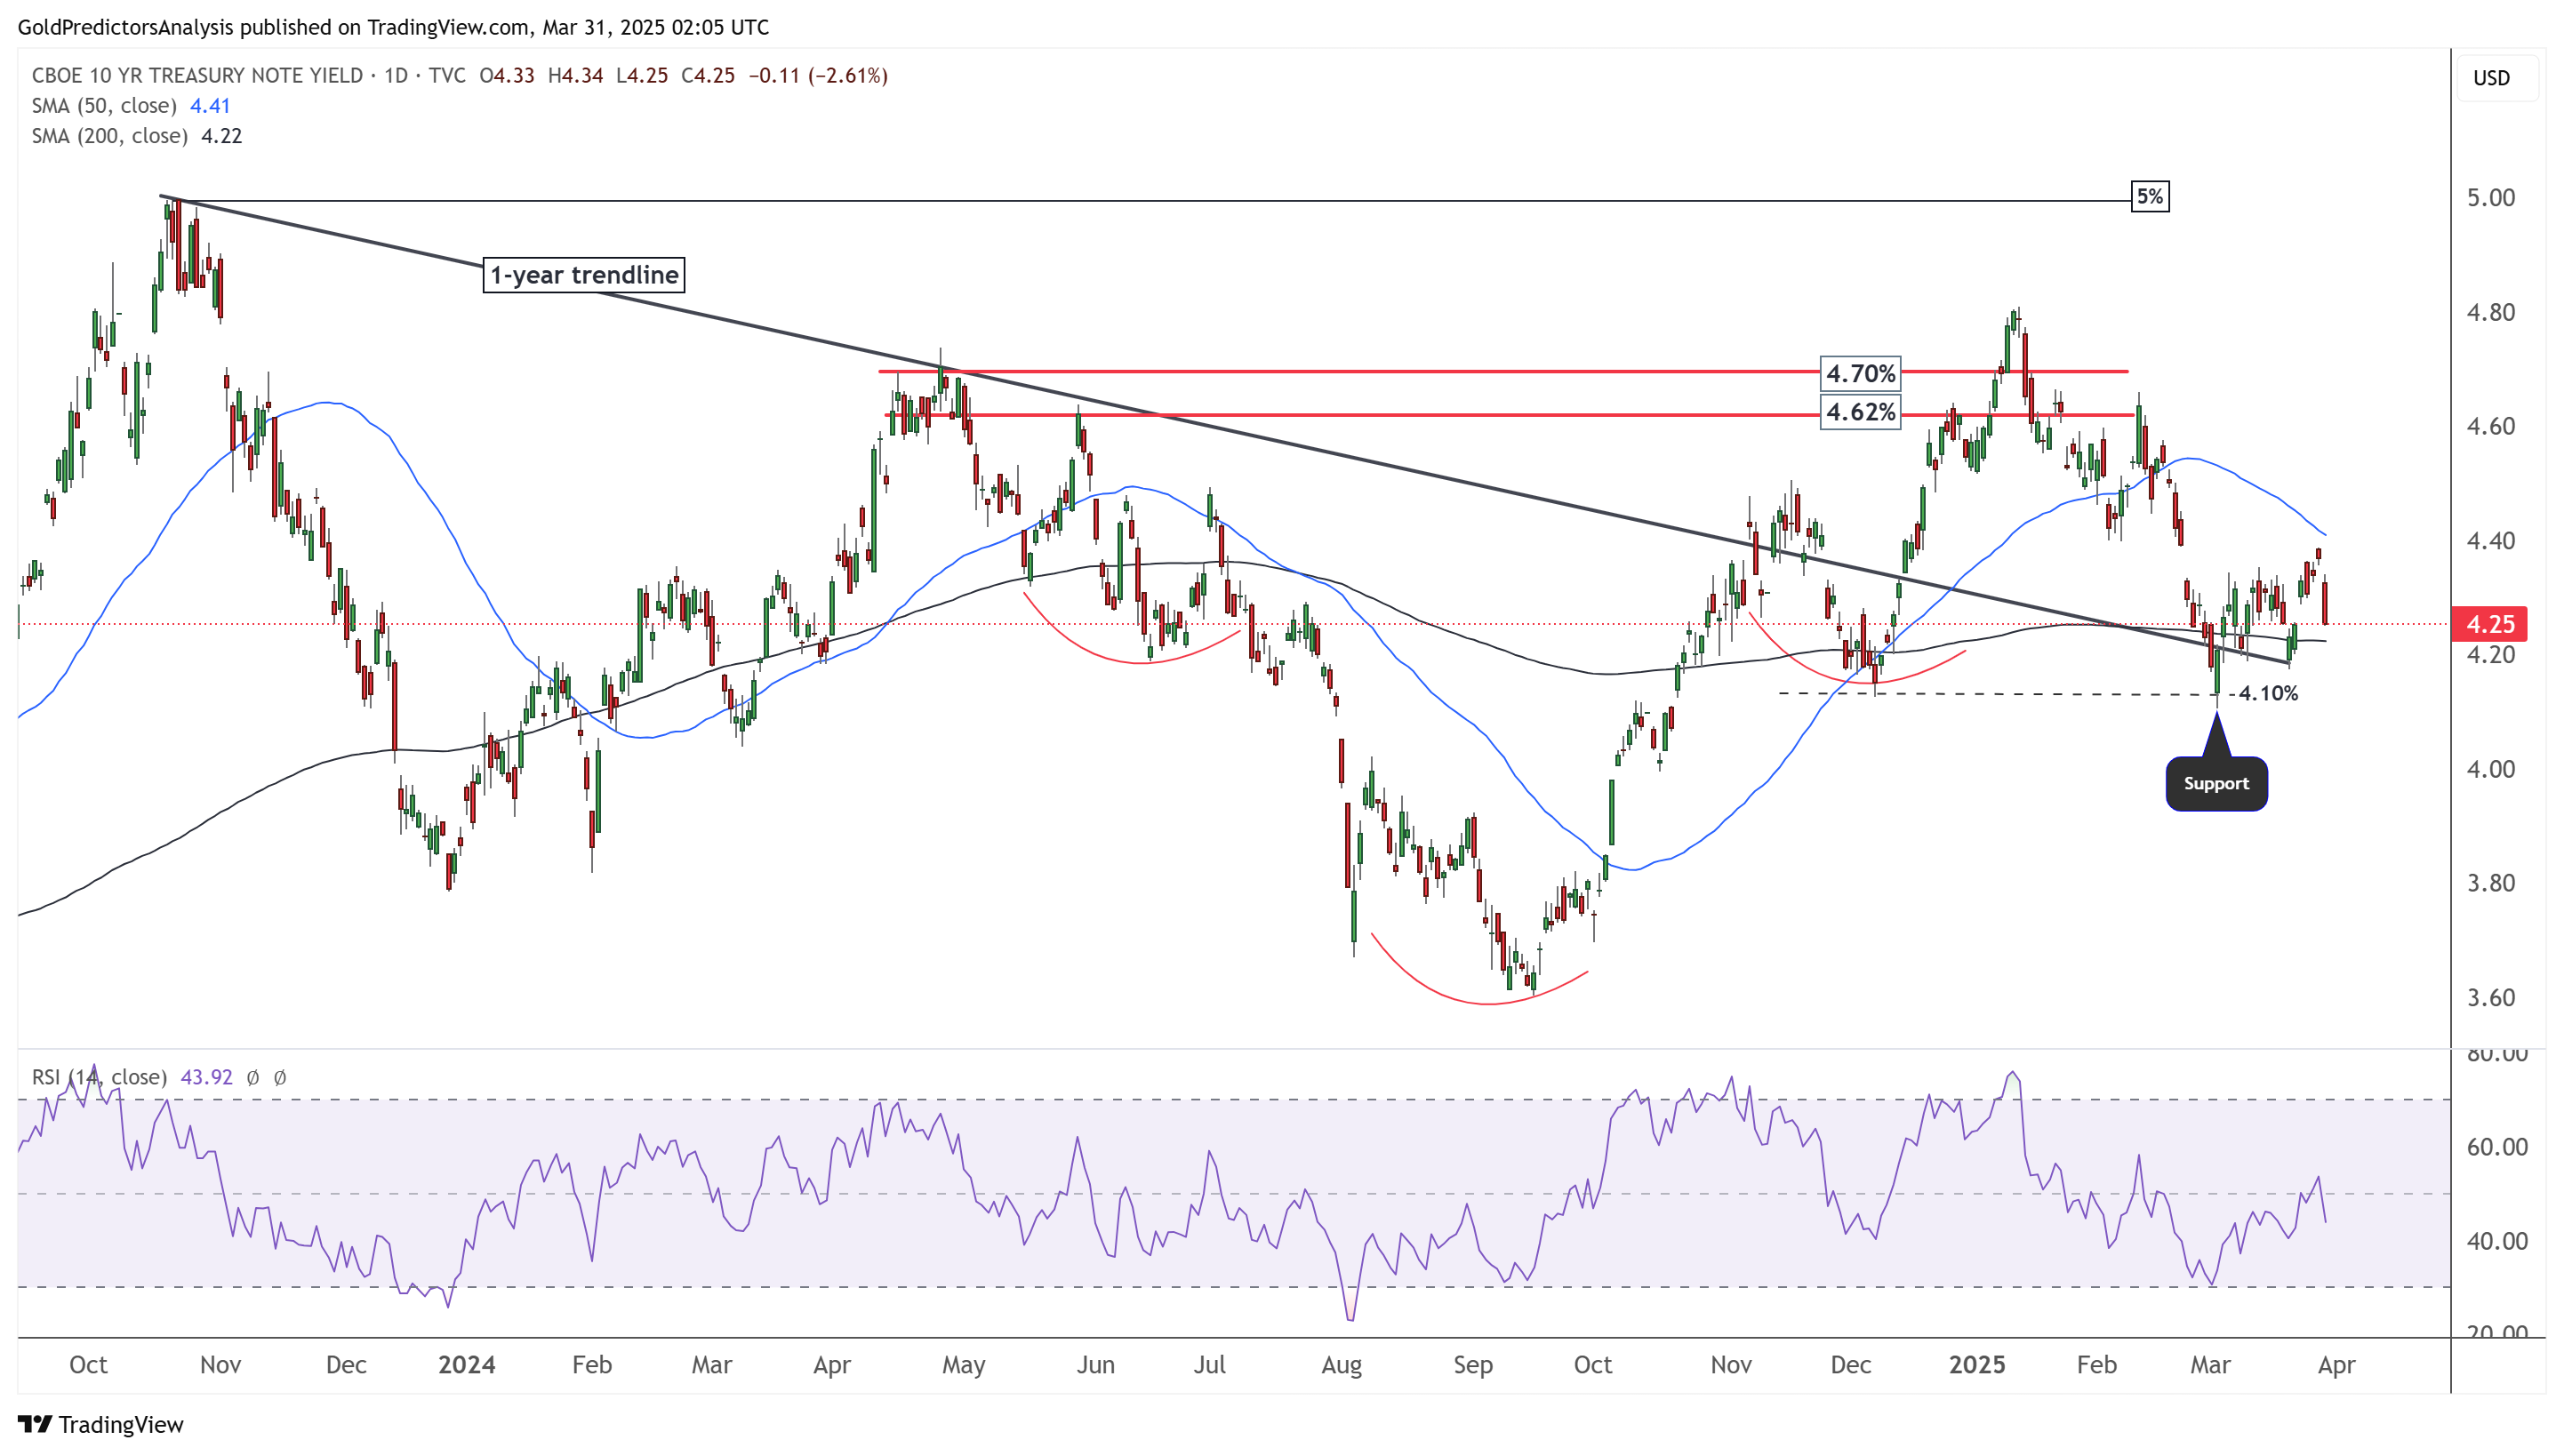
10-Year Treasury Note Yield Daily Chart – Downward Trend
The daily chart for US Treasury yields shows that the price consolidates below the 50-day SMA and looks weak. Moreover, the RSI is dropping from the mid-level, further indicating that yields may continue declining. The immediate support is at 4.10%, and a break below this level would suggest further downside in the yields.
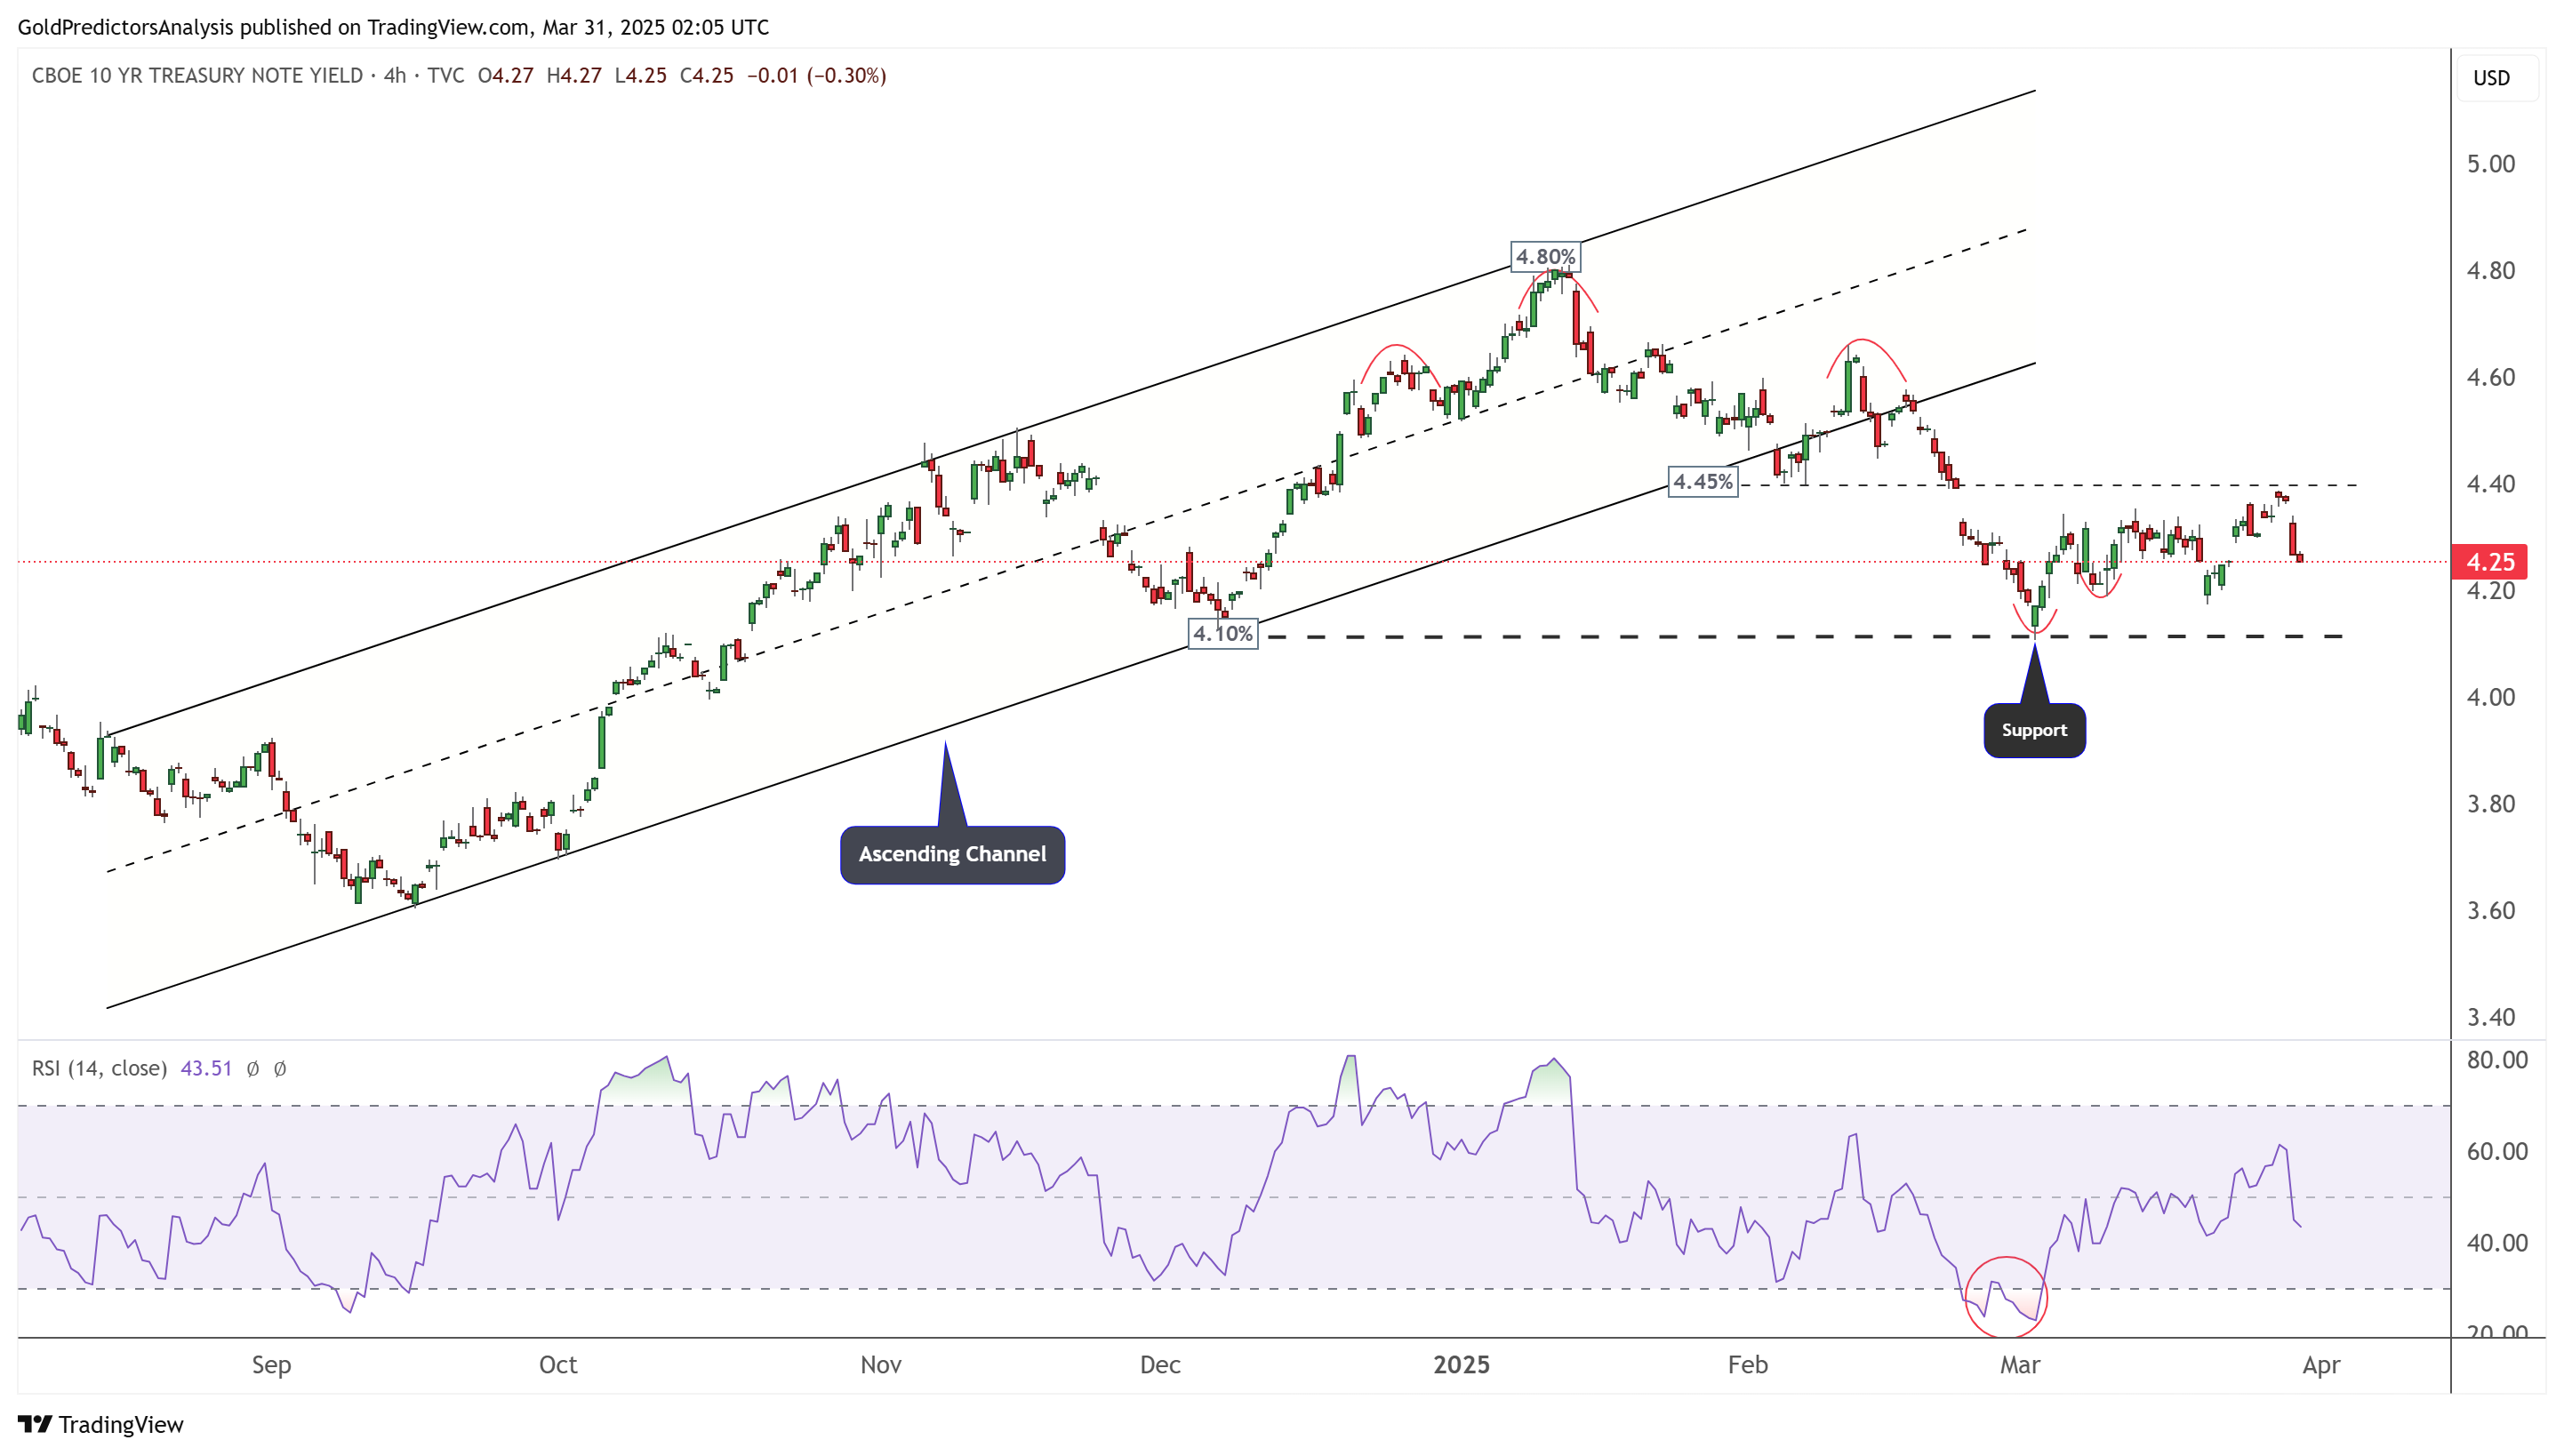
10-Year Treasury Note Yield 4-Hour Chart – Downward Trend
The 4-hour chart for 10-year Treasury yields shows bearish pressure below 4.45%. Yields are dropping back toward the support at 4.10%, and a break below this level would indicate further downside.
US Dollar (DXY) Technical Analysis
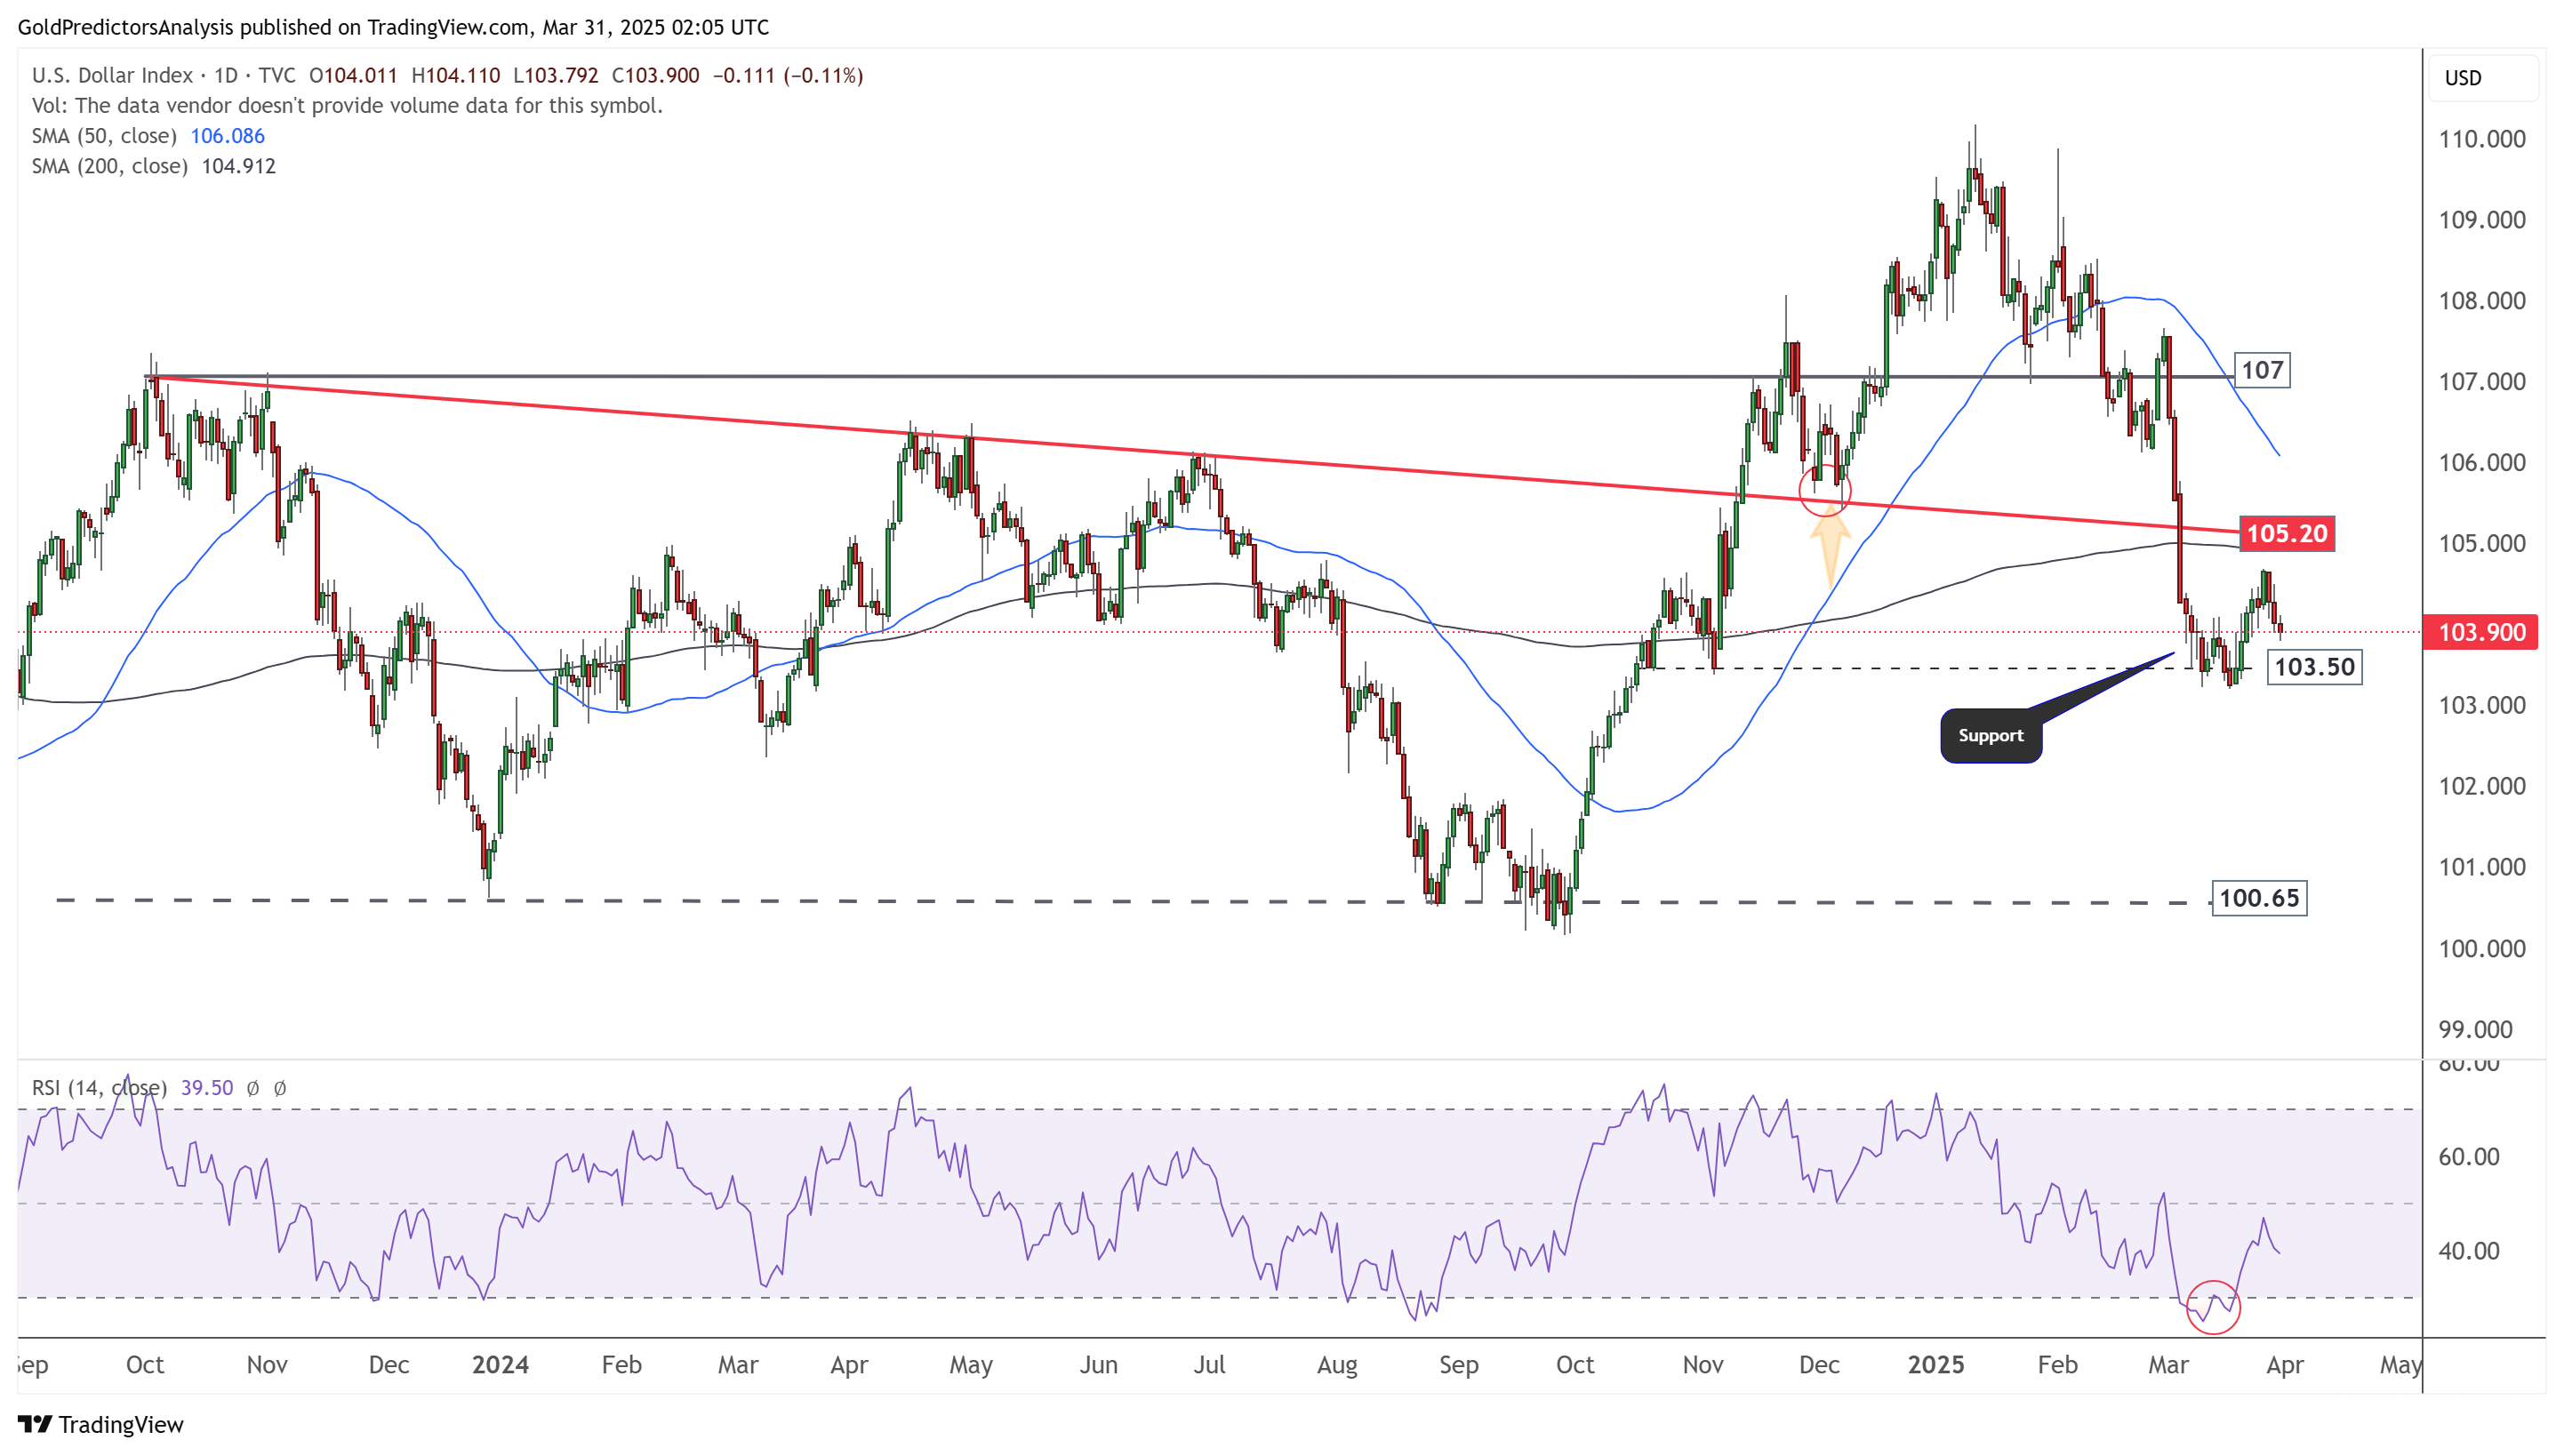
US Dollar Daily – Bearish Pressure
The daily chart for the US Dollar Index shows bearish pressure below the resistance at 105.20. Despite a recent attempt to recover, the rebound from 103.50 has failed to negate the bearish pressure, and the index continues to decline toward 103.50. If this level breaks, it would open the door to 100.65.
US Dollar 4-Hour Chart – Bearish Pressure
The 4-hour chart for the US Dollar Index shows that the price is currently trading within a descending channel. Following this, the latest rebound developed after the formation of a bearish divergence. However, this rebound has faced resistance within the channel, indicating a continued negative trend.