


Gold bulls seem to be perpetually rattling their sabres right now. The war cry is that gold has corrected enough and is now presenting an attractive buying opportunity. Ramped-up, excitable analysts are recommending dollar-cost averaging, while the familiar arguments about money printing, inflation and central bank buying are at the forefront of it all. But The Bradshaw Predictor Model (BPM) is telling me something very different. Gold is still expensive. Momentum remains negative. And a new secular bear market has been confirmed and is now well underway. It is precisely why, despite all the excitement, I’m staying firmly on the sidelines. Sometimes, the hardest investment decision is resisting the temptation to follow the crowd…
The 22% Warning
In January 2026, gold reached a 71% overvaluation – its highest since 1983 and a level reached just 6% of the time over the past 56 years. Since then, gold has fallen 31%, retreating from $5,600 to $3,875.
Yet here’s the vexatious part that so many investors appear to be overlooking: despite that correction, gold remains 22% overvalued. For context, gold’s 2008 peak overvaluation was just 25%. What followed? A 34% drawdown. A comparable decline from today’s price would take gold to $2,550.
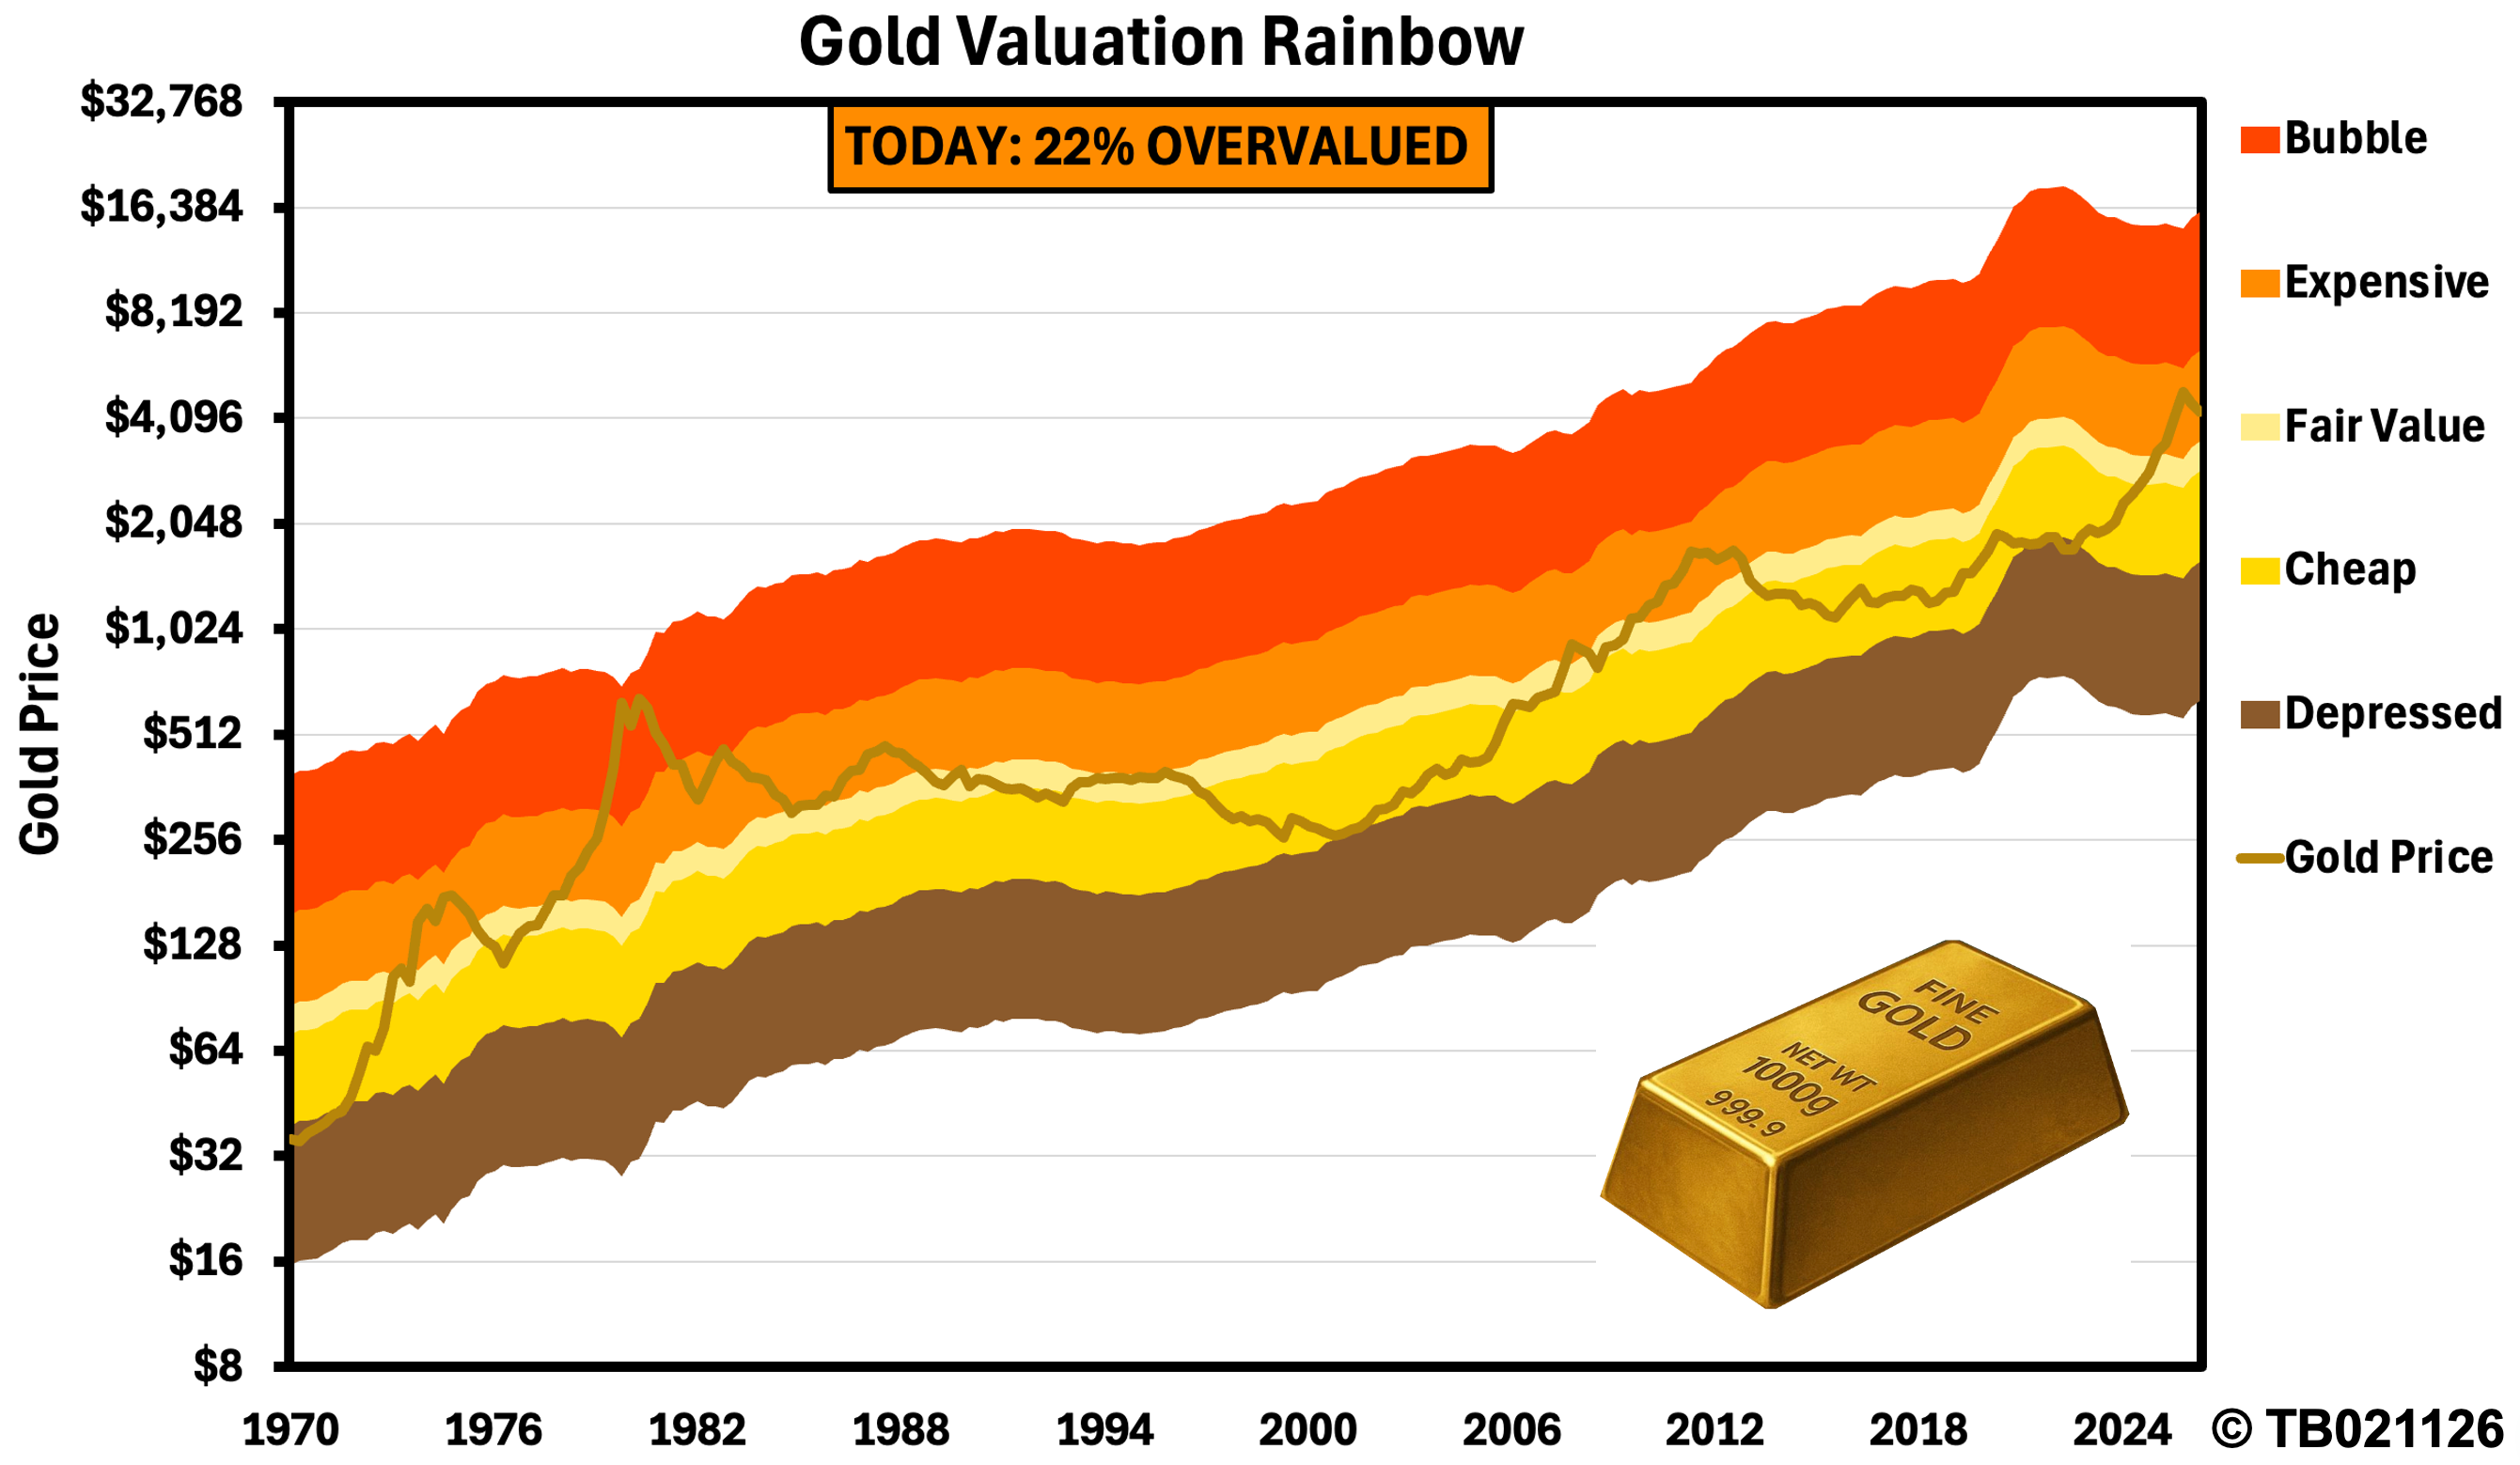
The correction so far has certainly been significant. But, whisper it, gold is still historically overpriced. A falling price doesn’t automatically make an expensive asset cheap.
Gold Price Forecast
Every new Gold analysis as it publishes, today's technical signal and key levels, live price — on one page.
See all Gold forecastsWhy Pay $700 Too Much?
My model estimates that gold’s fair value currently sits at $3,175. At $3,875, investors are effectively paying $700 more than my model suggests they should. I concede that fair value is an estimate, not a guaranteed destination. Markets can remain irrational for considerably longer than investors might expect.
But here’s my question: when did dollar-cost averaging into an already overvalued asset suddenly become a sensible investment strategy? Buying something simply because its price has fallen is not the same as buying something because it represents good value.
An Opportunity Or A Risk?
Between mid-2013 and early-2025, my model consistently classified gold as undervalued. For more than a decade, investors had an opportunity to accumulate the precious metal at what, in retrospect, were exceptionally attractive prices. Then something changed. Gold moved into overvalued territory in early-2025, eventually reaching a 71% overvaluation earlier this year.
Despite the subsequent correction, my model continues to signal that gold is expensive. For me, the opportunity to accumulate has given way to a compelling reason to exercise patience. The question is no longer whether gold deserves a place in an investment portfolio. It is whether today’s price offers sufficient compensation for the risks involved.
1974, 2011, 2026?
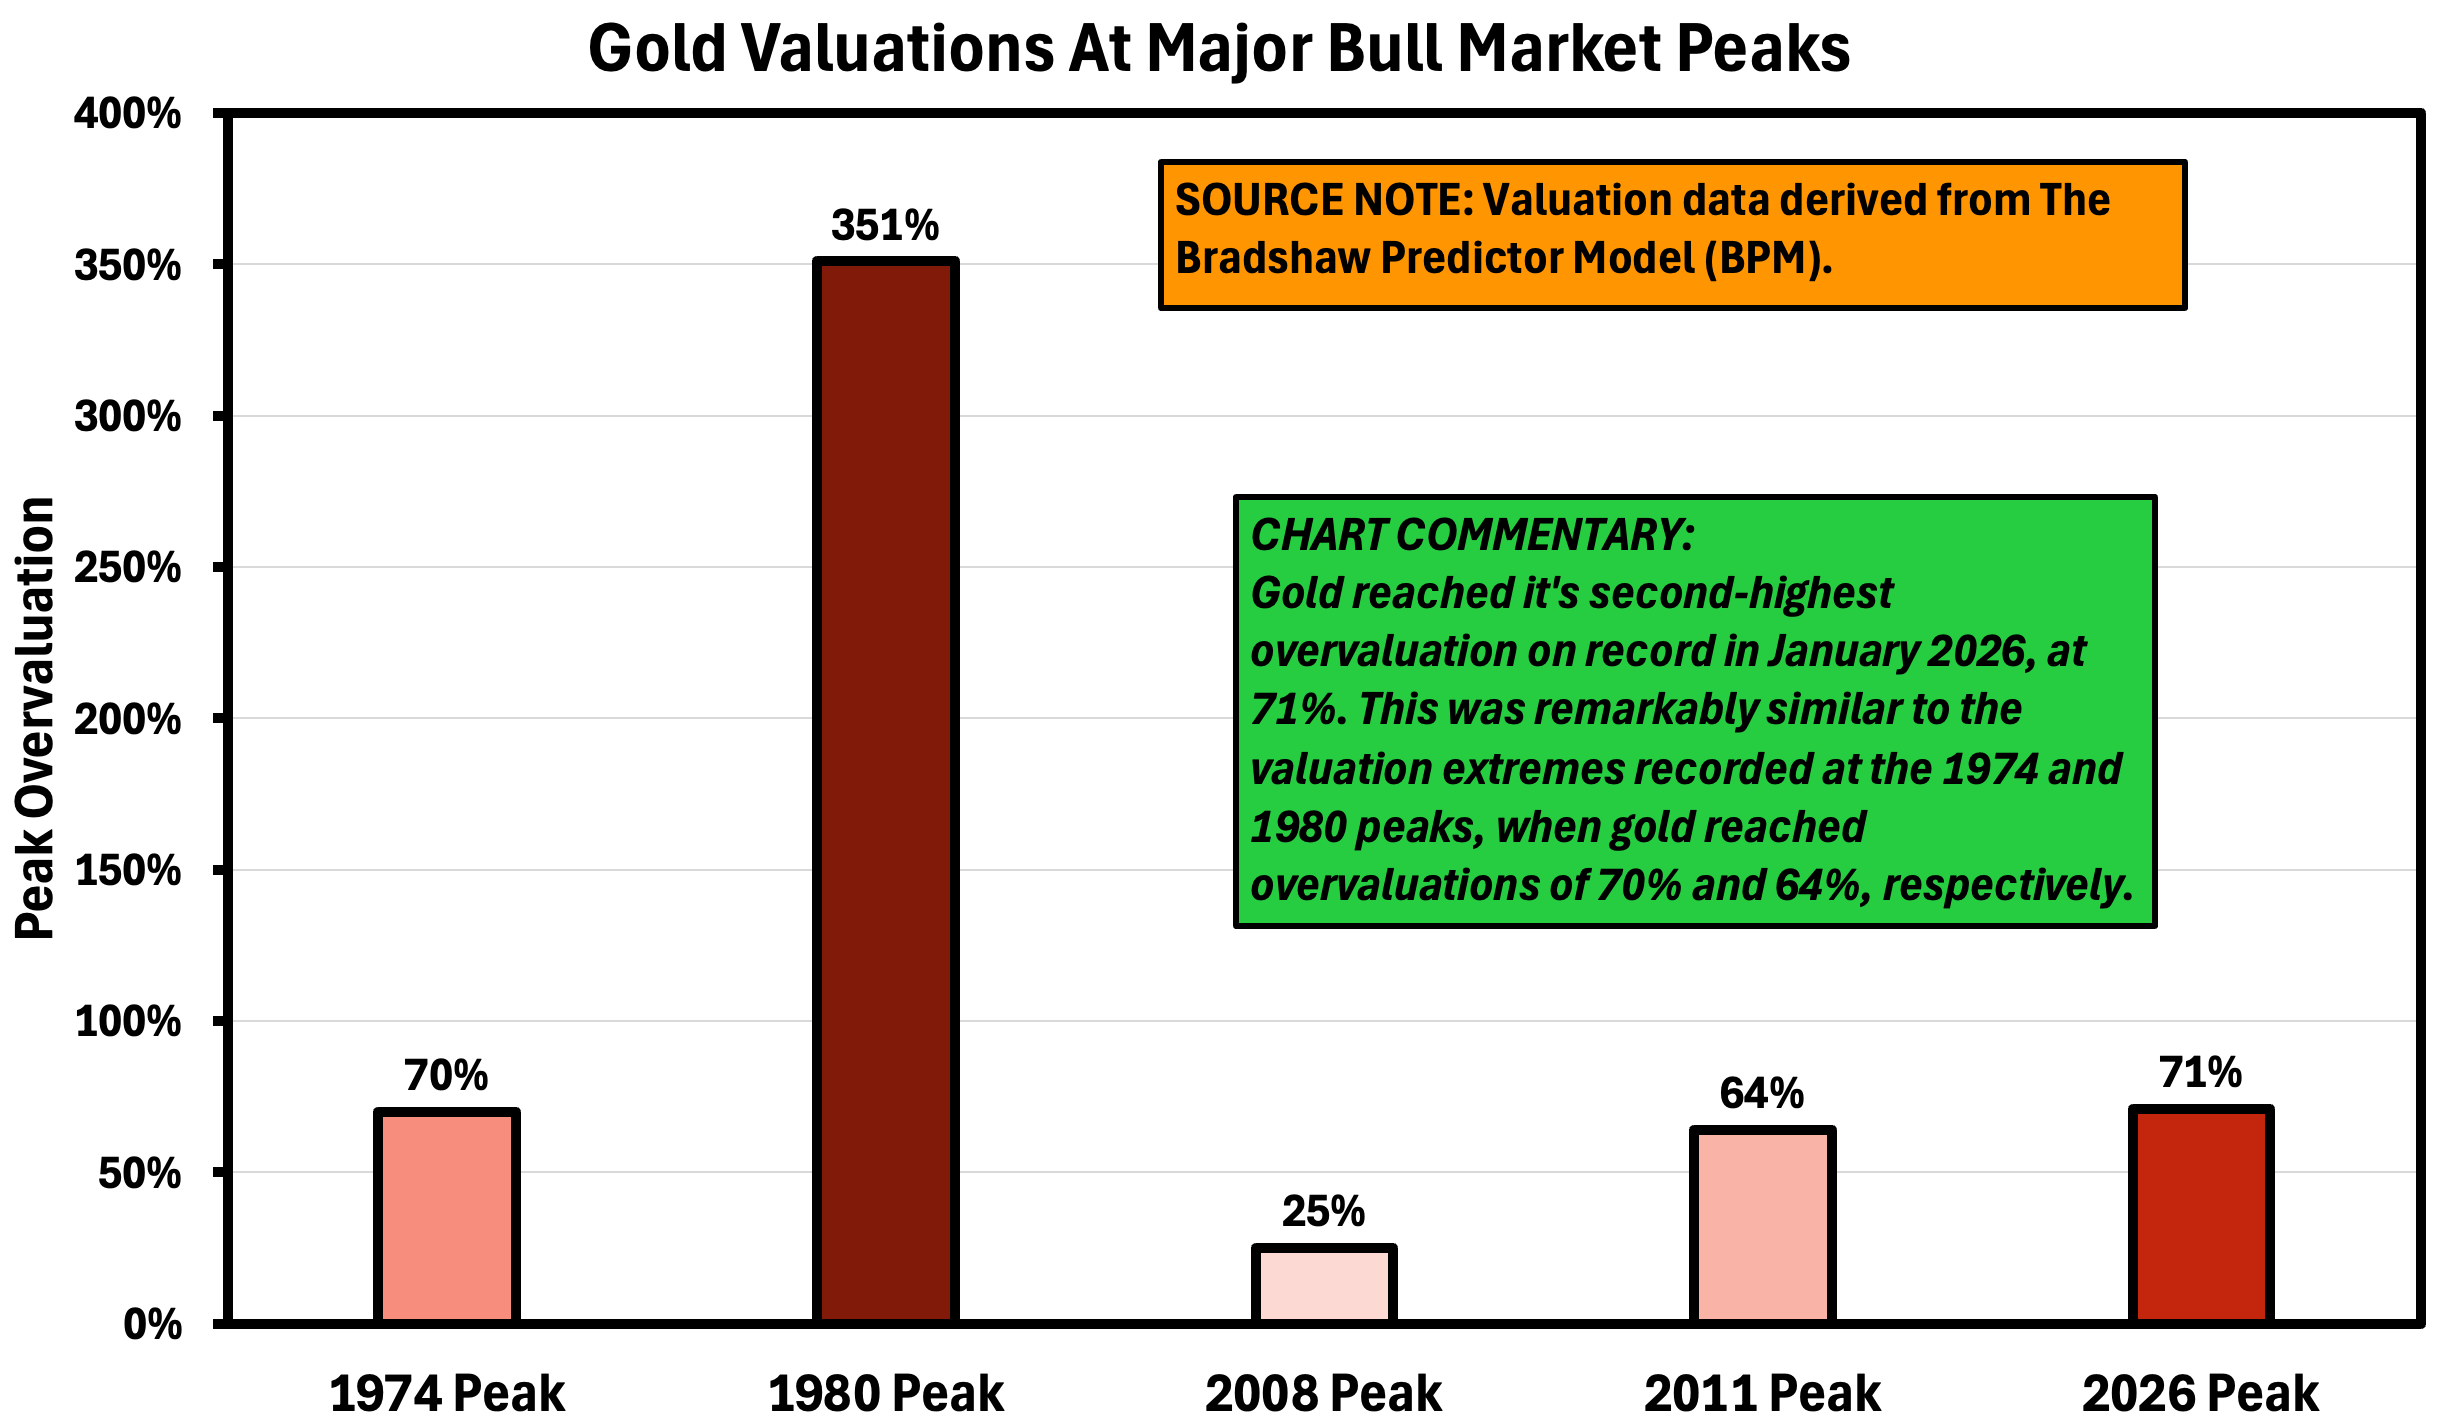
Gold’s major peaks in 1974 and 2011 coincided with overvaluations of 70% and 64%, respectively. January 2026 delivered an even higher reading of 71%.
Both historical peaks preceded substantial bear-market declines of 46-49%. A comparable decline from January’s $5,600 peak would take gold into the $2,850-$3,000 region. That is the territory where I would start looking for opportunities again.
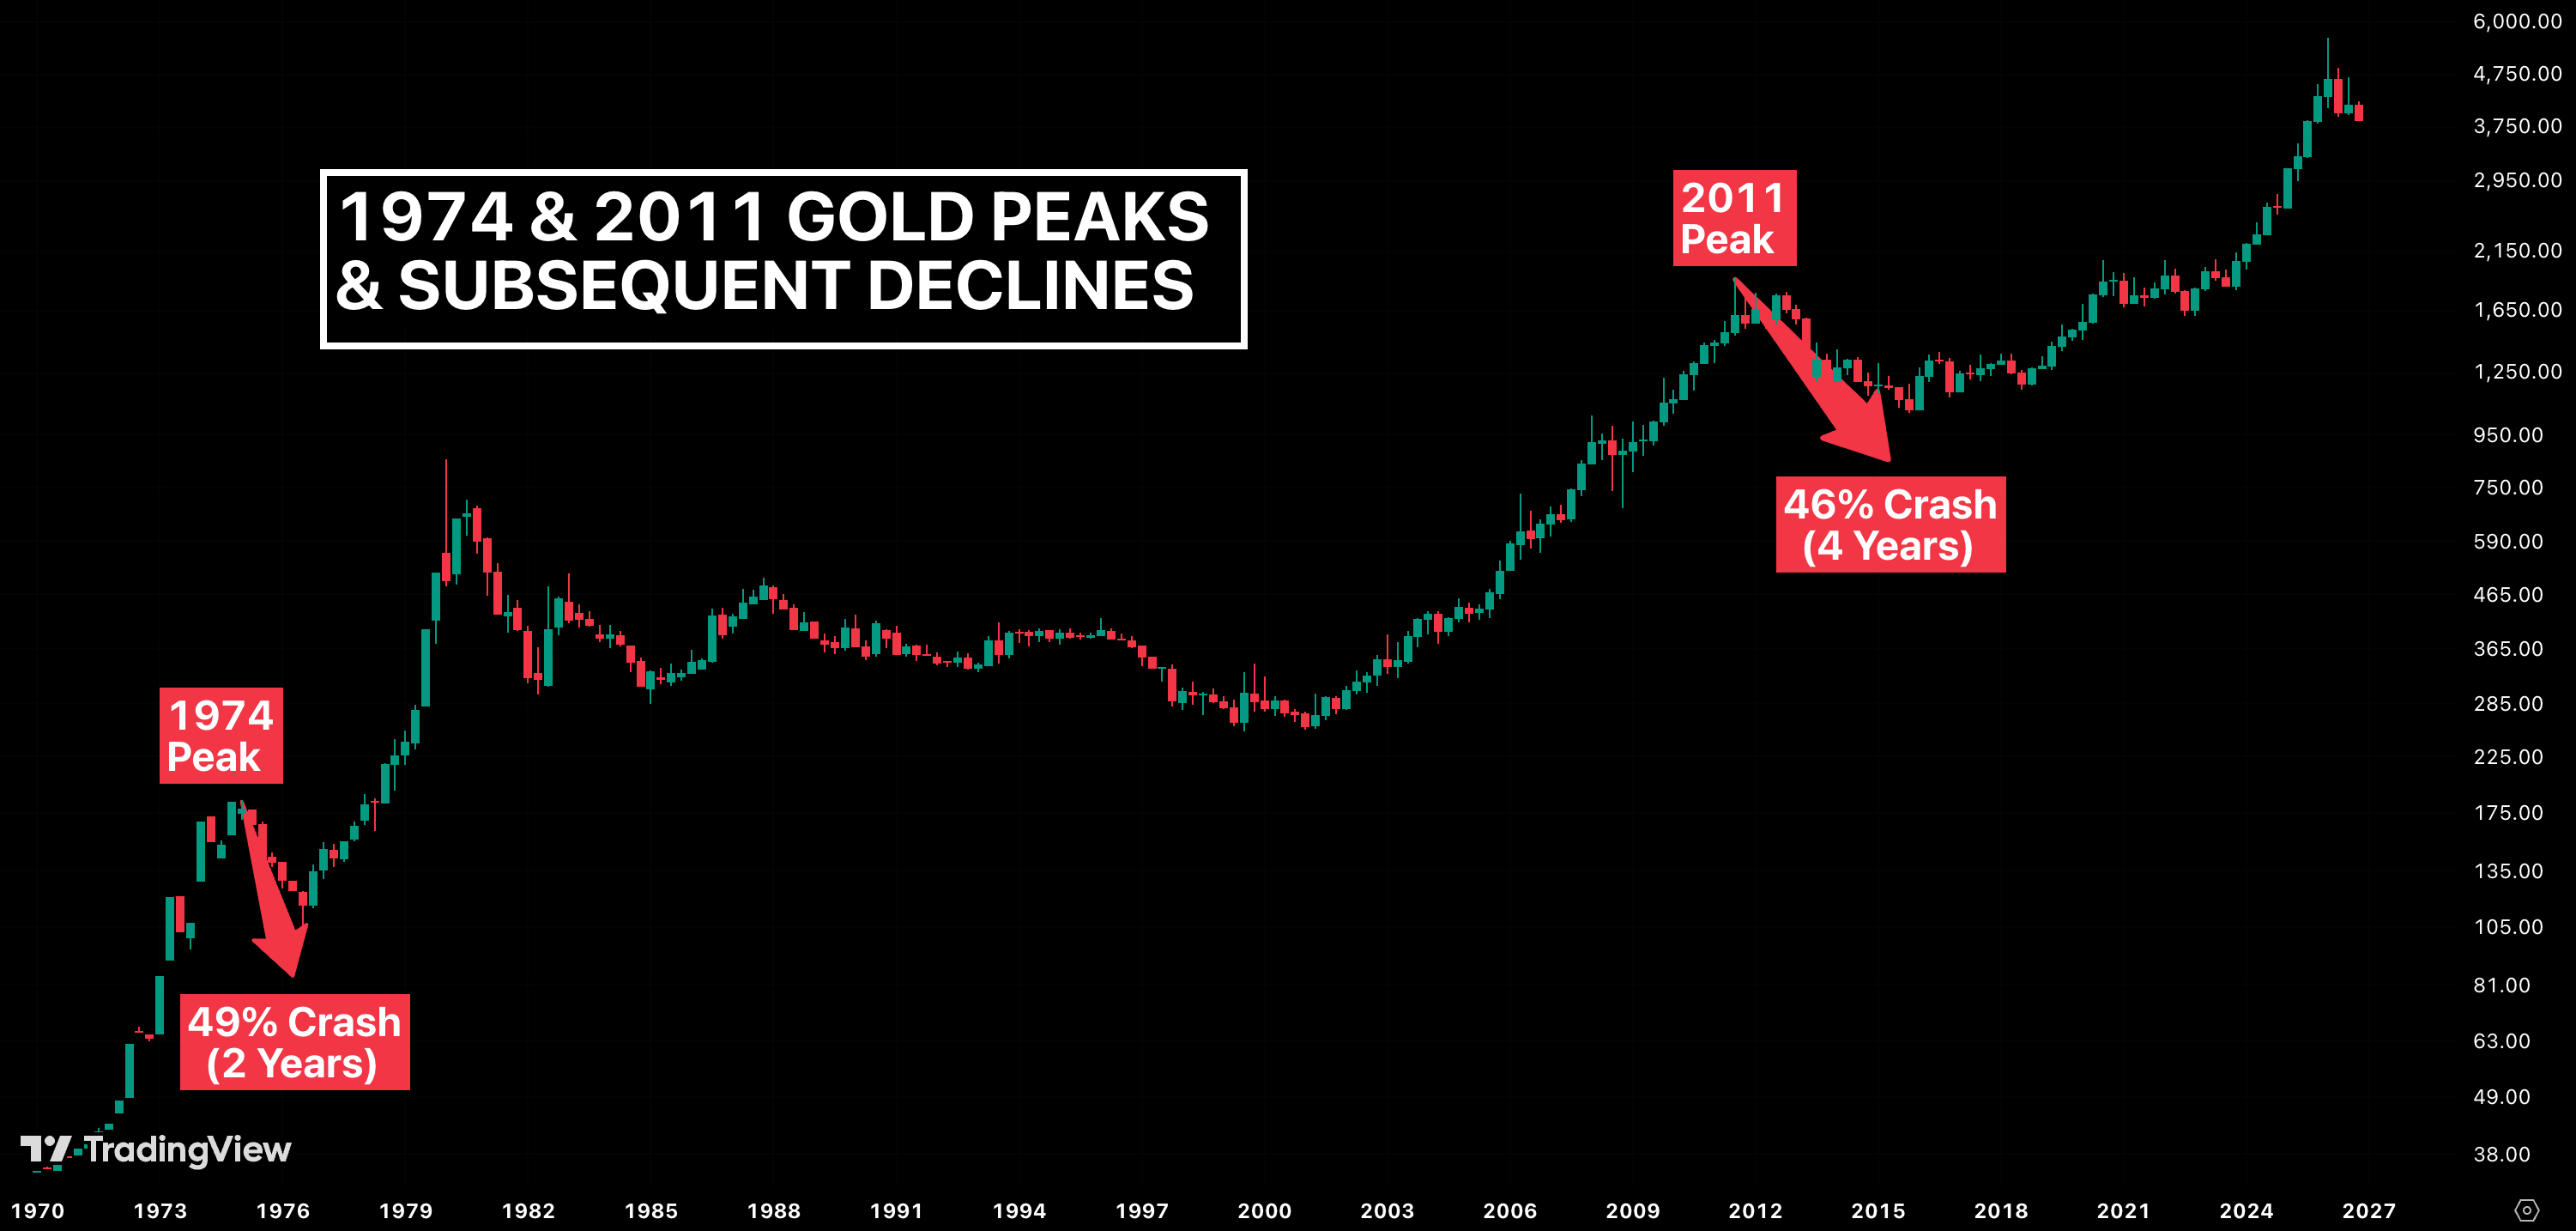
It’s simple for me. When, in the past, similar valuation extremes have preceded major declines, I would rather pay attention than dismiss the warning signs.
History reinforces the message. Gold’s major peaks in 1974, 1980 and 2011 coincided with expensive or bubble valuations. Conversely, its major troughs in 1970, 1976, 2001 and 2022 coincided with cheap or depressed valuations.
There is a recurring relationship between valuation extremes and major turning points in the gold market. It isn’t a crystal ball, nor does it guarantee a repeat cycle. But it does raise an important question: do we listen to what history is telling us, or simply discard it and charge heedlessly forward?
Bullish Fundamentals Don’t Justify Any Price
I can already hear the objections. Money printing. Government debt. Inflation. Central bank buying. De-dollarisation. All are legitimate arguments that could continue to support gold’s long-term prospects. But my model’s estimated fair value already reflects these underlying factors. They are incorporated into its framework. The question isn’t whether gold has bullish fundamentals. It’s whether those fundamentals justify paying $3,875 for an asset my model values at $3,175.
Consider this: back in 2023, my model also valued gold at $3,175. The difference? Gold was trading at just $1,925. The estimated fair value hasn’t changed. The market price has moved considerably.
And the narrative has changed, too. Gold is now attracting enormous attention, with retail investors seemingly falling over themselves to get exposure. That is precisely why valuation matters. Popularity doesn’t make an asset cheap, and a compelling investment narrative doesn’t justify paying any price.
My Strategy: Patience Over Popularity
My model currently tells me three things:
- Negative momentum.
- Significant overvaluation.
- A confirmed secular bear market.
I’m not claiming gold must fall below $3,000. Markets rarely move in straight lines, and there is no guarantee that my projected levels will be reached. I’m simply saying that the risk-reward at $3,875 doesn’t justify buying it. If my model subsequently identifies a buying opportunity – with valuation, momentum and market conditions aligning – I may consider re-entering the market.
Until then, I’m perfectly happy to wait. Sure, I may miss part of a recovery rally. But that’s a whole lot better than losing substantial amounts of capital by buying an overpriced asset that subsequently goes into free-fall. There is no prize for being fully invested at all times. Sometimes, doing nothing is the most sensible investment decision one can make.
A Hypothetical Bearish Trading Strategy
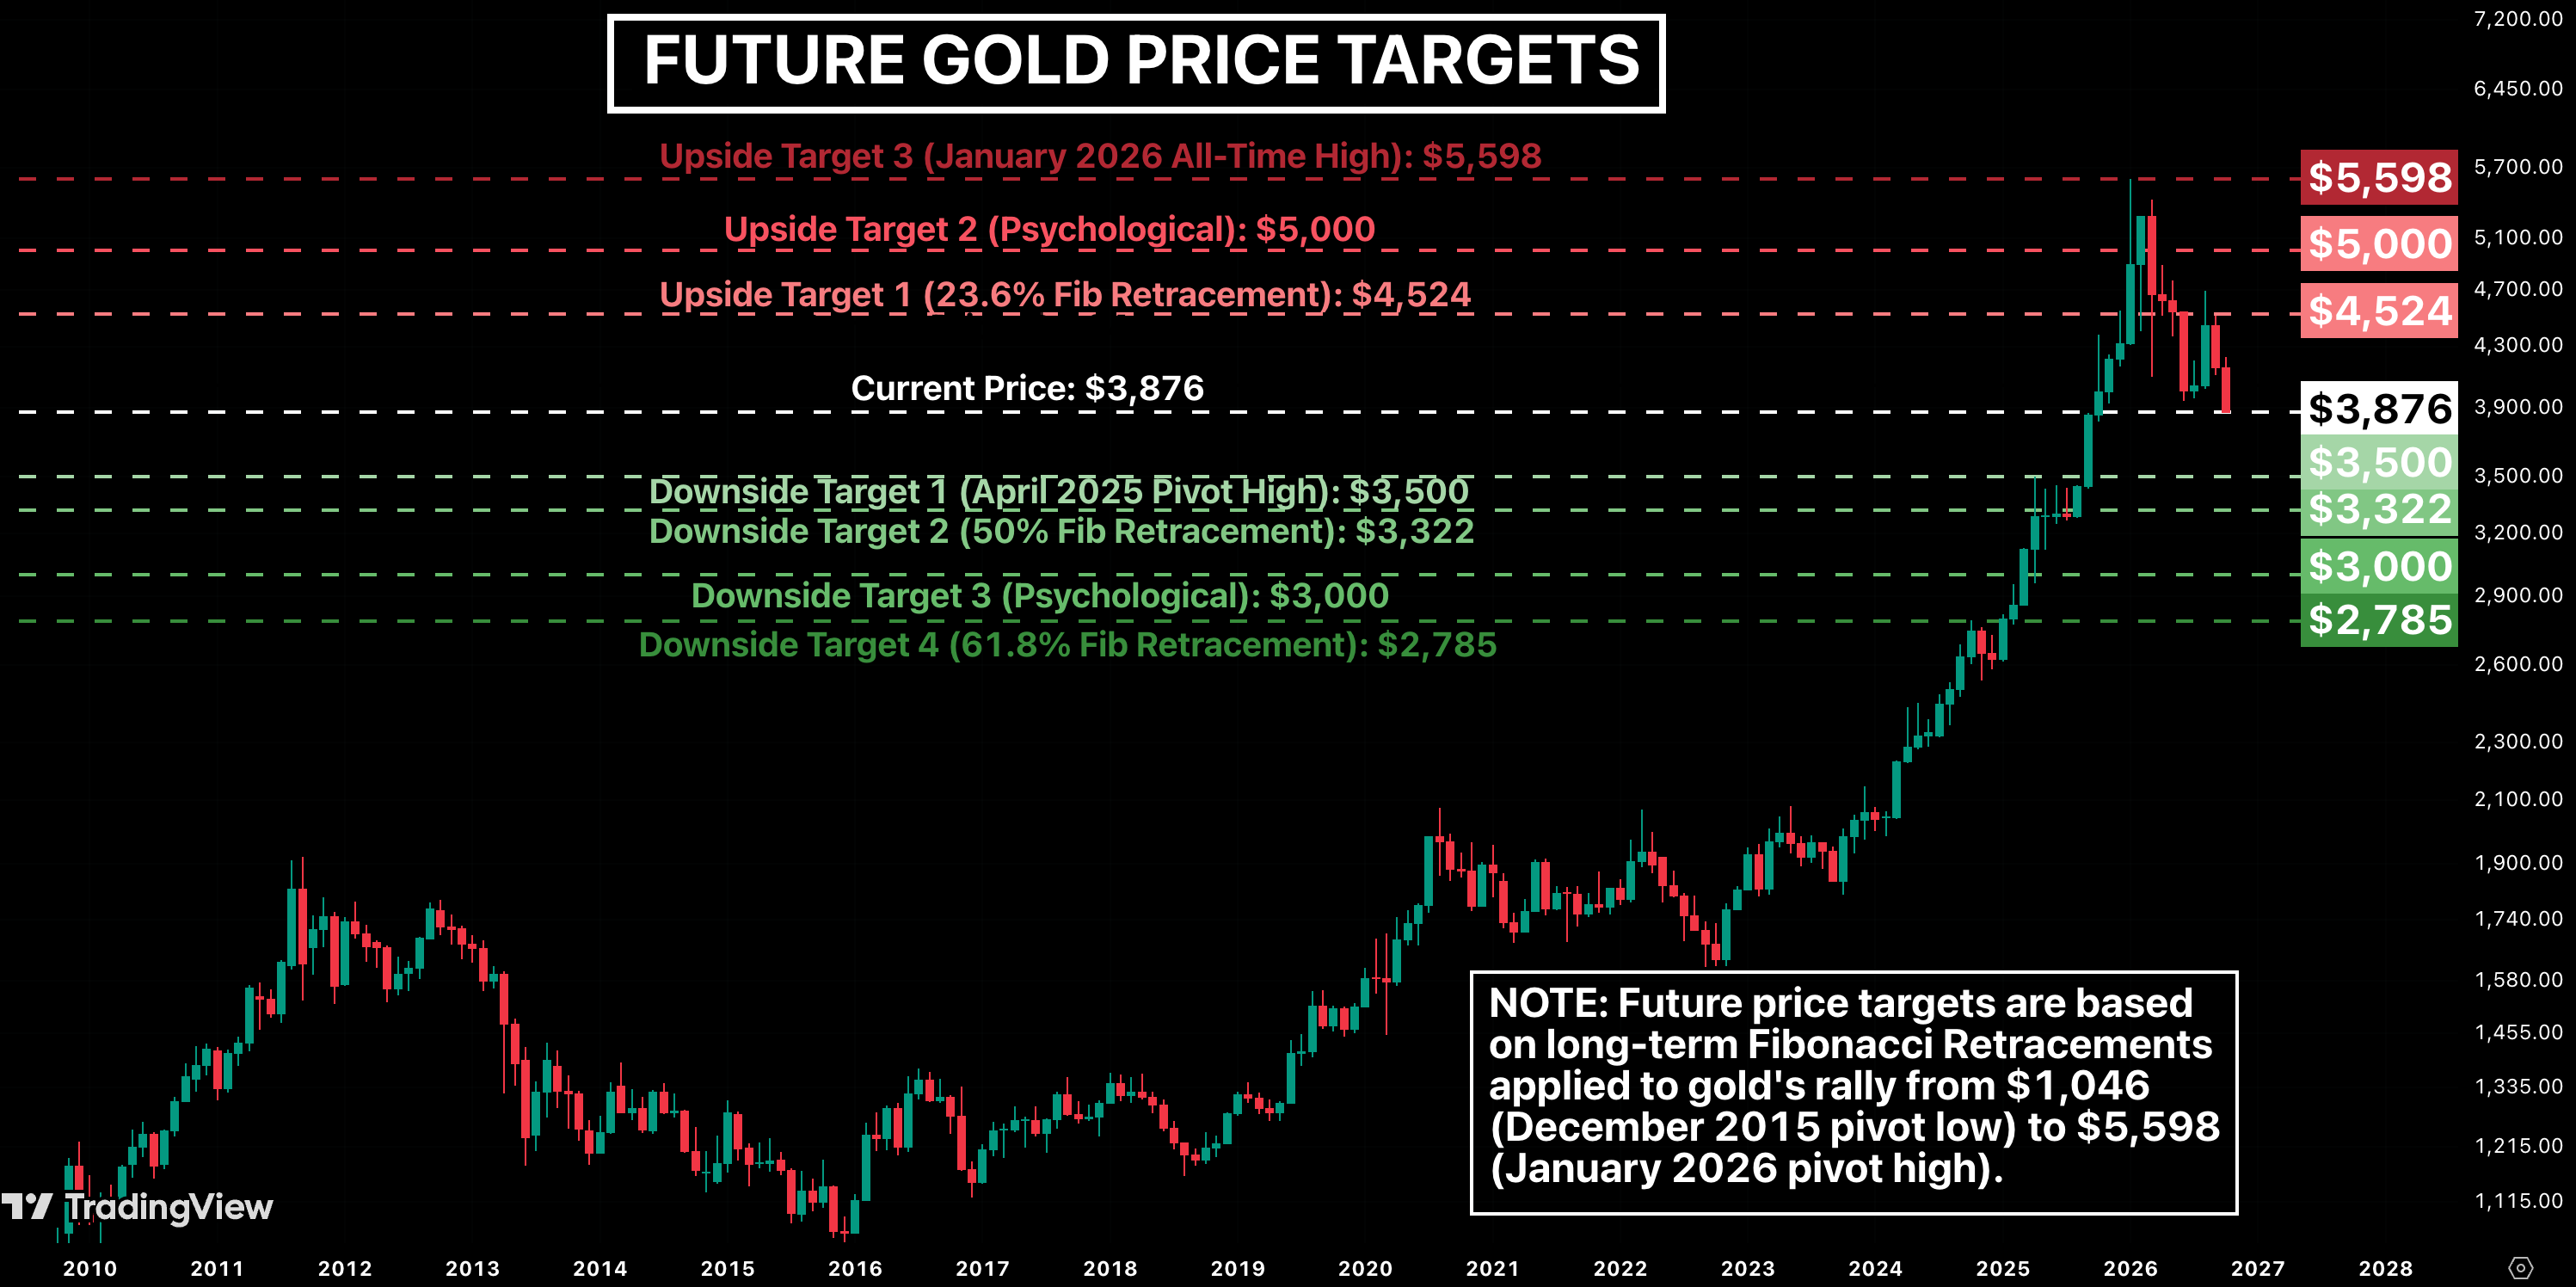
The next question is how to structure a potential short position while managing the risk of another spectacular rally. One approach could be to scale into a short position rather than commit the entire allocation immediately. A hypothetical framework could involve three entries, each representing one-third of the intended position:
- $3,876: Establishing the initial short position.
- $4,524: Adding another third at the 23.6% Fibonacci retracement.
- $5,000: Adding the final third at this psychologically significant level.
Assuming equal position sizes, this produces an average entry price of $4,467.
Managing The Risk
A proposed exit level would be gold’s previous all-time high of $5,598. A break above this level would invalidate the bearish thesis and trigger an exit from the entire position. At that price, the hypothetical loss would be 25.3%. By comparison, committing the entire position at $3,876 would produce a 44.4% loss. Scaling into the position therefore reduces the potential loss by approximately 19.1%, although it certainly doesn’t eliminate the risk.
Taking Profits
On the downside, the position could be progressively reduced at four predetermined levels:
- $3,500: Closing 25% of the original position (April 2025 pivot high).
- $3,322: Closing another 25% (50% Fibonacci retracement).
- $3,000: Closing another 25% (psychologically significant milestone).
- $2,785: Closing the remaining 25% (61.8% Fibonacci retracement).
If gold first rallied to $5,000 before declining to $2,785, the average closing price would be $3,152. Against the average entry of $4,467, this represents a hypothetical gross profit of 29.5%.
The Risk/Reward
The resulting framework offers:
- Potential maximum loss: 25.3%.
- Potential gross profit: 29.5%.
- Indicative reward-to-risk ratio: 1.16:1.
Importantly, this is my hypothetical trading framework, not a prediction that gold must reach $2,785 or a recommendation to short the market. For now, my own position remains unchanged: I would rather wait for valuation, momentum and market conditions to align before committing capital.
One Final Thought
Are we buying gold because the price makes sense, or because we’ve been swept along by the current tide of optimism? Four years ago, my ‘buy gold’ reports largely fell on deaf ears. I implored people to take my analysis seriously and consider investing. I confess I became hugely frustrated with the sceptics who scoffed, chortled and dismissed my views. Now that I’ve become a doubting Thomas – now that I believe gold simply isn’t the investment it once was – it seems I’m destined for more of the same.
Perhaps that’s the price you pay for having an independent view. But I’d rather be unpopular for questioning an expensive market than popular for encouraging people to buy into one. Valuation matters. Momentum matters. And sometimes, the best investment decision is knowing when step aside.