



Key Insights
- Gold prices dip amid dollar strength and Fed rate cut uncertainties.
- Spot gold and futures both decline 0.3%, reflecting market caution.
- Copper prices fall, influenced by weak Chinese data and a stronger dollar.
- Investors await Fed’s December minutes and nonfarm payrolls for direction.
- Bearish trends observed in gold and copper, with silver also showing weakness.
Despite a strong rally in December 2023, fueled by expectations of early rate cuts, gold eased off, with spot gold and futures both experiencing a 0.3% drop. Investors are awaiting the Fed’s December meeting minutes and upcoming nonfarm payrolls data for further cues.
Copper prices also fell, affected by weak Chinese economic data and a stronger dollar, distancing from a recent five-month high.
Gold Prices Forecast
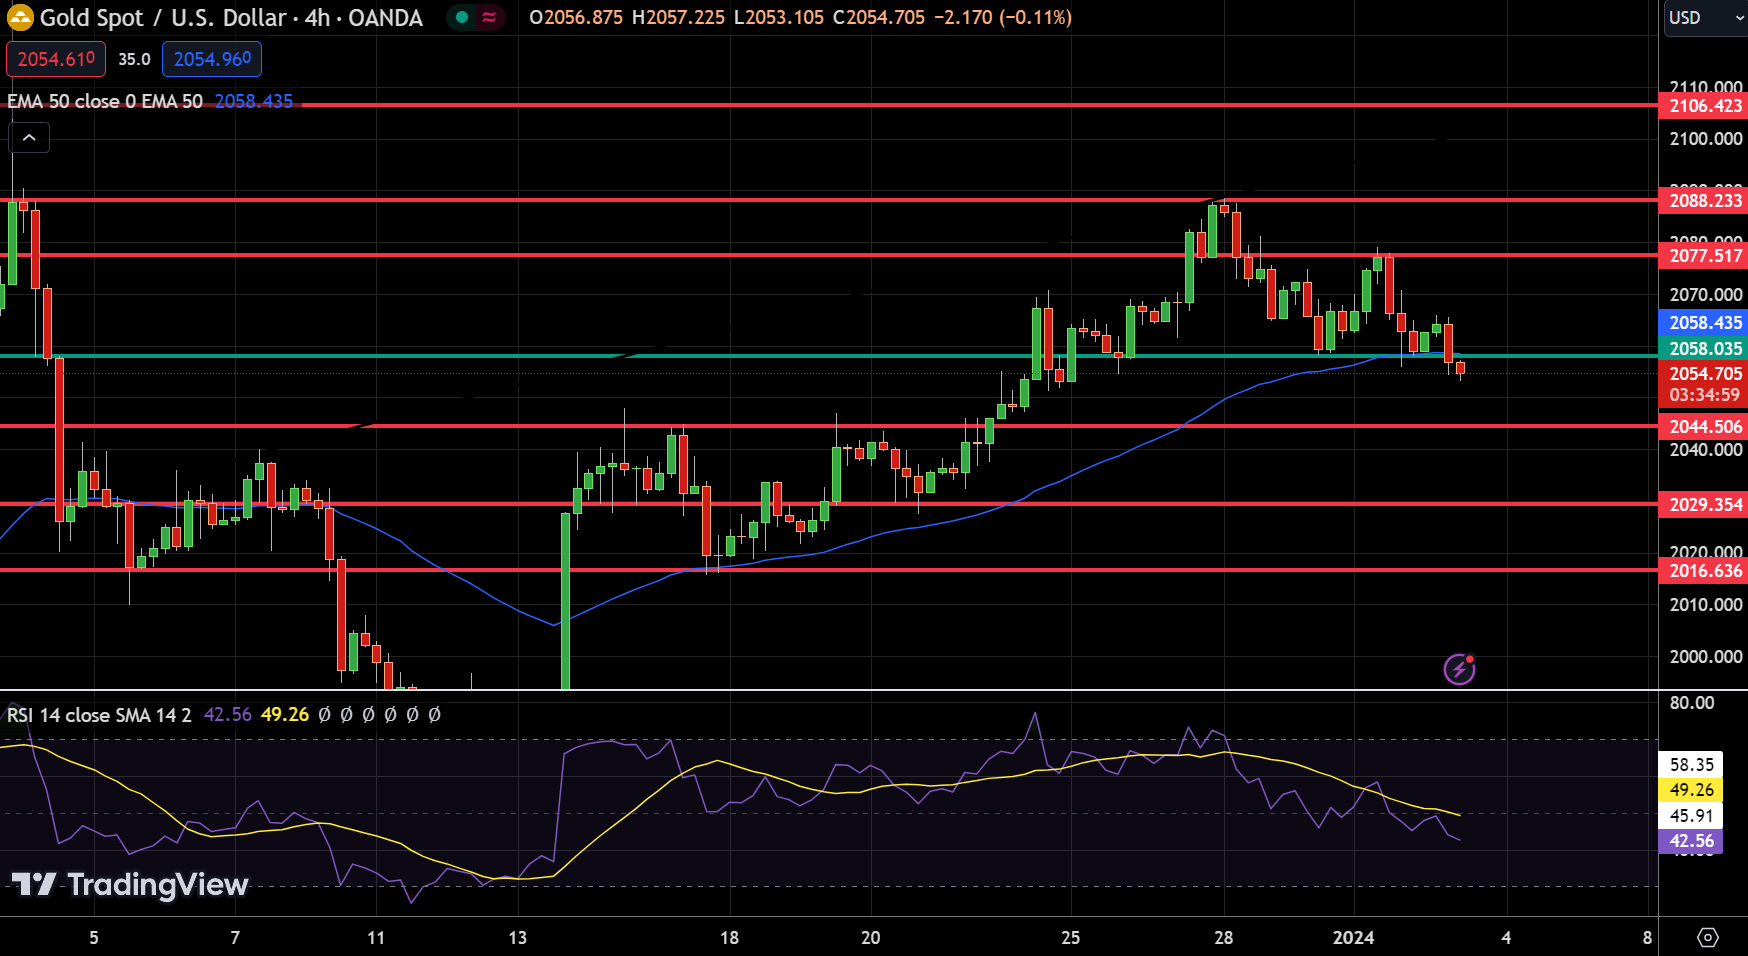
On January 3rd, Gold’s market performance presents a bearish outlook as it trades at $2,054, down 0.2%. Key technical indicators provide insights into its future movement. The pivot point stands at $2,058, with immediate resistance levels at $2,077, $2,088, and $2,106.
Silver Prices Forecast
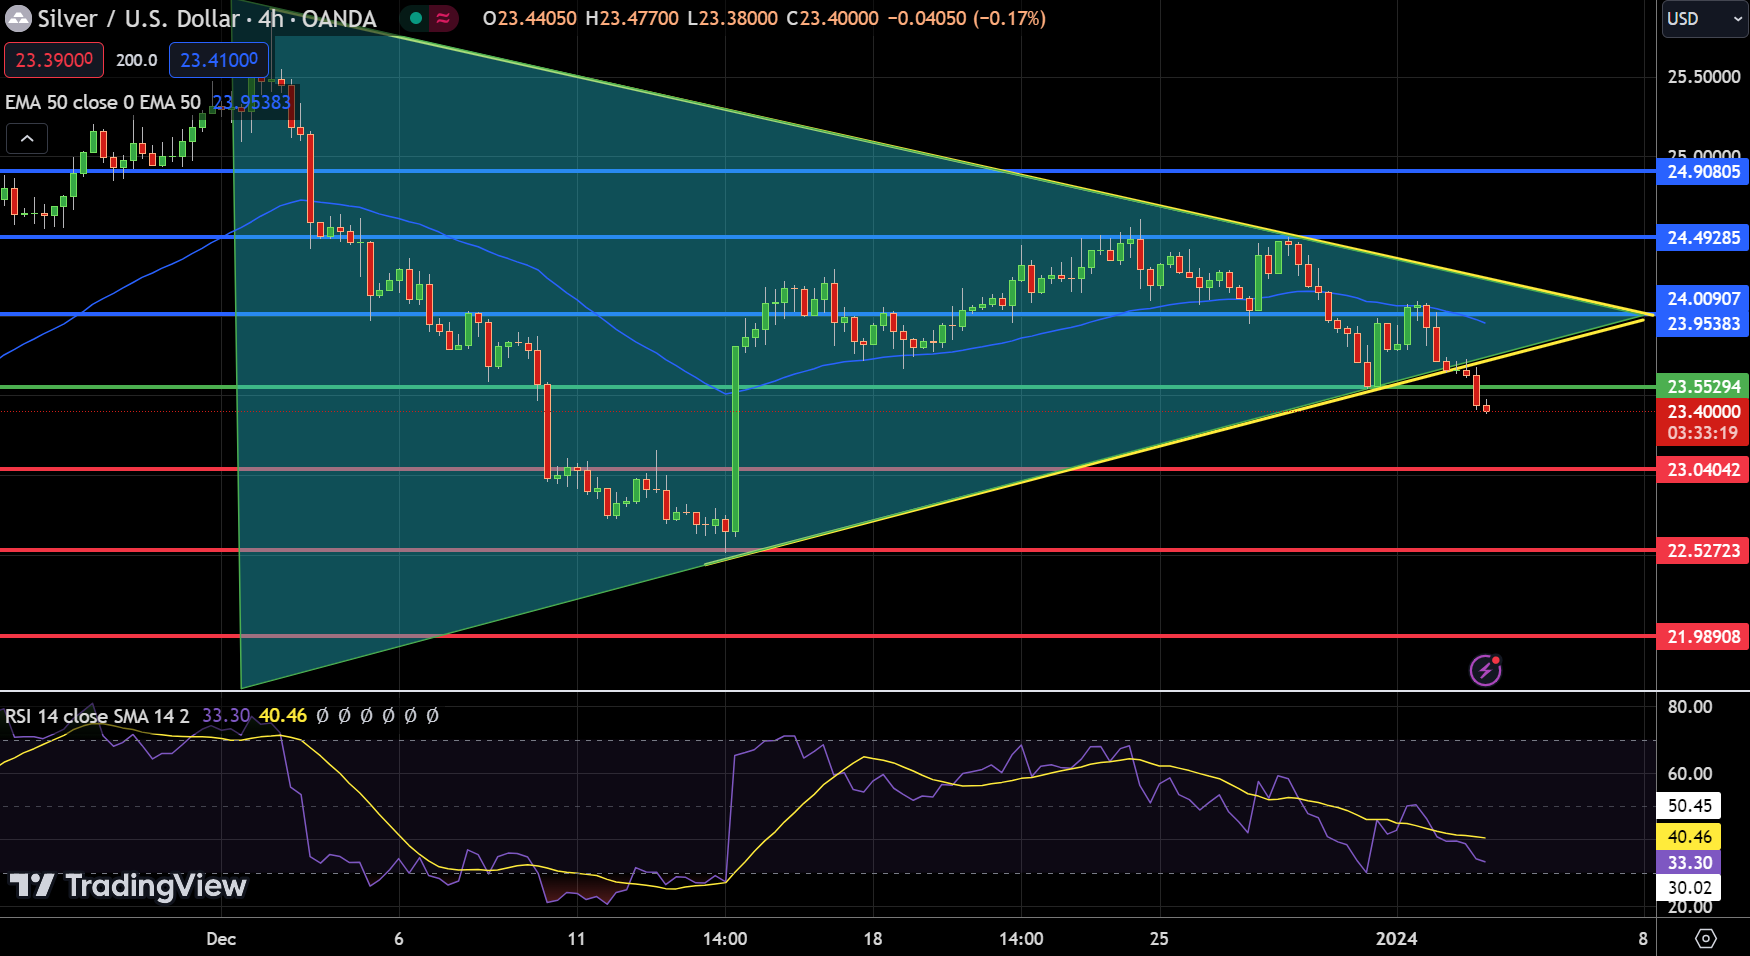
Silver’s technical analysis on January 3rd shows a bearish trend as the price stands at $23.4, marking a 0.96% decrease. The pivot point for Silver is $23.55, with key resistance levels at $24.01, $24.49, and $24.91.
On the downside, support levels are identified at $23.04, $22.53, and $21.99. The Relative Strength Index (RSI) at 33 suggests bearish momentum, nearing oversold conditions. The Moving Average Convergence Divergence (MACD) is at -0.04, with the signal line at -0.16, indicating possible bearish trends. Silver is currently trading below its 50-Day Exponential Moving Average (EMA) of $23.95.
A symmetrical triangle breakout at $23.50 supports a bearish outlook, suggesting potential selling pressure. The overall short-term forecast for Silver remains bearish, particularly below the $23.50 level.
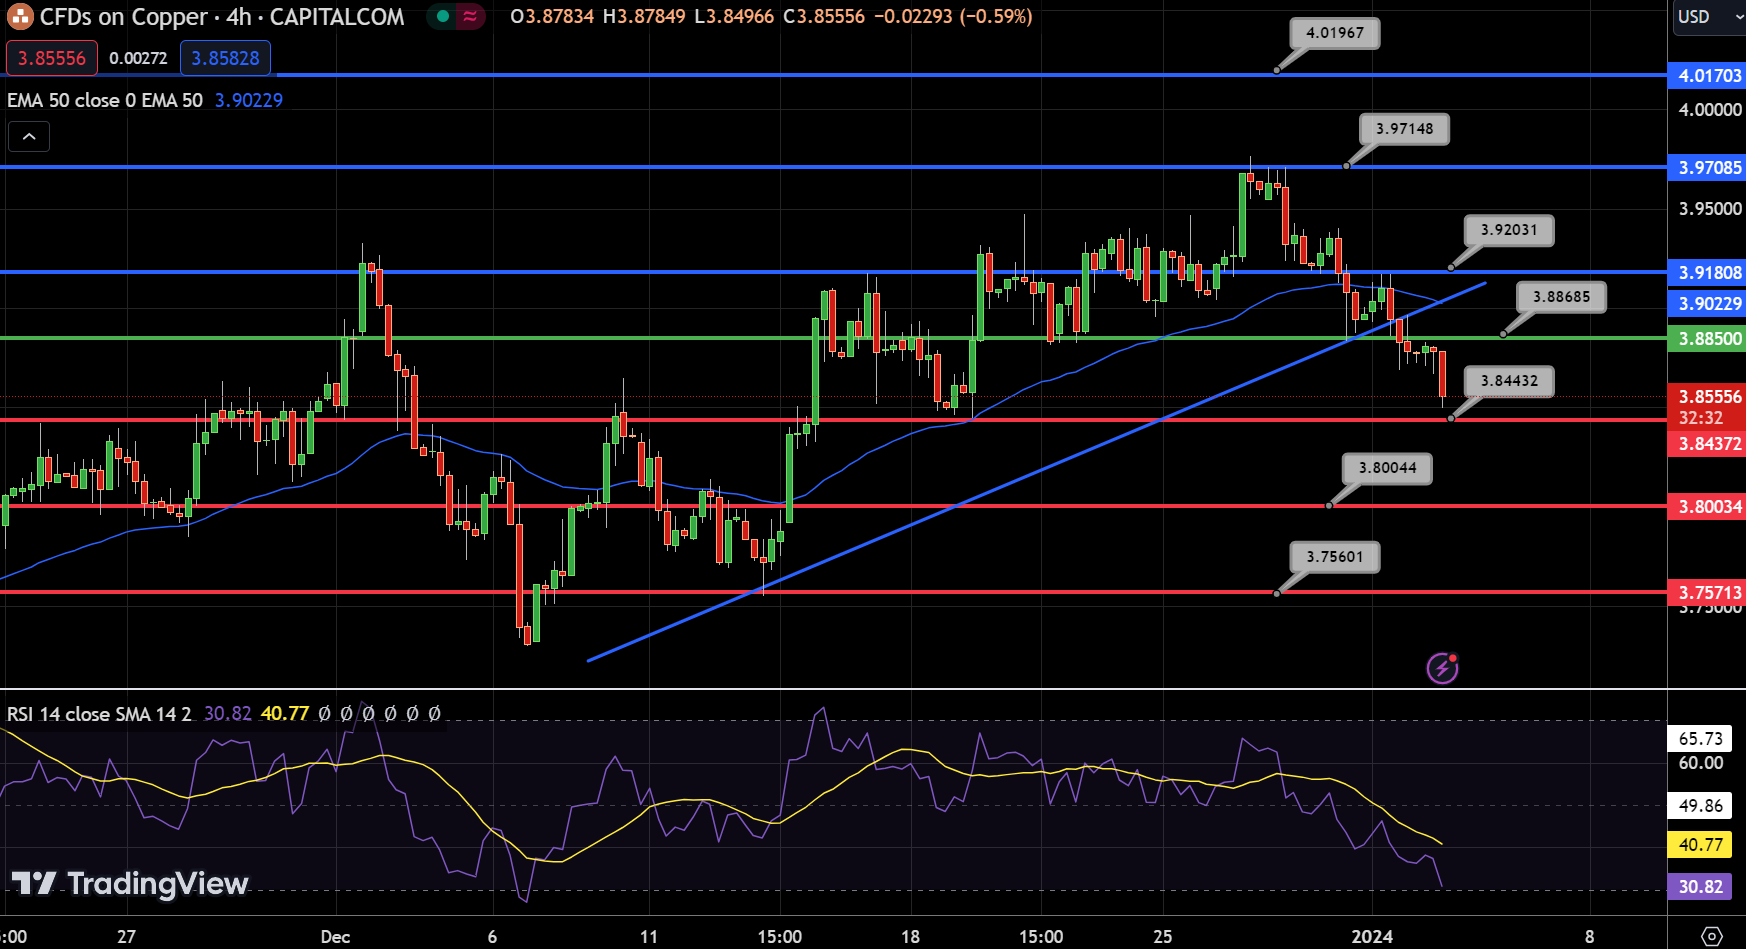
Copper’s technical outlook on January 3rd indicates a bearish trend as it trades at $3.85, down by 0.49%. The pivot point is set at $3.89, with resistance levels at $3.92, $3.97, and $4.02. Conversely, support is found at $3.84, $3.80, and $3.76.
The Relative Strength Index (RSI) at 30 suggests that Copper is nearing oversold territory, while the Moving Average Convergence Divergence (MACD) at -0.0053 signals a potential downward trend. Notably, Copper is trading below its 50-Day Exponential Moving Average (EMA) of $3.90, reinforcing the bearish sentiment.
The chart shows an upward trendline breakout at $3.88 and a bearish engulfing candle pattern, both supporting a downtrend. Consequently, the short-term forecast for Copper is bearish, particularly if it remains below the $3.90 level.
For a look at all of today’s economic events, check out our economic calendar.