



Key Insights
- Metals face a downturn in European markets despite Fed’s rate cut hesitations.
- Market focus shifts towards potential May rate cut, pending economic indicators like ISM Manufacturing PMI and Nonfarm Payrolls, which could influence Fed’s stance.
- Technical analysis for gold shows a bearish trend below pivot point, with resistance and support levels indicating a cautious outlook; copper remains bullish above pivot.
In Thursday’s European trading session, gold and silver prices dipped, reflecting a broader bearish trend in the metals market. This downturn came despite dovish Fed, as the Federal Reserve’s (Fed) expressed hesitance to cut rate in March.
Fed Chair Jerome Powell’s skepticism towards early rate cuts, emphasizing the uncertainty over inflation consistently meeting the 2% target, has tempered expectations for immediate monetary easing.
Instead, market focus has shifted towards the possibility of a rate cut in May, contingent on forthcoming economic data.
Key indicators, such as January’s ISM Manufacturing PMI and Nonfarm Payrolls (NFP), are awaited, with stronger-than-expected employment and wage growth potentially diminishing prospects for a May rate cut.
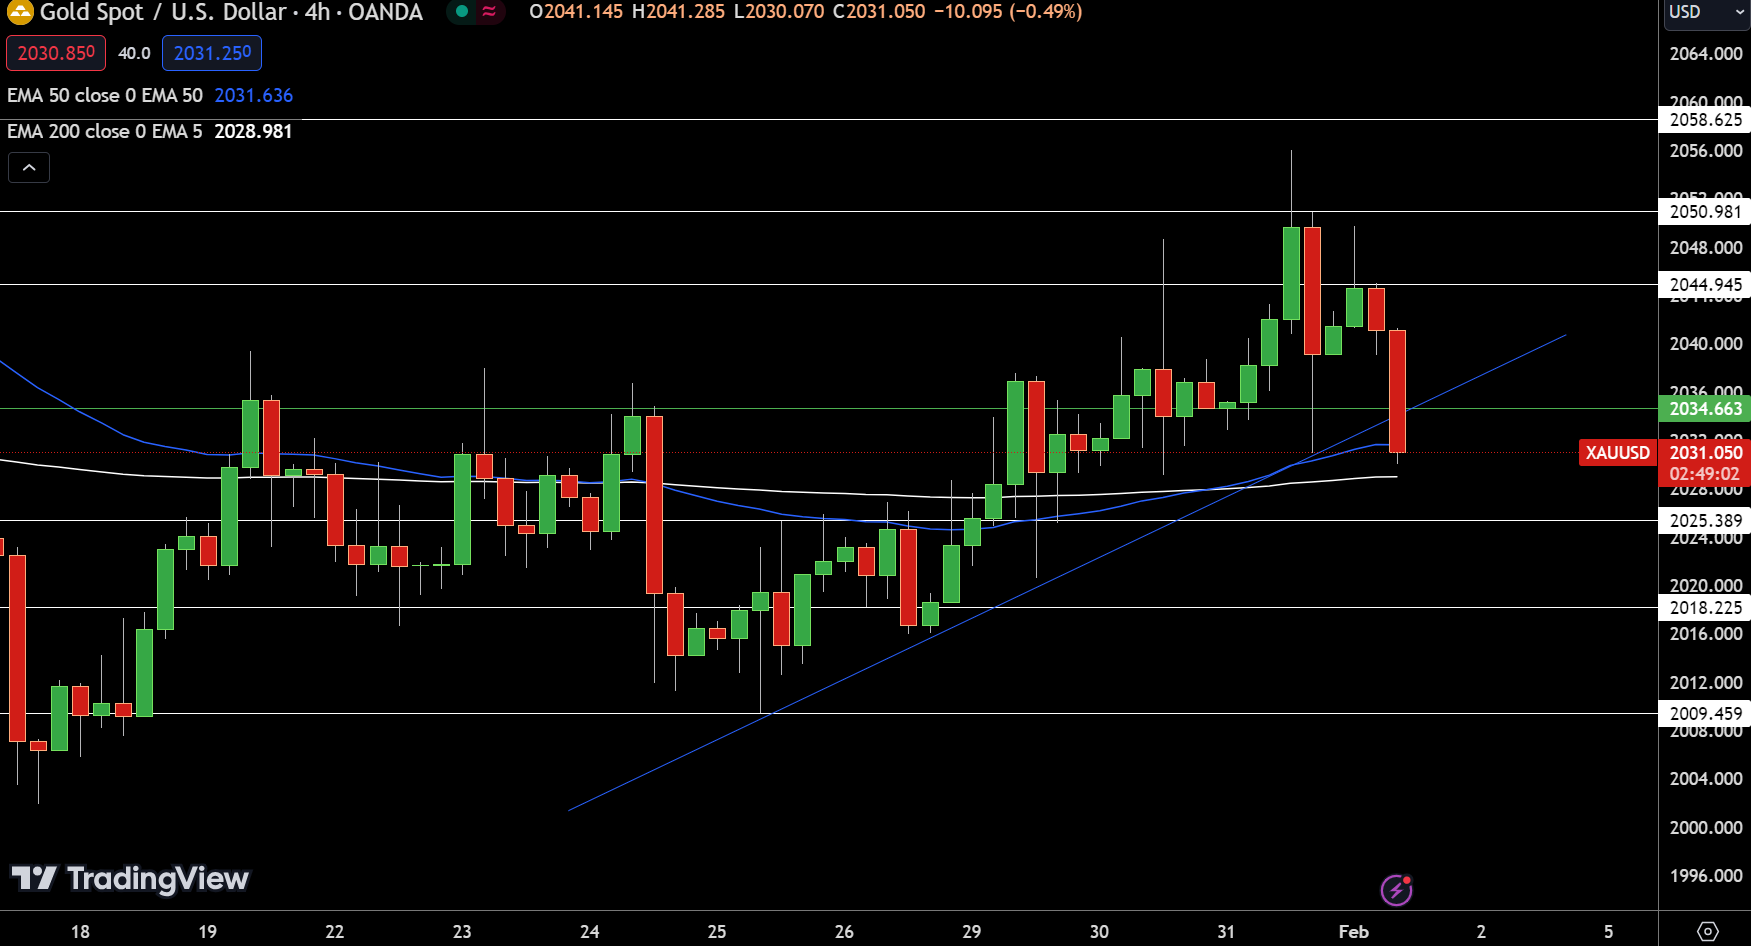
In today’s market, Gold sees a slight decline, trading at $2031.05, marking a 0.36% decrease. The pivot point, a crucial indicator for traders, is set at $2034.663, serving as a baseline for resistance and support levels. Immediate resistance is observed at $2044.945, with subsequent levels at $2050.981 and $2058.625, indicating potential upside barriers.
Conversely, support levels below the pivot point begin at $2025.389, followed by $2018.225 and $2009.459, outlining key zones where buying interest might materialize. The 50-day Exponential Moving Average (EMA) at $2031.636 and the 200-day EMA at $2028.981 suggest a tight trading range, hinting at a cautious market sentiment.
Given the current dynamics, the overall trend leans bearish below the pivot point of $2034.663, highlighting a critical juncture for future price direction.
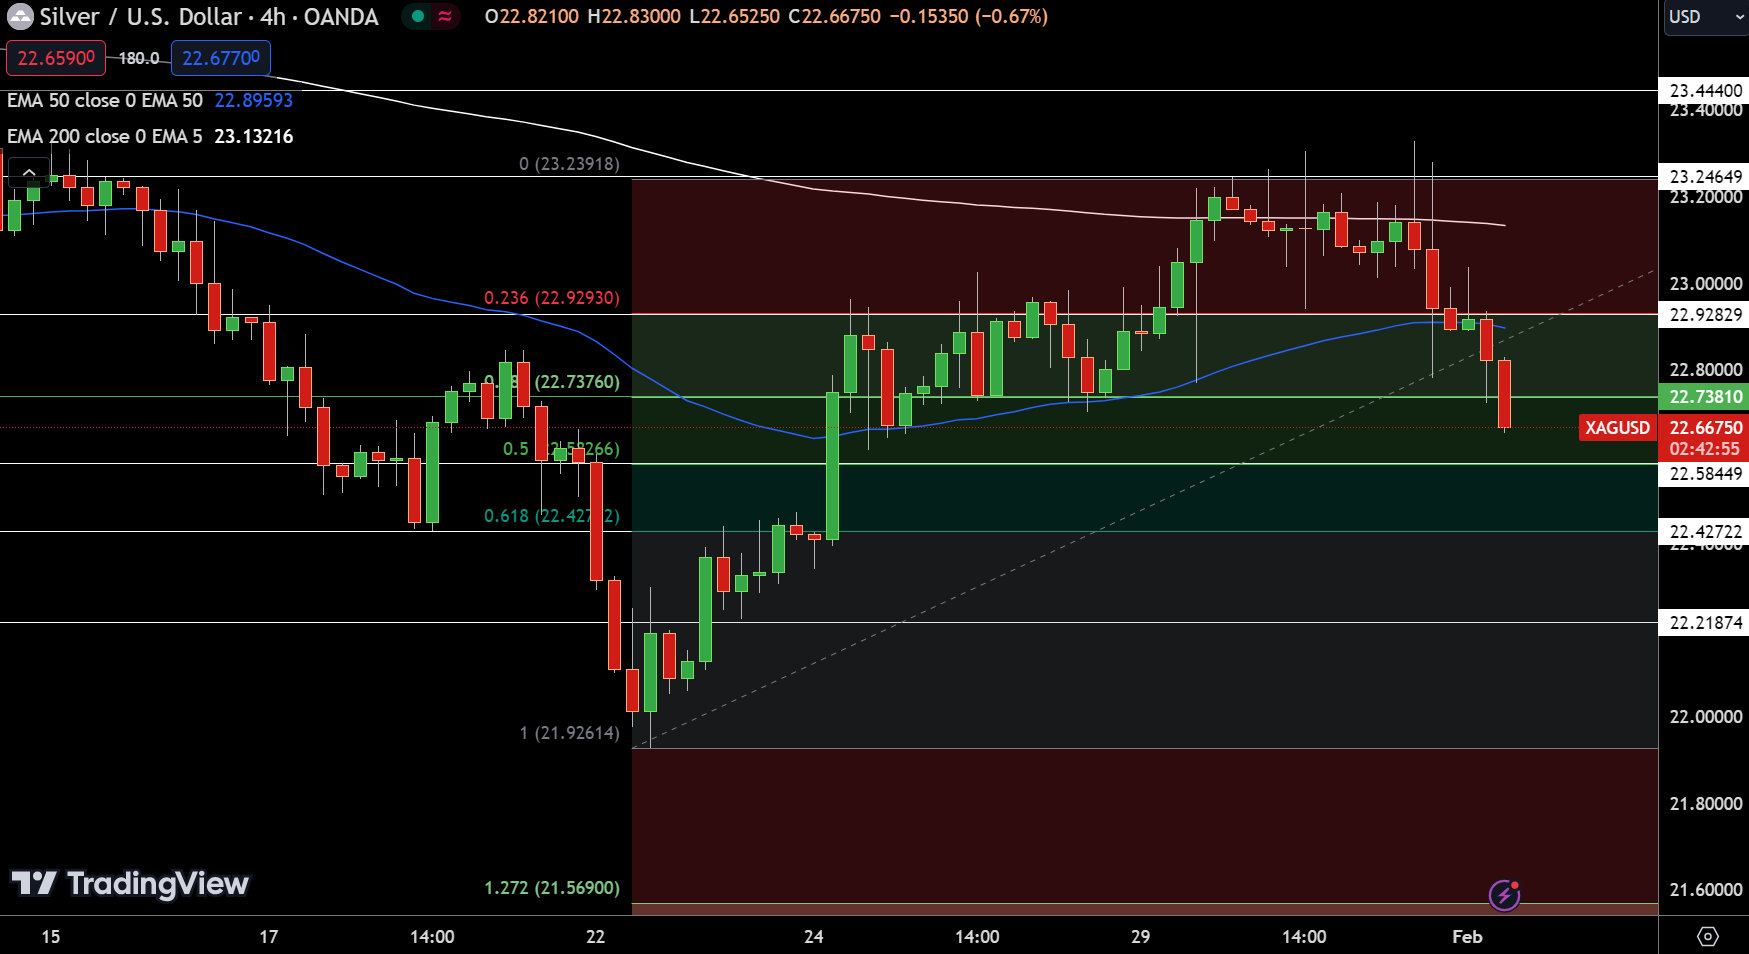
Silver‘s trading dynamics on February 1st reveal a downward adjustment, with the current price at $22.66750, a 1.18% decrease. The pivot point, positioned at $22.73810, acts as the fulcrum for today’s technical analysis, delineating the boundary between bullish and bearish sentiment. Resistance levels are mapped out at $22.92829, $23.24649, and $23.44400, suggesting ceilings that could cap upward movements.
On the descent, support levels are identified at $22.58449, $22.42722, and $22.21874, marking potential floors for price stabilization. With the 50-day Exponential Moving Average (EMA) at $22.89593 and the 200-day EMA at $23.13216, the market’s disposition appears cautious.
This technical setup indicates a bearish outlook below the pivot point of $22.73810, signaling a critical inflection point for future price trajectories.
Copper Prices Forecast
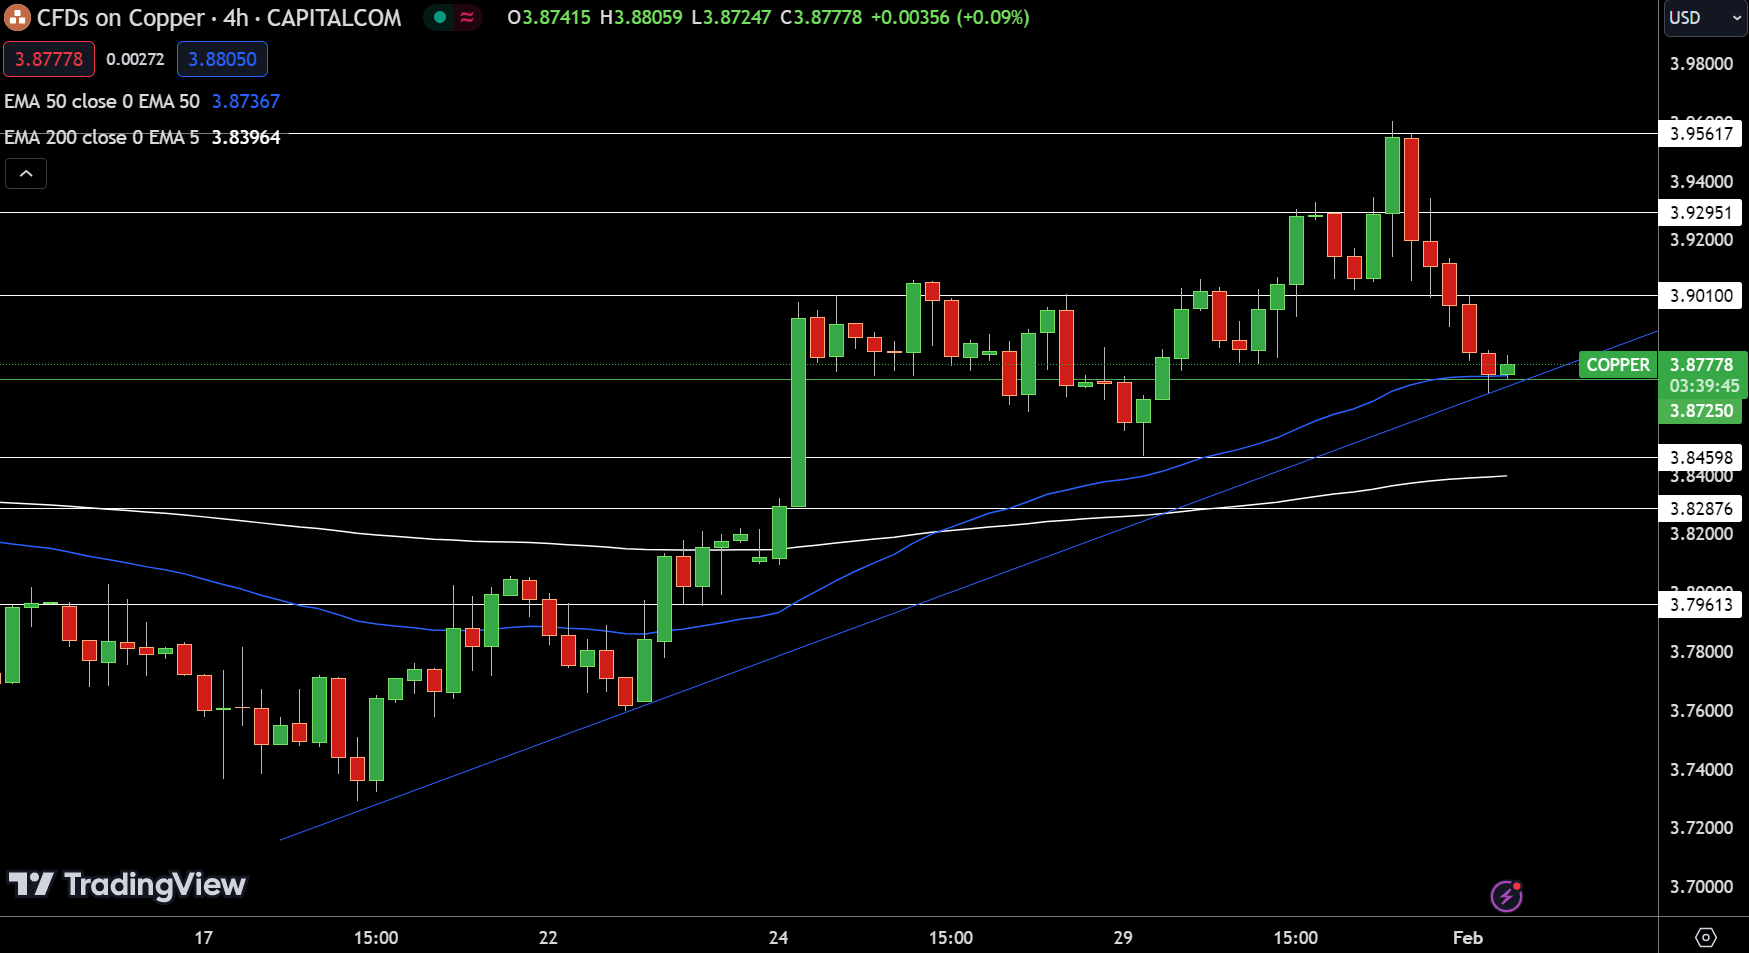
Copper trades lower today, dropping by 0.90% to $3.87778, reflecting a cautious market sentiment. The pivot point for today is established at $3.87250, delineating the neutral line between potential gains and losses. Resistance levels are identified at $3.90100, $3.92951, and $3.95617, each representing a hurdle for upward price movement.
Conversely, support levels are placed at $3.84598, $3.82876, and $3.79613, suggesting areas where buying interest may emerge to cushion the price fall. The 50-day and 200-day Exponential Moving Averages (EMAs) are closely aligned at $3.87367 and $3.83964, respectively, indicating a narrow trading range.
Given these metrics, the market outlook for copper appears bullish above the pivot point of $3.87250, highlighting a potential shift in momentum should prices sustain above this threshold.
For a look at all of today’s economic events, check out our economic calendar.