Key Insights
- Strong U.S. job data, hawkish Fed rhetoric push gold below $2,050; dollar and yields rise.
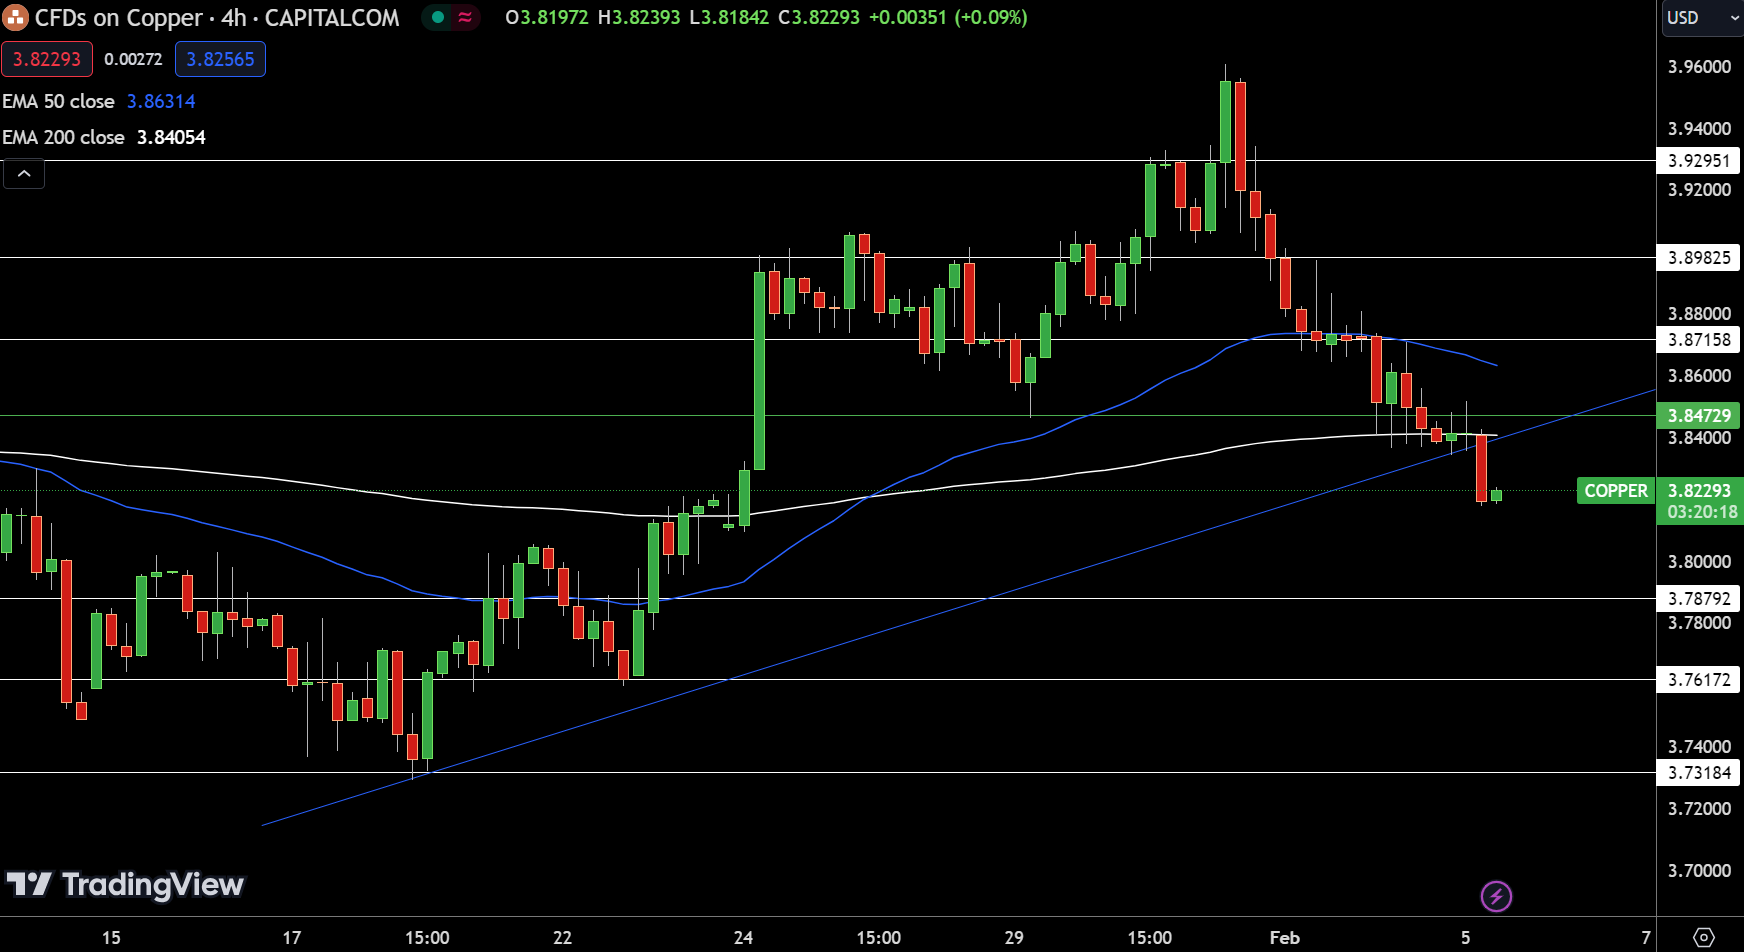
- Copper prices nudge higher amid Chilean wildfire supply concerns, China’s demand woes limit gains.
- Technical suggest gold could extend losses if it stays under pivot point of $2030.205.
Gold’s descent continued in Monday’s trading, a hangover from last week as robust U.S. job data and the Fed’s firm stance recalibrated rate cut forecasts. The metal tumbled from peaks over $2,050, pressured by the dollar’s ascent to a two-month peak and climbing Treasury yields.
Gold’s slip was catalyzed by January’s solid nonfarm payroll figures and Fed Chair Powell’s emphasis on a cautious approach to policy easing, diminishing expectations for rate reductions as soon as March.
Elevated rates spell trouble for gold, hiking the holding costs, despite its resilience above $2,000 on safe-haven demand amid Middle Eastern tensions.
Conversely, copper edged up, fueled by supply worries from Chilean wildfires, though gains are capped by China’s faltering demand amid its tepid economic rebound.
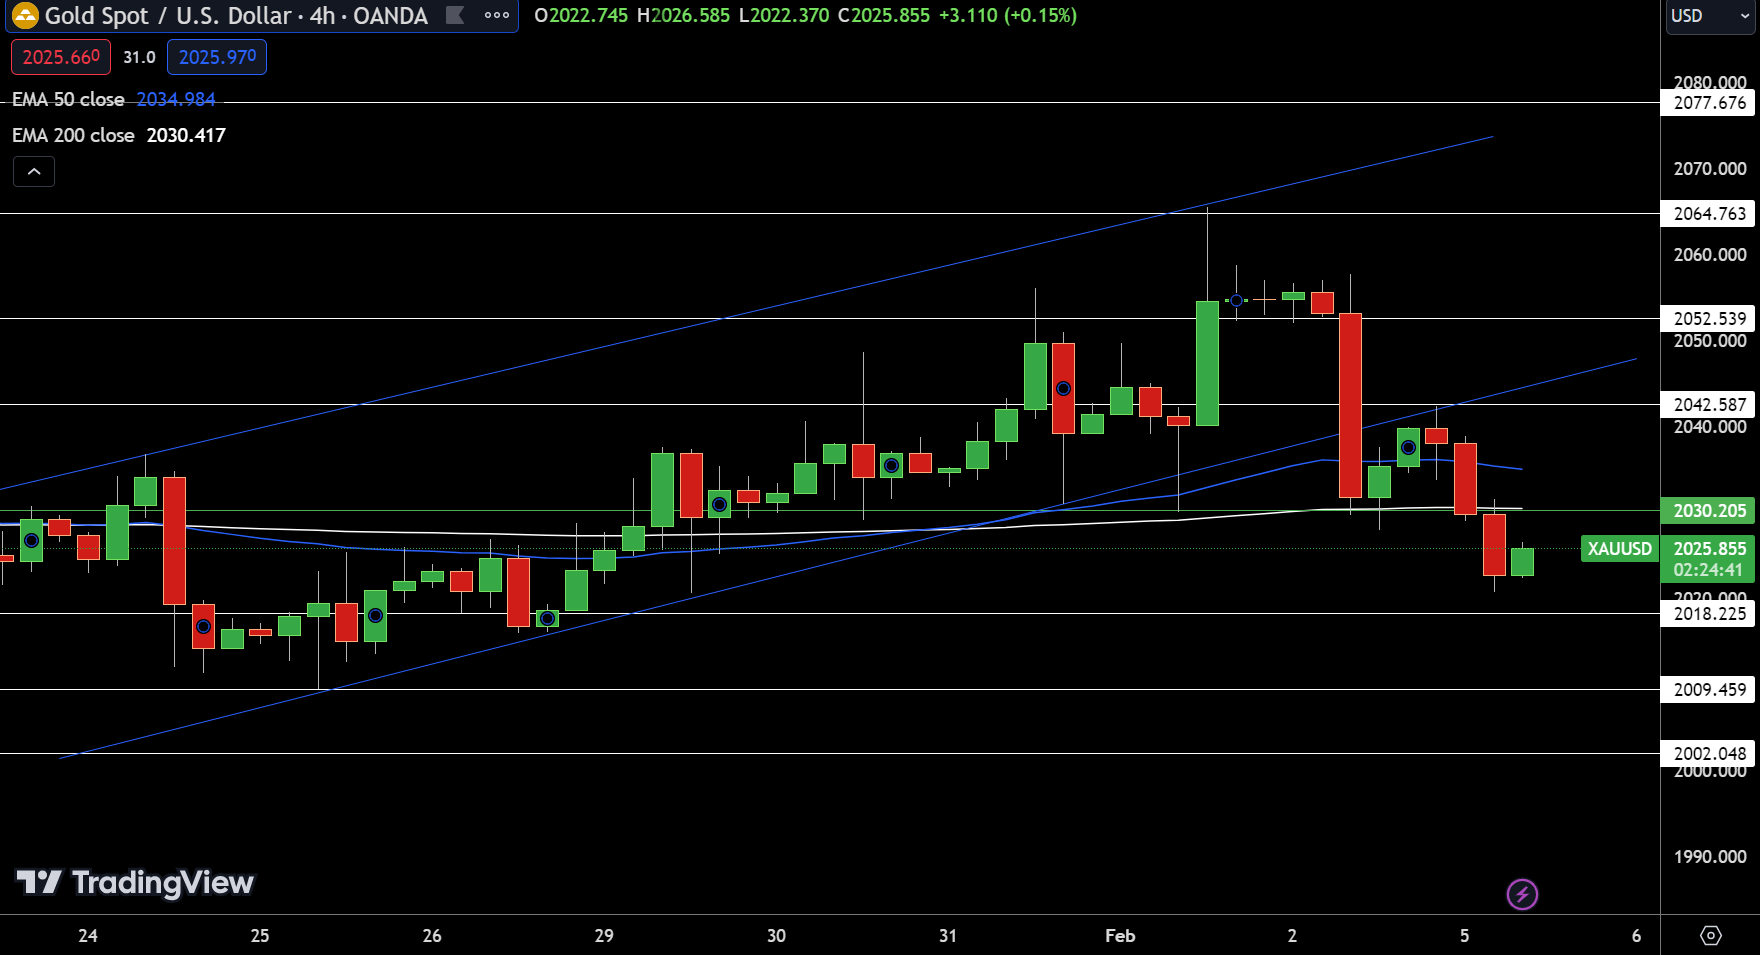
In today’s market, precious metal Gold is priced at $2023.745, marking a 0.79% decline within a 4-hour trading window. Currently, the pivot point stands at $2030.205. Gold faces immediate resistance at $2042.587, with further hurdles at $2052.539 and $2064.763.

On the downside, immediate support lies at $2018.225, followed by $2009.459 and $2002.048. The 50-day and 200-day Exponential Moving Averages are converging around $2034.984 and $2030.417, respectively, suggesting a possible inflection point.
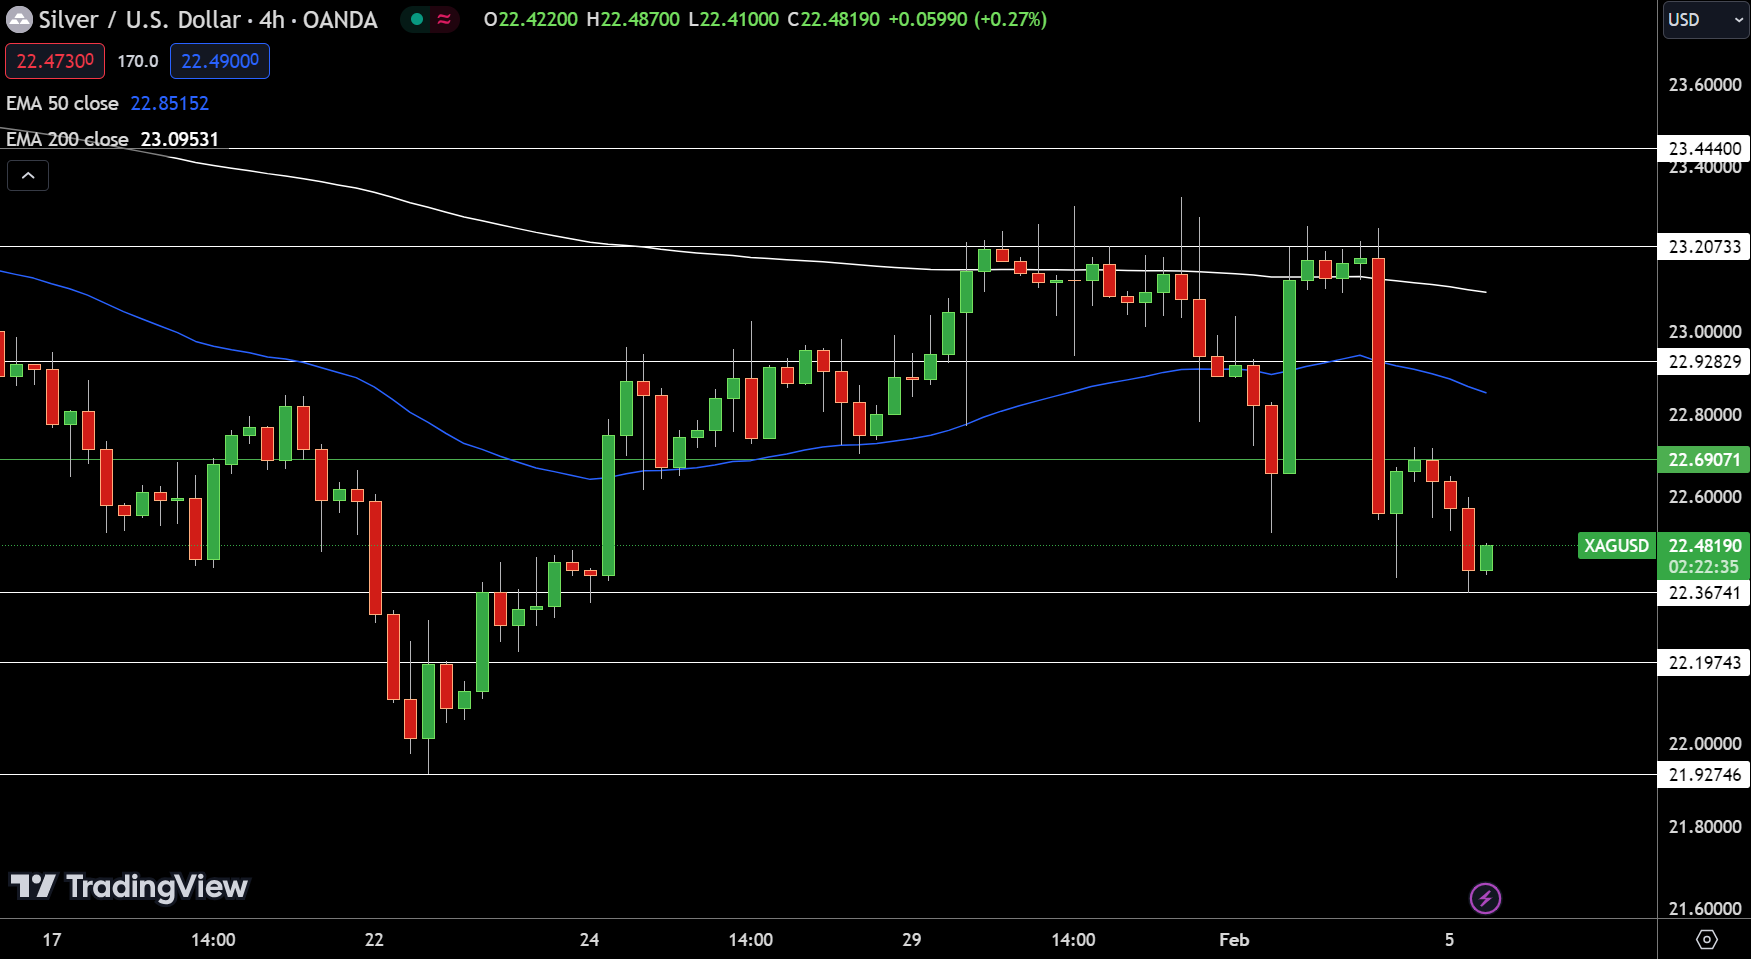
The current trading value of Silver‘s is $22.4545, down by 1.17% on the 4-hour chart. The metal’s pivot point is $22.69071, with immediate resistance levels noted at $22.92829, $23.20733, and $23.44400.
Supports are positioned at $22.36741, $22.19743, and $21.92746. The 50-day EMA is at $22.85152, suggesting near-term resistance, while the 200-day EMA at $23.09531 indicates a longer-term bearish trend.
The technical outlook is bearish below the pivot point of $22.69071, with a potential reversal if it surpasses this threshold.
Copper Prices Forecast