



Key Insights
- Gold prices dip due to a stronger dollar and anticipation of Federal Reserve rate updates.
- Safe-haven demand for gold rises amidst Middle East tensions, but dampened by dollar’s strength.
- Copper prices fall, influenced by a stronger dollar and pending Chinese economic data.
Traders are now cautiously observing Fed signals, potentially impacting future rate cuts. Copper prices also fell, impacted by the stronger dollar and awaiting key economic data from China, the world’s largest copper importer.
Both gold and copper are navigating market fluctuations, with their outlooks heavily influenced by global economic trends and monetary policy shifts.
Gold Prices Forecast
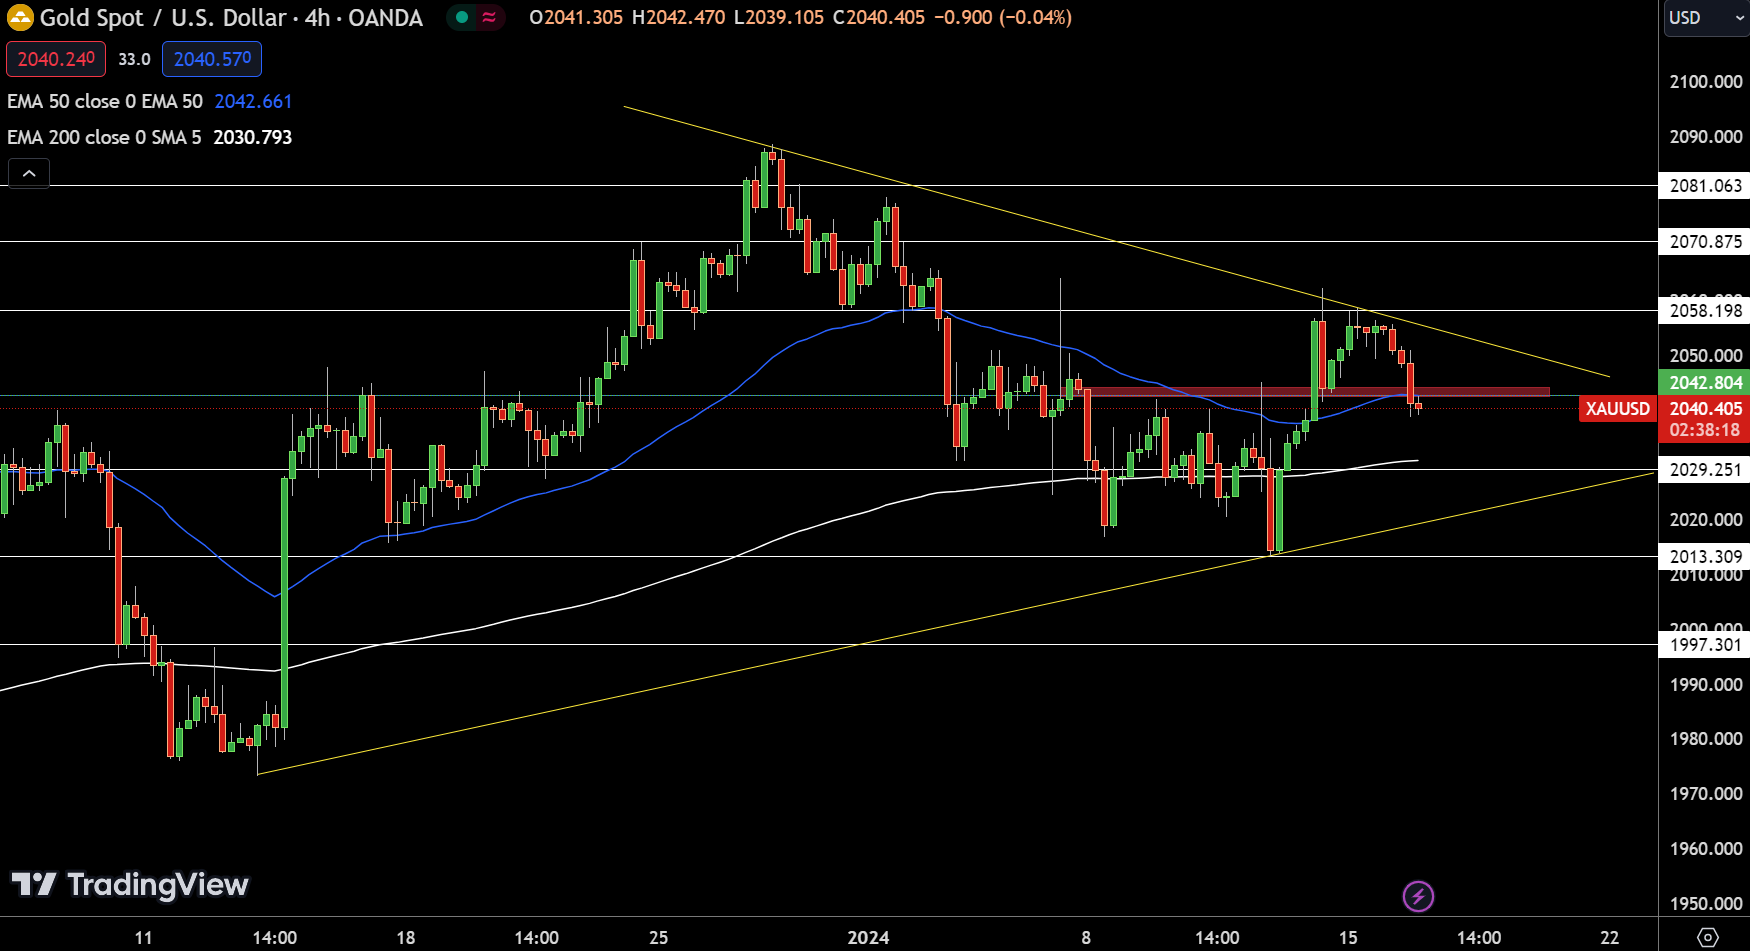
Gold’s performance on January 16 presents a cautious scenario, as it experiences a decline of 0.67%, settling at around $2040. The precious metal navigates a crucial phase, hovering near its pivot point of $2,042.
Resistance levels are mapped at $2,058, $2,070, and $2,081, providing critical thresholds for any potential bullish reversal. Conversely, the support levels at $2,029, $2,013, and $1,997 are essential to prevent further decline.
The 50-Day Exponential Moving Average (EMA) stands at $2,042, coinciding with the pivot point, while the 200-Day EMA at $2,030 could offer support. A notable chart pattern, the symmetrical triangle extending resistance at $2,058, combined with the formation of a “three black crows” pattern, indicates a potential for continued selling pressure. Overall, the trend for gold appears bearish in the short term.
Silver Prices Forecast
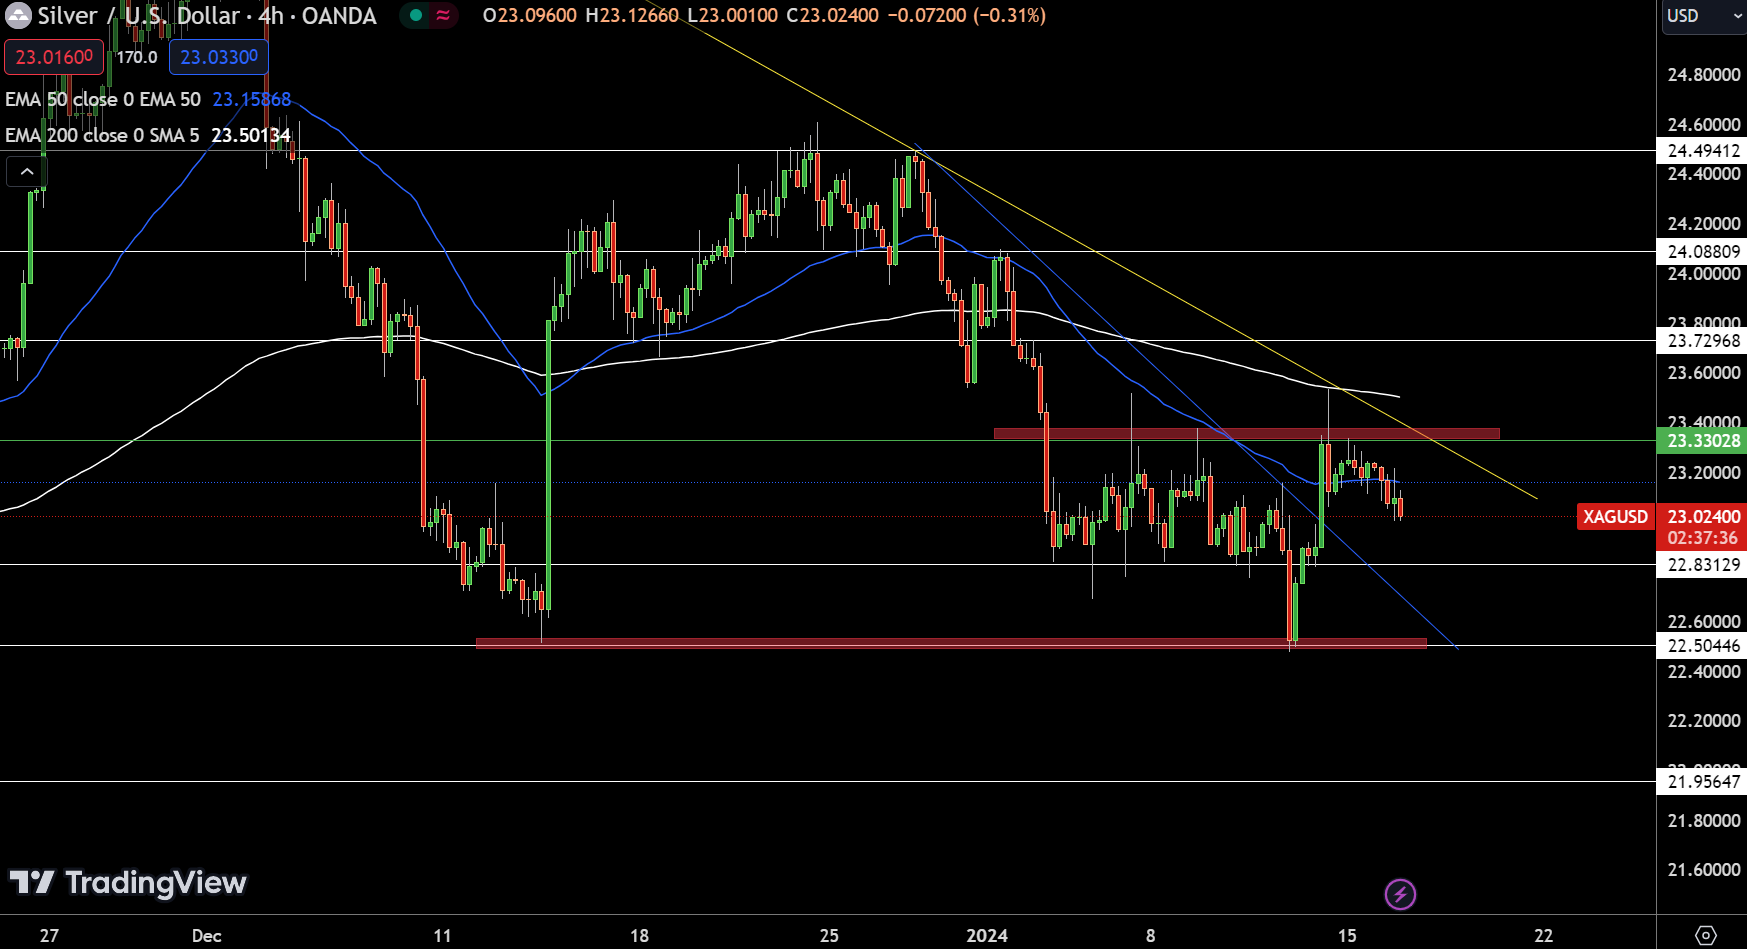
On January 16, Silver exhibited a slight decline of 0.54%, bringing its price to $23.02. This movement indicates a period of uncertainty in the market. The crucial pivot point for Silver stands at $23.33, a level that currently acts as a barrier for any bullish momentum.
The immediate resistance levels are positioned at $23.73, $24.09, and $24.49, representing potential targets for upward price movements. Conversely, the support levels at $22.83, $22.50, and $21.96 offer potential cushions against further price drops.
The 50-Day and 200-Day Exponential Moving Averages, standing at $23.16 and $23.50 respectively, reinforce this bearish outlook, with a downward trendline and a cross below the EMA indicators pointing to selling pressure. In summary, Silver’s current trend appears bearish, especially below the $23.33 mark.
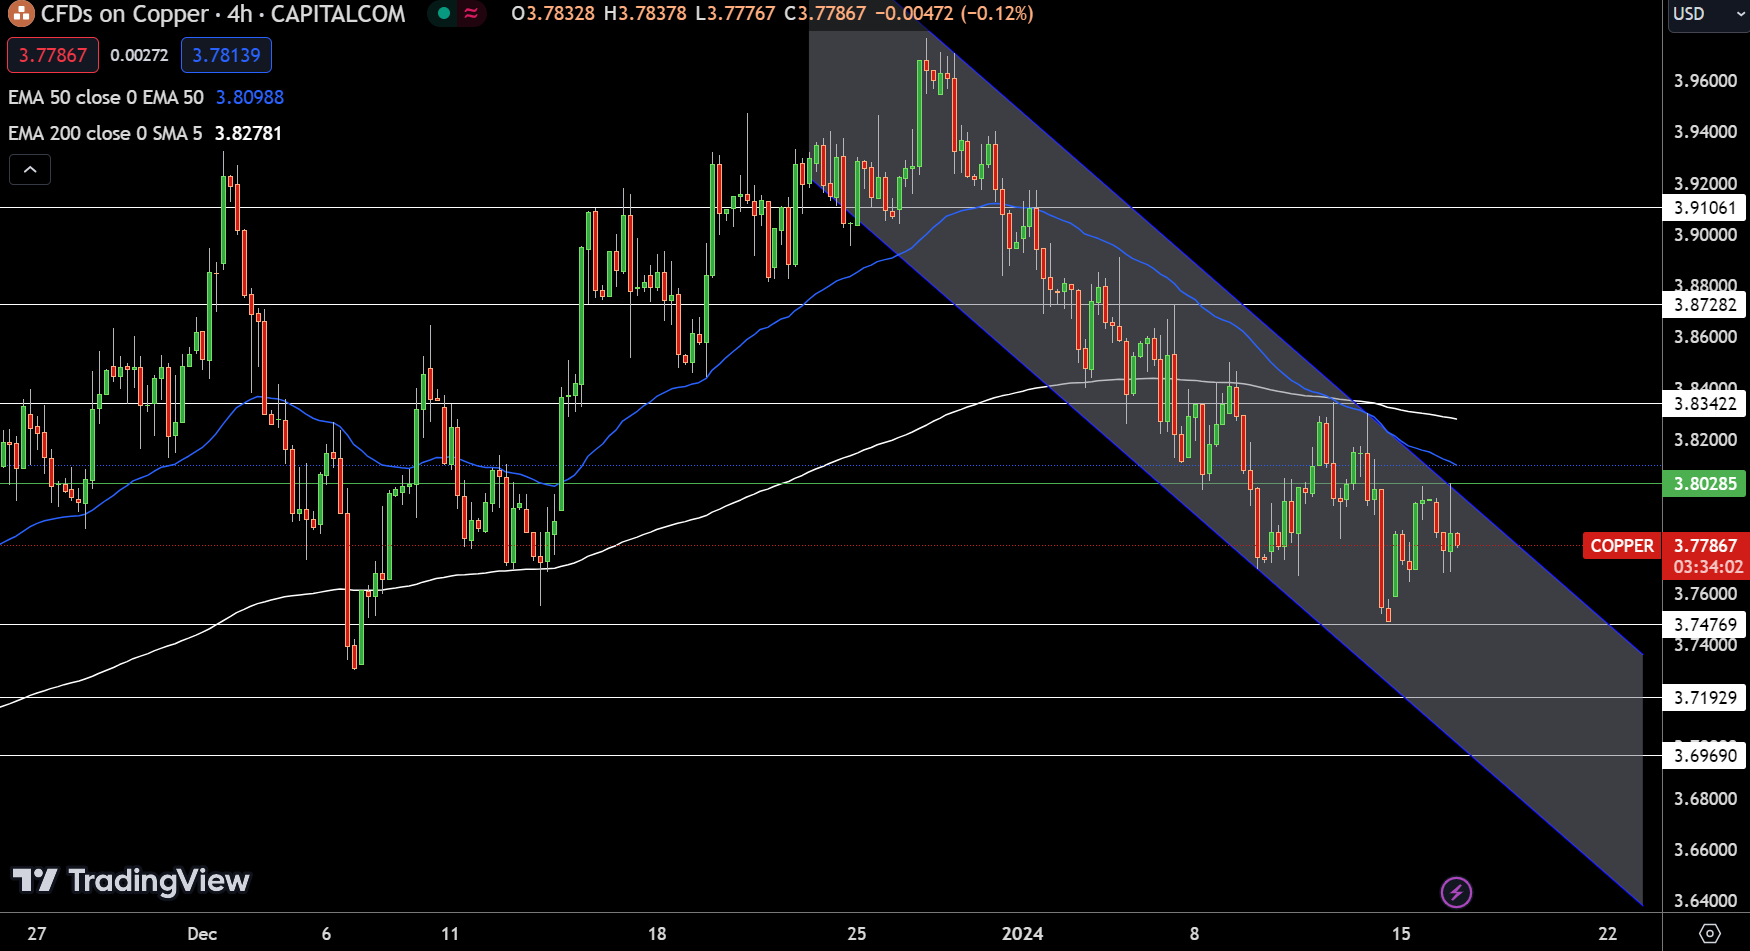
On January 16, Copper experienced a modest decline of 0.15%, trading around the $3.77 mark. This movement reflects a slight bearish tendency in the market. The key pivot point for Copper is established at $3.80, a crucial level that currently acts as a threshold between bearish and bullish territories.
Resistance levels are identified at $3.83, $3.87, and $3.91, marking potential hurdles for upward price movements. In contrast, support levels at $3.75, $3.72, and $3.70 offer potential zones where the price might find a footing in case of further declines.
The technical analysis, particularly the 50-Day and 200-Day Exponential Moving Averages, suggests a bearish sentiment. Both EMAs, positioned at $3.80 and $3.82 respectively, are hovering around the current trading price, indicating potential resistance zones.
Furthermore, a downward channel pattern is in play, extending resistance at $3.80, which reinforces the selling bias. In summary, Copper’s trend appears bearish, especially below the $3.80 mark.