



Bitcoin (BTC) trades near $73,500 on Thursday while gold (XAU) remains under pressure after breaking key support level of $4,000. The ratio of Bitcoin to gold currently remains near the 18 level. The strong U.S. CPI data on Tuesday increased expectations for the rate hike in December and pushed U.S. dollar index toward the 19-month high. The strong US dollar increased pressure on gold and Bitcoin.
Investors pulled the net $299.8 million from U.S. spot Bitcoin ETFs on Wednesday according to data from Farside. This is up from $95 million on Tuesday. The biggest outflows on Wednesday were from BlackRock’s fund which accounted for $269.7 million of outflows.
The US producer price data on Friday may change the tone of the market. If the US dollar and US Treasury yields continue to rally after the US PPI data, it may introduce bearish pressure on gold and Bitcoin prices. Moreover, the deeper decline in the Bitcoin to gold ratio below 18 may suggest that Bitcoin may outperform the gold market.
Bitcoin Price Forecast: $60,000 Support and $87,000 Resistance
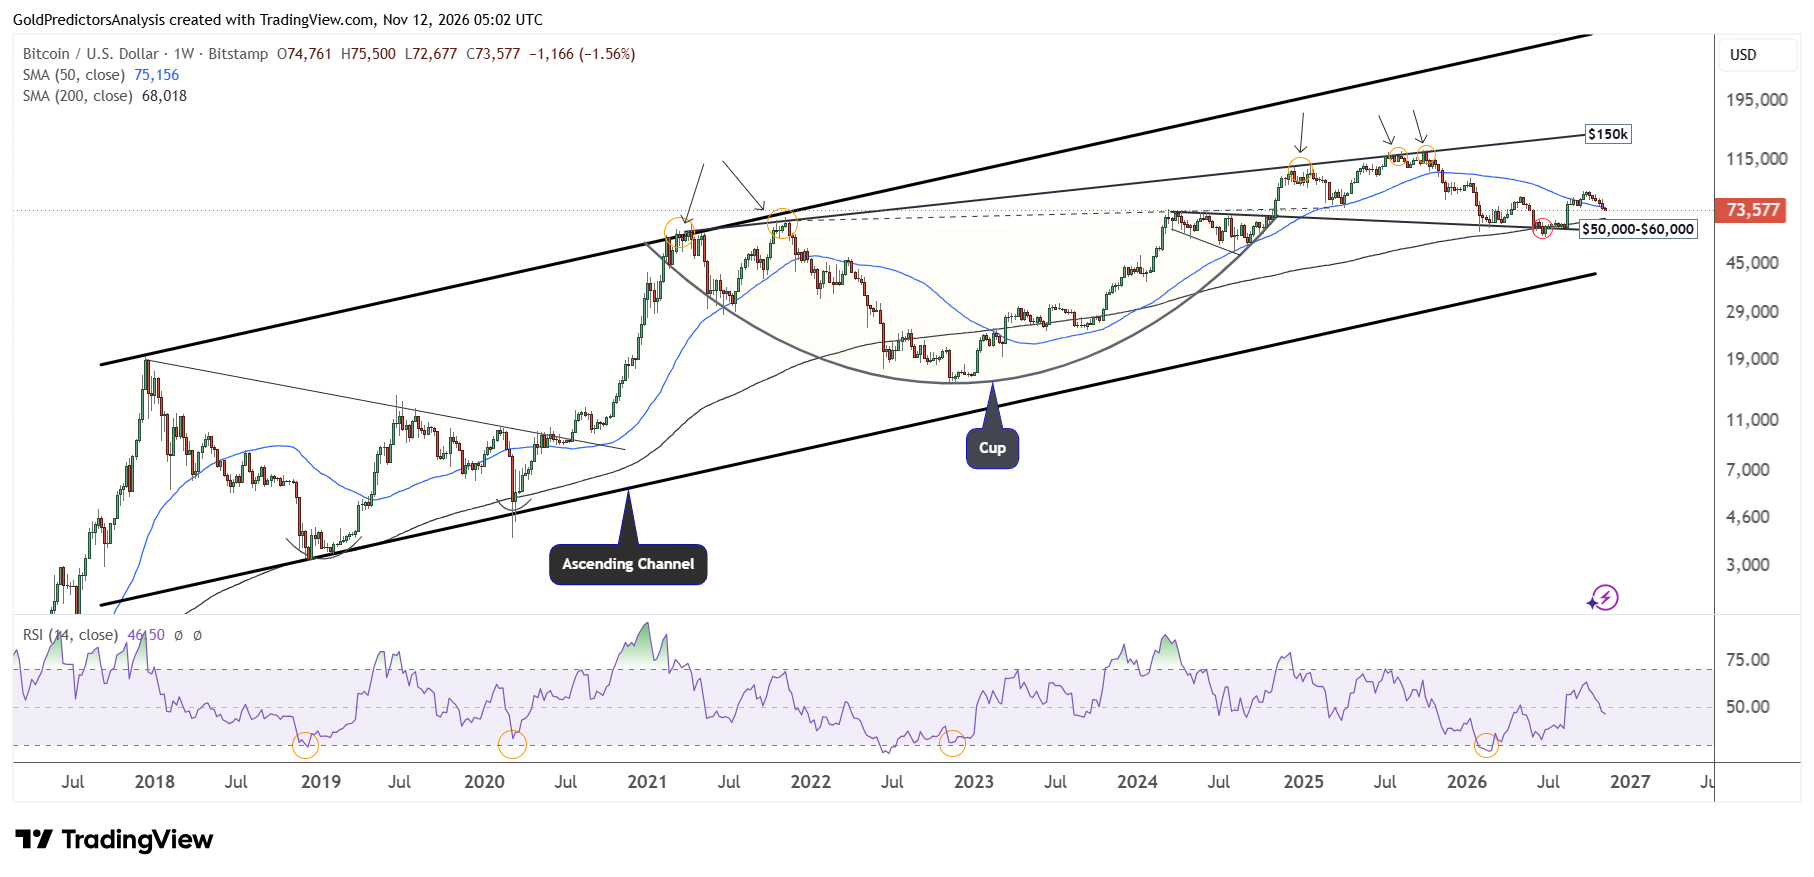
From a technical perspective, Bitcoin has been trading within ascending channel pattern since 2018. The price formed the low within the support zone of $50,000 to $60,000 in June 2026 and rebounded towards the $87,000 area. Now the price is correcting lower to find the next support level.
The overall structure for Bitcoin remains bullish as long as the price holds the $50,000 level. A break below $50,000 may push Bitcoin towards the $40,000 area. This support is considered the long term support seen by the ascending channel pattern. But a confirmed break above $87,000 may open way for further upside towards $100,000.
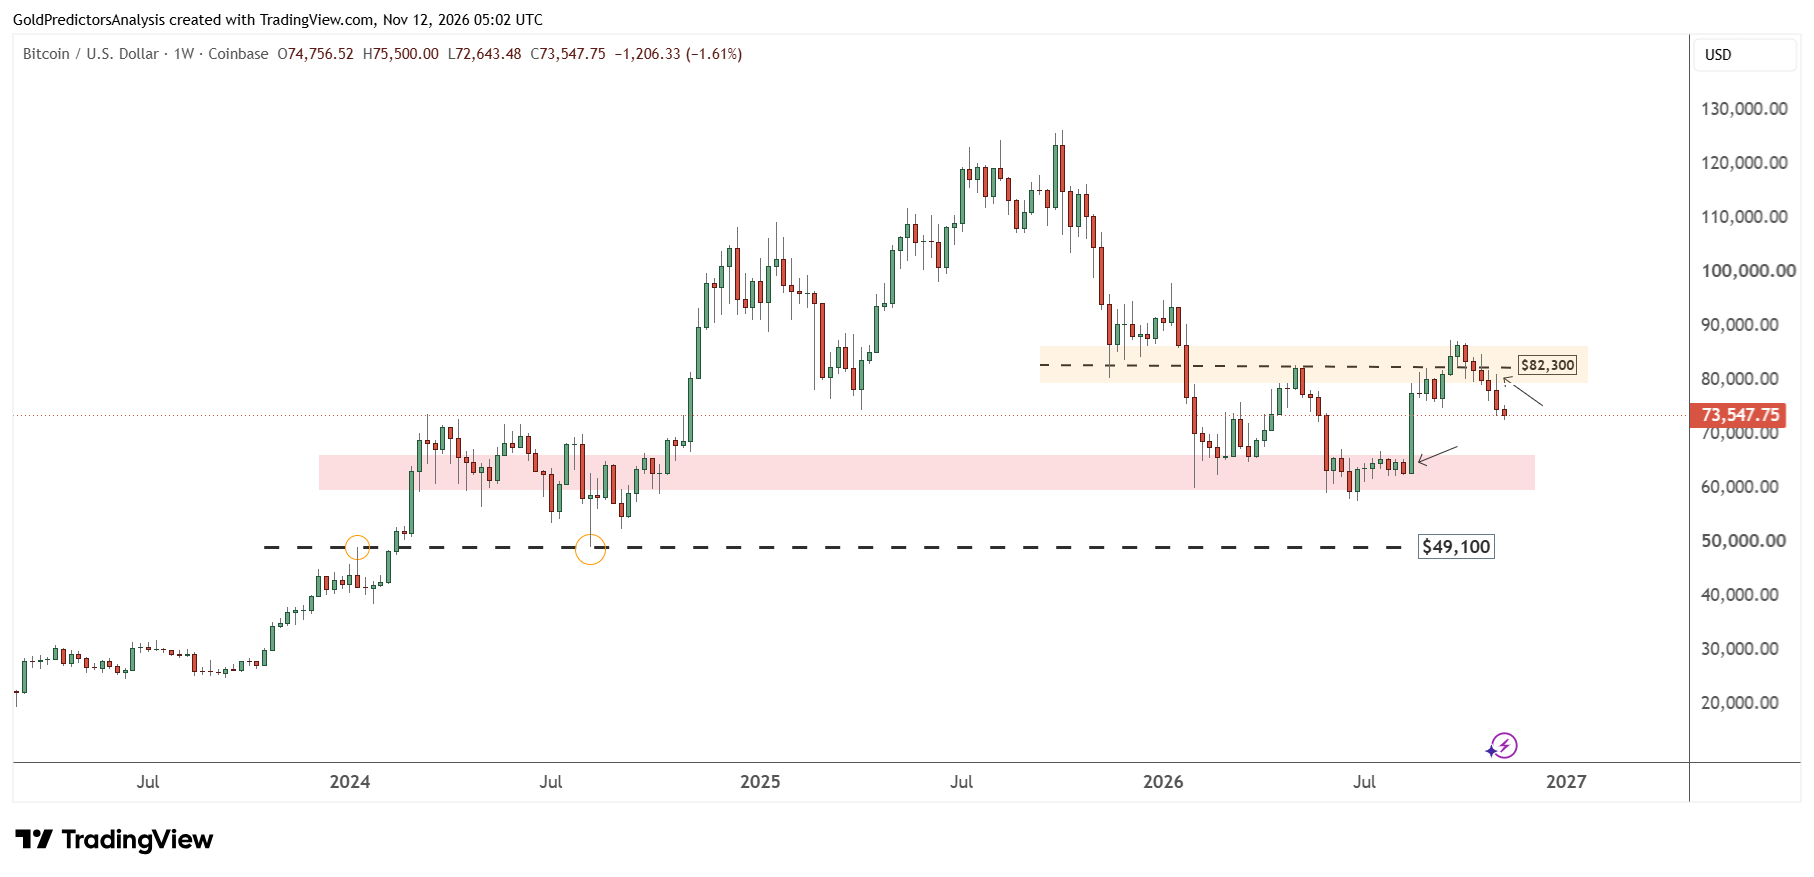
The weekly chart below shows that Bitcoin has consolidated over the past few months. The price found strong support near $60,000 in 2026 and rebounded. But Bitcoin has remained under bearish pressure over the past six weeks. This pressure suggests that the price may drop back towards the $60,000 area if the price remains below $87,000. Bitcoin needs to break above $100,000 to open the way for the record rally.
Gold Price Forecast
Every new Gold analysis as it publishes, today's technical signal and key levels, live price — on one page.
See all Gold forecastsGold vs Bitcoin: Can Gold Extend Its Long-Term Breakout?
The monthly chart for the gold to Bitcoin ratio shows that the ratio broke above the descending channel pattern in September 2025. After the breakout, the ratio began strong rally as gold prices continued to surge. The ratio reached resistance at 0.08 and then dropped towards 0.05. This suggests that gold has broken out against Bitcoin and remains in a positive trend. But the ratio may consolidate before stabilizing above the support levels.
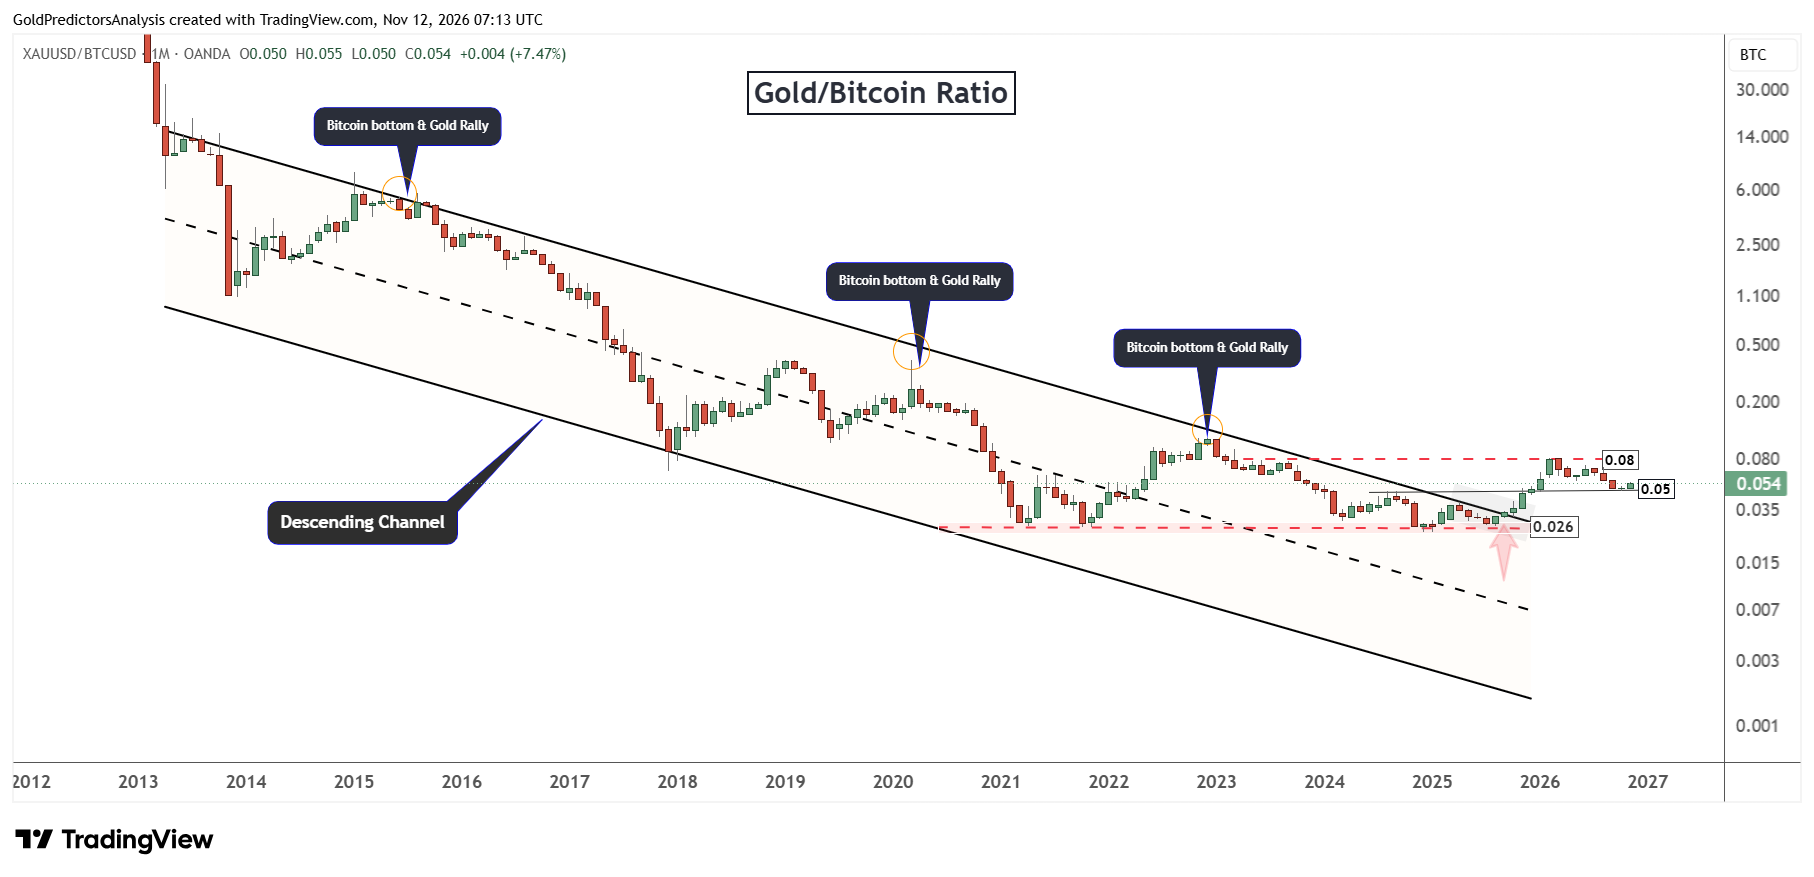
The ratio needs to break above 0.08 to begin another rally. The increase in ratio would suggest that gold is likely to outperform Bitcoin over the next few months.
In the short term, the ratio is rebounding from support at 0.05. From the historical perspective, the peaks in ratio have coincided with bottoms in Bitcoin while gold has continued to rally after those peaks.
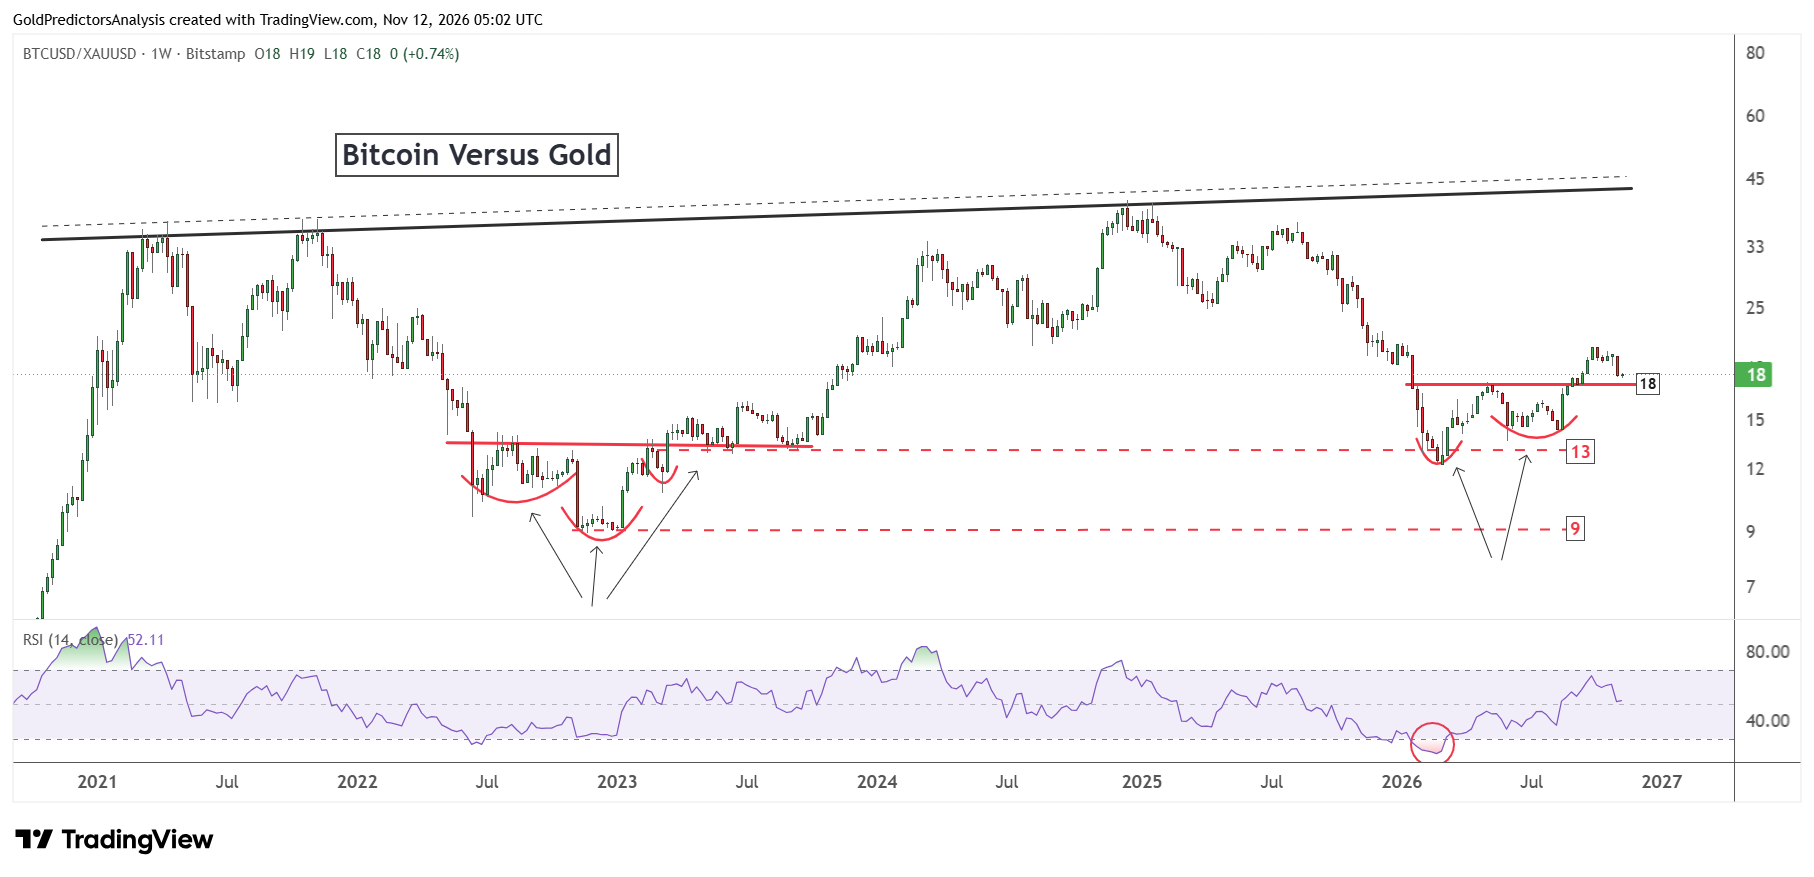
The chart below shows that the ratio of Bitcoin to gold found strong support at 12 and rebounded after forming the double bottom pattern. The ratio is now correcting towards support at 18 after reaching the high of 21. As long as support at 18 holds, another rally in the ratio may develop.
What to Watch Next
Bitcoin and gold prices remain under bearish pressure after the hot inflation data from the US. The gold price has broken below the key support of $4,000 while the Bitcoin price remains below the key support of $75,000. The US dollar has also broken above the key resistance of 102.60 which suggests that the dollar may continue to rally further in the short term. The 10-year US Treasury yield has also reached the 5% level after US CPI data.
The strength in the US dollar and US Treasury yields suggests further downside in gold and Bitcoin prices. If US dollar continues to rally after the US PPI data, it may signal further weakness in these assets. This suggests that the Bitcoin price may continue to drop toward the $60,000 level as long as the price remains below the $87,000 level. The Bitcoin to gold ratio also reaches the support level of 18. If this support in the ratio holds and creates rebound, Bitcoin may continue to outperform gold.
If you’d like to know more about how crypto markets work, please visit our educational area.