
Looking ahead, traders will focus on the US ISM Services Purchasing Managers Index (PMI) due Monday for market-moving insights. The PMI is expected to rise to 51.0 in July from 48.8 in June.
A stronger-than-expected PMI reading could strengthen the dollar and limit gold’s upside potential.
Gold Prices Rise as Weak US Dollar and Economic Data Fuel Fed Rate Cut Hopes
The US dollar continues to struggle, weighed down by the Federal Reserve’s dovish stance and a weaker employment report. As a result, US Treasury bond yields and the dollar are likely to remain under pressure, which supports gold prices. Markets currently see a 74% chance of a 50 basis-point rate cut by the Fed at the September meeting. However, Chicago Fed President Austan Goolsbee cautioned against overreacting to a single month’s data, noting recent progress in inflation and job numbers.
In July, US nonfarm payrolls increased by 114,000, down from 179,000 in June and below the expected 175,000. The unemployment rate rose to 4.3%, the highest since November 2021, while average hourly earnings grew by 0.2%, below the anticipated 0.3%.
Thus, the weaker US dollar, lower bond yields, and expectations of a Fed rate cut have supported gold prices. Additionally, softer employment data and a rising unemployment rate further enhance gold’s appeal as a safe-haven investment.
Geopolitical Tensions and US Developments Poised to Elevate Gold Prices
Rising geopolitical tensions in the Middle East are expected to boost safe-haven assets like gold. US Secretary of State Tony Blinken warned G7 counterparts that Iran and Hezbollah could attack Israel as early as Monday.
Additionally, US President Joe Biden is set to convene the National Security Council at 2:15 pm Eastern time on Monday to address these developments.
These geopolitical concerns, coupled with a weaker US dollar and lower bond yields, are anticipated to further support gold prices.
Short-Term Forecast
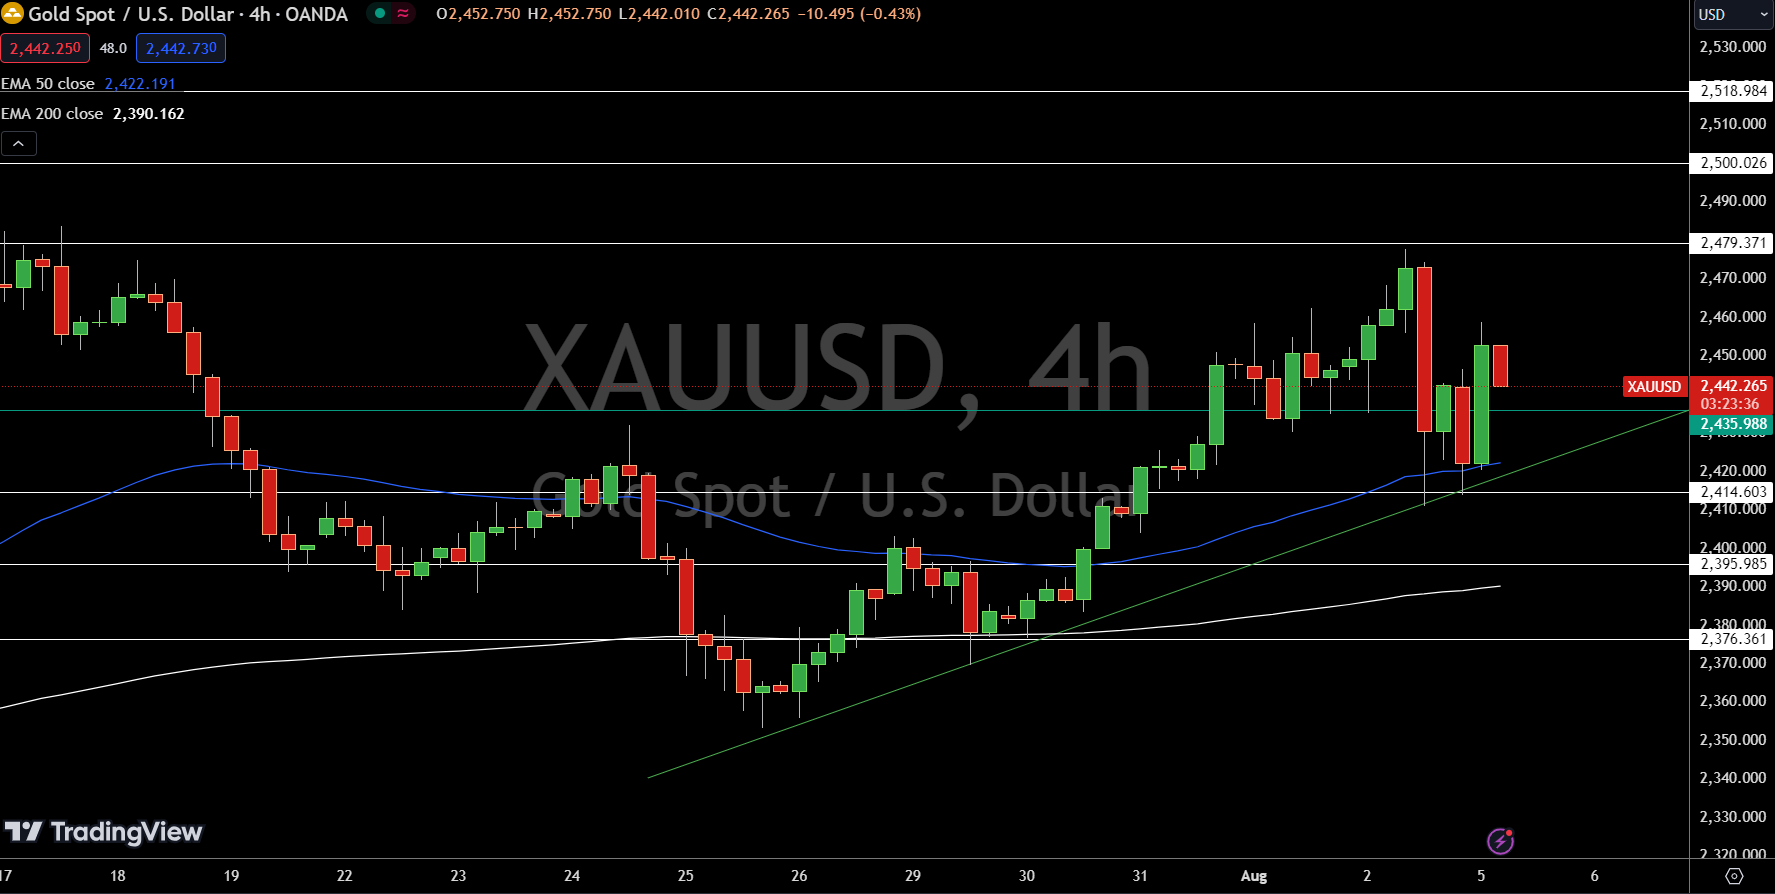
Gold (XAU/USD) is trading at $2,442.26, up 0.12% on the 4-hour chart. The pivot point is at $2,435.98, with immediate resistance at $2,479.37 and further resistance at $2,500.02 and $2,518.98.
Key support levels are at $2,414.60, $2,395.99, and $2,376.36. The 50-day EMA at $2,422.19 and the 200-day EMA at $2,390.16 indicate a bullish trend above $2,435. The market shows a bullish bias, suggesting upward momentum.

However, a break below the pivot point could trigger a significant selling trend. Investors should watch for any movement around key levels to guide their trading strategies.