



Bargain Hunters Return to Gold After Worst October Since 2008
Gold rebounded on Monday as bargain hunters stepped in after its worst October since 2008, and softer oil eased some of the inflation worries behind the sell-off. Spot gold was trading near $3,900, but the bounce is small next to last month’s losses, and the chart still favors sellers.
Gold: Second Straight Monthly Loss on Rate Fears
Gold ended October with its second straight monthly decline. During Friday’s session, MINING.com reported that spot gold had reached $3,891.67, its lowest since October 28, 2025. At that point it was down about 6% for the month. Gold later fell further. Even after Monday’s rebound, gold is about 28% below its record close of $5,419.83 from January 28.
Rate fears did most of the damage. Gold is being hit by “the US GDP data, which came in stronger than expected” and “the increase in oil prices putting pressure on the Fed to hike further interest rates,” UBS analyst Giovanni Staunovo told Reuters. GDP, the total value of goods and services the US economy produces, grew faster than expected in the third quarter. A stronger economy and pricier oil both give the Fed reason to raise rates, and gold pays no interest, so higher rates make it less attractive than bonds or cash that do.
Central banks gave no relief last week. The Federal Reserve and the European Central Bank both kept rates unchanged but flagged energy prices as a risk to inflation. The ECB said energy prices “have continued to rise, posing upside risks to the inflation outlook and downside risks to the growth outlook.” That keeps the hike fears that have weighed on gold all month in place.
Tech Losses Spilled Over Into Metals
Part of Friday’s drop had little to do with gold itself. Losses in technology stocks pushed some investors to sell precious metals to cover those losses, Bloomberg reported. Usually, a stock sell-off sends money into gold as a safe haven, an asset investors buy in a scare. This time gold was sold alongside stocks. In my view, that shows how much the rate outlook, not fear, is driving the metal right now. Commerzbank called the decline in precious metals exaggerated and still expects a recovery.
Gold Price Forecast
Every new Gold analysis as it publishes, today's technical signal and key levels, live price — on one page.
See all Gold forecastsSilver: Down About 18% in October
Silver fell harder. It was down 5.8% at $49.34 during Friday’s session, its first move below $50 since November 2025. Silver lost about 18% in October. Silver is a smaller and more volatile market than gold, so it usually moves harder in both directions.
What Comes Next
Oil fell on Monday after Iran and Qatar held a third day of talks on Sunday and President Trump gave diplomacy more time. Lower oil means less inflation pressure, which takes some heat off the Fed hike case. The week is busy: the US midterm elections on Tuesday, then the October jobs report on Friday, November 6. A strong jobs number would add to hike bets and could cap the rebound.
Gold Technical Analysis: XAU/USD Breaks Below $3,978 as $3,817 Comes Into Focus
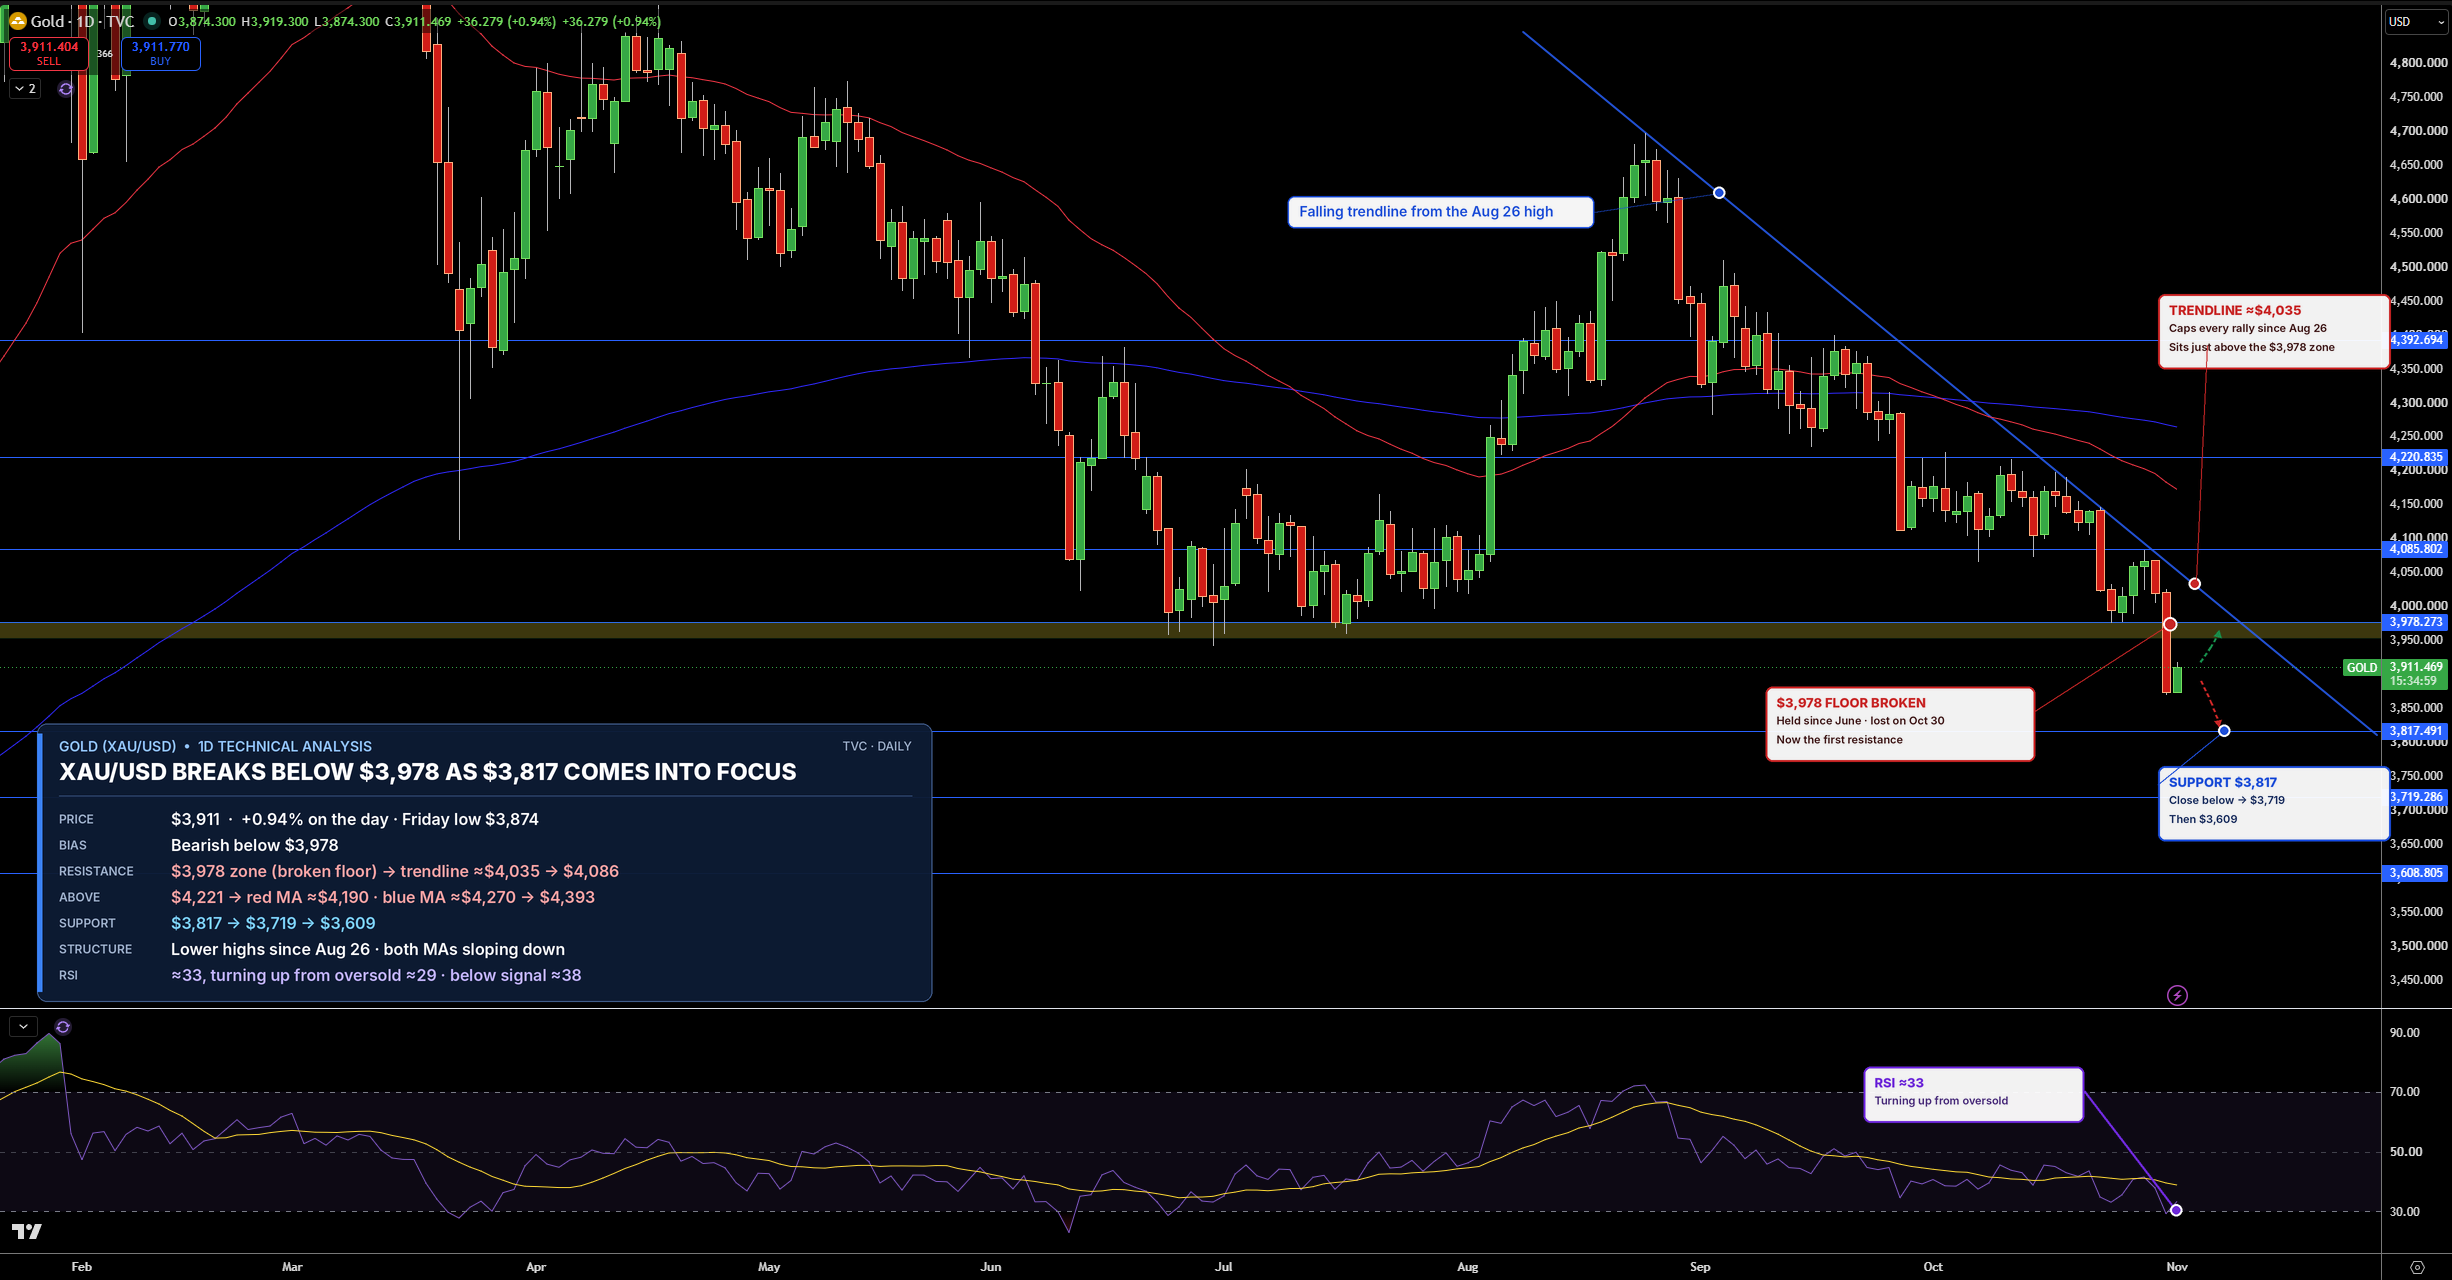
Gold is trading near $3,911 on the daily chart after breaking below $3,978, a support level, or floor where buyers had stepped in, that held since June. A broken floor often turns into a ceiling, so $3,978 is now the first resistance, followed by the falling trendline near $4,035 and $4,086. If sellers stay in control, the way opens to $3,817 and then $3,719.
RSI, which measures the strength of recent buying and selling on a 0 to 100 scale, is near 33, close to the oversold zone below 30 where bounces become more likely. That fits Monday’s bargain hunting, but one bounce does not change the trend. I lean bearish while gold stays below $3,978. A daily close back above it would ease the pressure.
Silver Technical Analysis: XAG/USD Holds Near $50 After $54.72 Breakdown
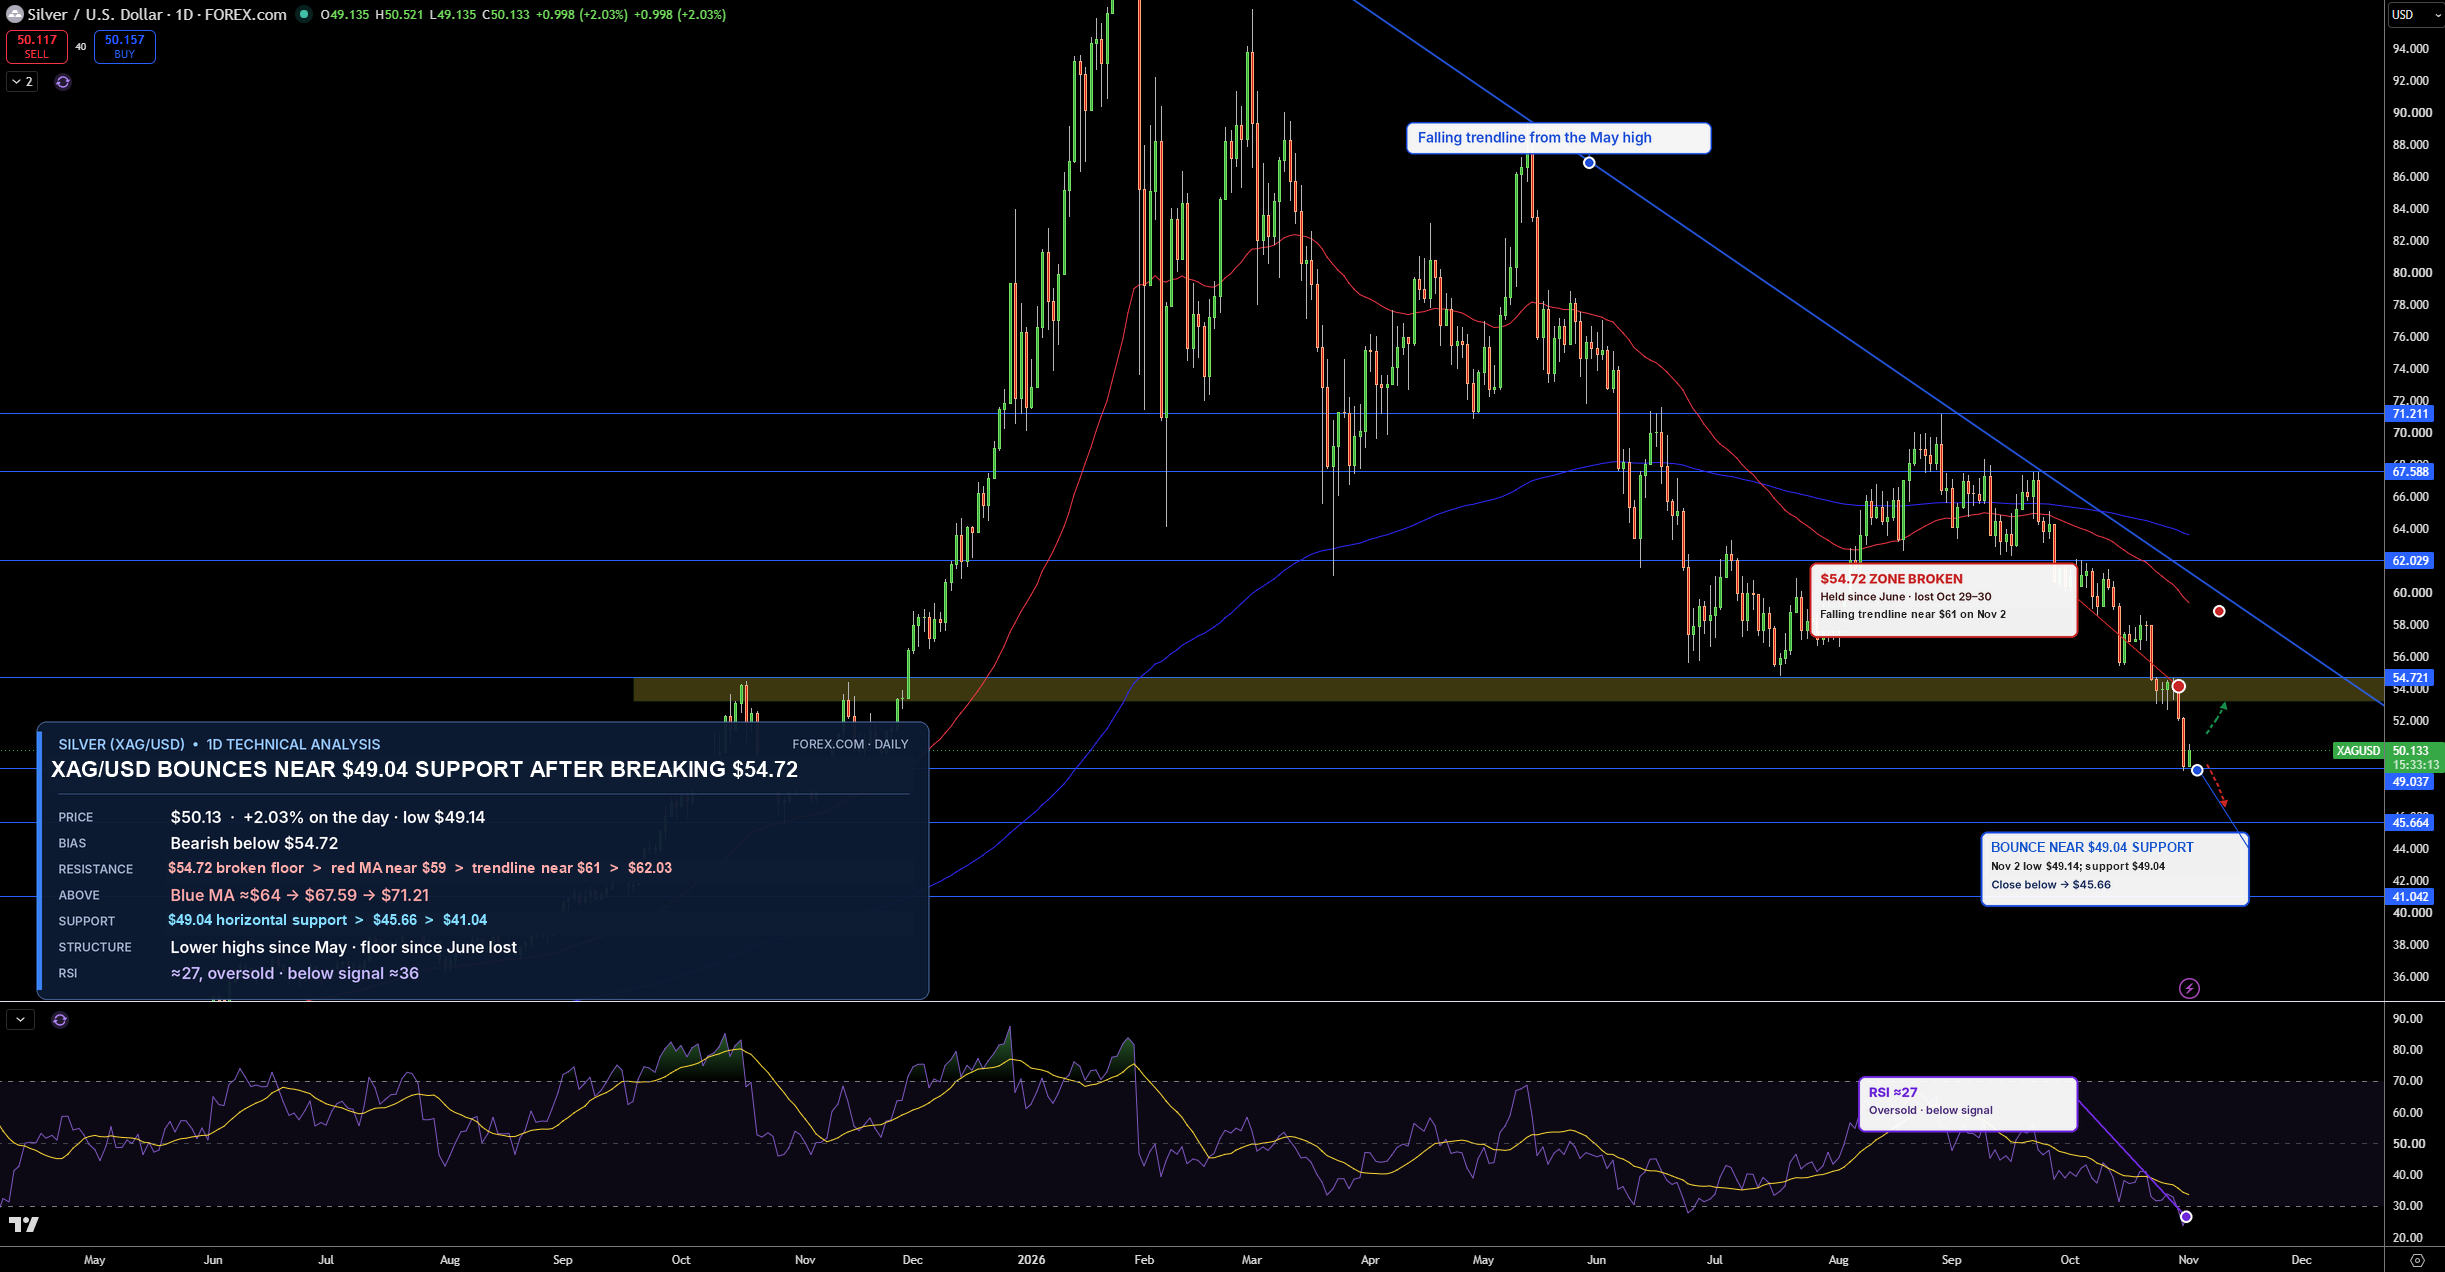
Silver is trading near $50.13 on the daily chart after a sharp break below $54.72, and Monday’s low was $49.14, just above horizontal support at $49.04. If it gives way on a daily close, $45.66 comes into play.
On the upside, silver needs to clear $54.72, the old support that now acts as resistance, then the moving average near $59 and the falling trendline near $61 before $62.03. RSI is near 27, already oversold, so a relief bounce toward $54.72 would not surprise me. Even so, the bias stays bearish while silver trades below that level.