



Gold and Silver: Inflation Test Looms as Investment Demand Holds Firm
Spot gold trades near $4,113.205 per troy ounce and spot silver near $52.538 per troy ounce. Lower oil prices have eased some concerns about inflation. Reuters reported Monday that oil softened after President Donald Trump said further attacks on Iran were highly unlikely while negotiations continued. A softer dollar also helped overseas buyers. Lower energy costs could reduce pressure for higher interest rates, but the diplomatic tone does not establish that supply disruptions have ended.
The US labour market limits that relief. October payrolls increased by 165,000, with unemployment at 4.1%, according to the Bureau of Labor Statistics. Resilient employment gives the Federal Reserve more room to prioritise inflation. For both metals, higher interest rates remain a headwind because neither pays interest, making interest-paying assets more competitive.
Gold: ETF Inflows Hold Up Despite Uneven Regional Demand
The World Gold Council’s November 5 report showed physically backed gold ETFs attracted $2.7bn in October, their fourth consecutive month of inflows. ETFs are investment products traded on exchanges; these funds hold physical gold. Holdings increased by 19 tonnes to 4,275 tonnes, a month-end record. European funds led purchases, while North America recorded modest outflows.
That regional split shows that investment demand remains supportive without being uniform. Continued buying despite October’s price weakness suggests some investors are retaining gold for portfolio diversification. It does not remove the immediate sensitivity to US rates, which is why this week’s inflation figures remain important to the recovery.
Silver: Industrial Support Faces Weaker Solar Consumption
CME’s November 6 commentary, citing Silver Institute projections, identified data centres, AI and automotive applications as support for silver demand. Those uses help offset weaker solar-sector consumption. The institute’s annual survey attributes solar weakness partly to manufacturers reducing the silver used per application and substituting other materials.
These are industry trends and projections, rather than evidence of a new demand surge today. Silver can benefit from selected industrial applications while overall manufacturing consumption remains under pressure. Its immediate recovery therefore still depends partly on investment demand and the monetary outlook shared with gold.
Gold Price Forecast
Every new Gold analysis as it publishes, today's technical signal and key levels, live price — on one page.
See all Gold forecastsInflation Data Provide the Next Policy Test
The BLS calendar schedules US consumer inflation for November 10 and producer inflation for November 13. Consumer prices track what households pay; producer prices measure prices received by domestic producers. Softer underlying inflation could ease expectations for further rate increases. Stronger readings would challenge the metals recovery even as gold retains diversification appeal and silver benefits from selected industrial uses.
Gold Technical Analysis: Recovery Faces $4,147.620 Trendline Resistance
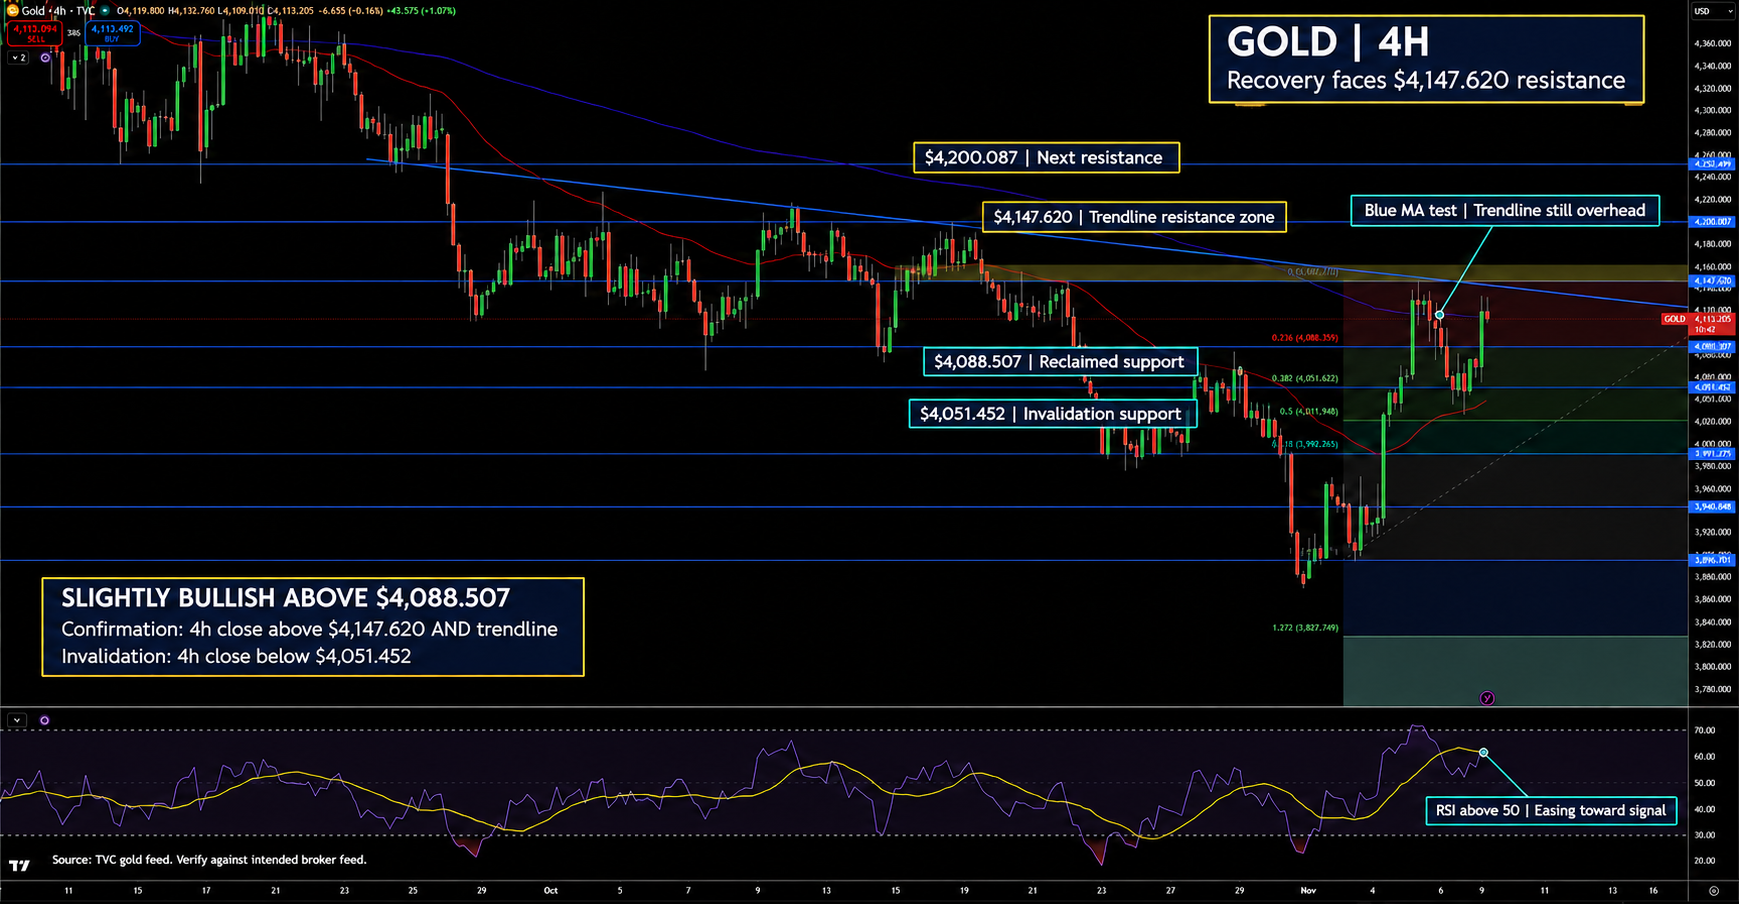
Gold trades near $4,113.205 per troy ounce on the four-hour TVC chart after reclaiming $4,088.507. The rebound has reached the blue moving average, which tracks average prices over time. The descending trendline, a line connecting lower highs, and shaded resistance zone remain overhead, leaving buyers with another barrier to clear.
Resistance, where sellers may return, stands at $4,147.620, followed by $4,200.087. Support, where buyers may step in, is $4,088.507, then $4,051.452. RSI, a 0 to 100 gauge of buying and selling strength, remains above 50 but has eased toward its signal line, a slower average of RSI. I lean slightly bullish above $4,088.507, favoring a successful retest. A four-hour close above $4,147.620 and the trendline would strengthen the upside case; a close below $4,051.452 would invalidate the recovery view.
Silver Technical Analysis: $53.107 Rejection Keeps Breakout Unconfirmed
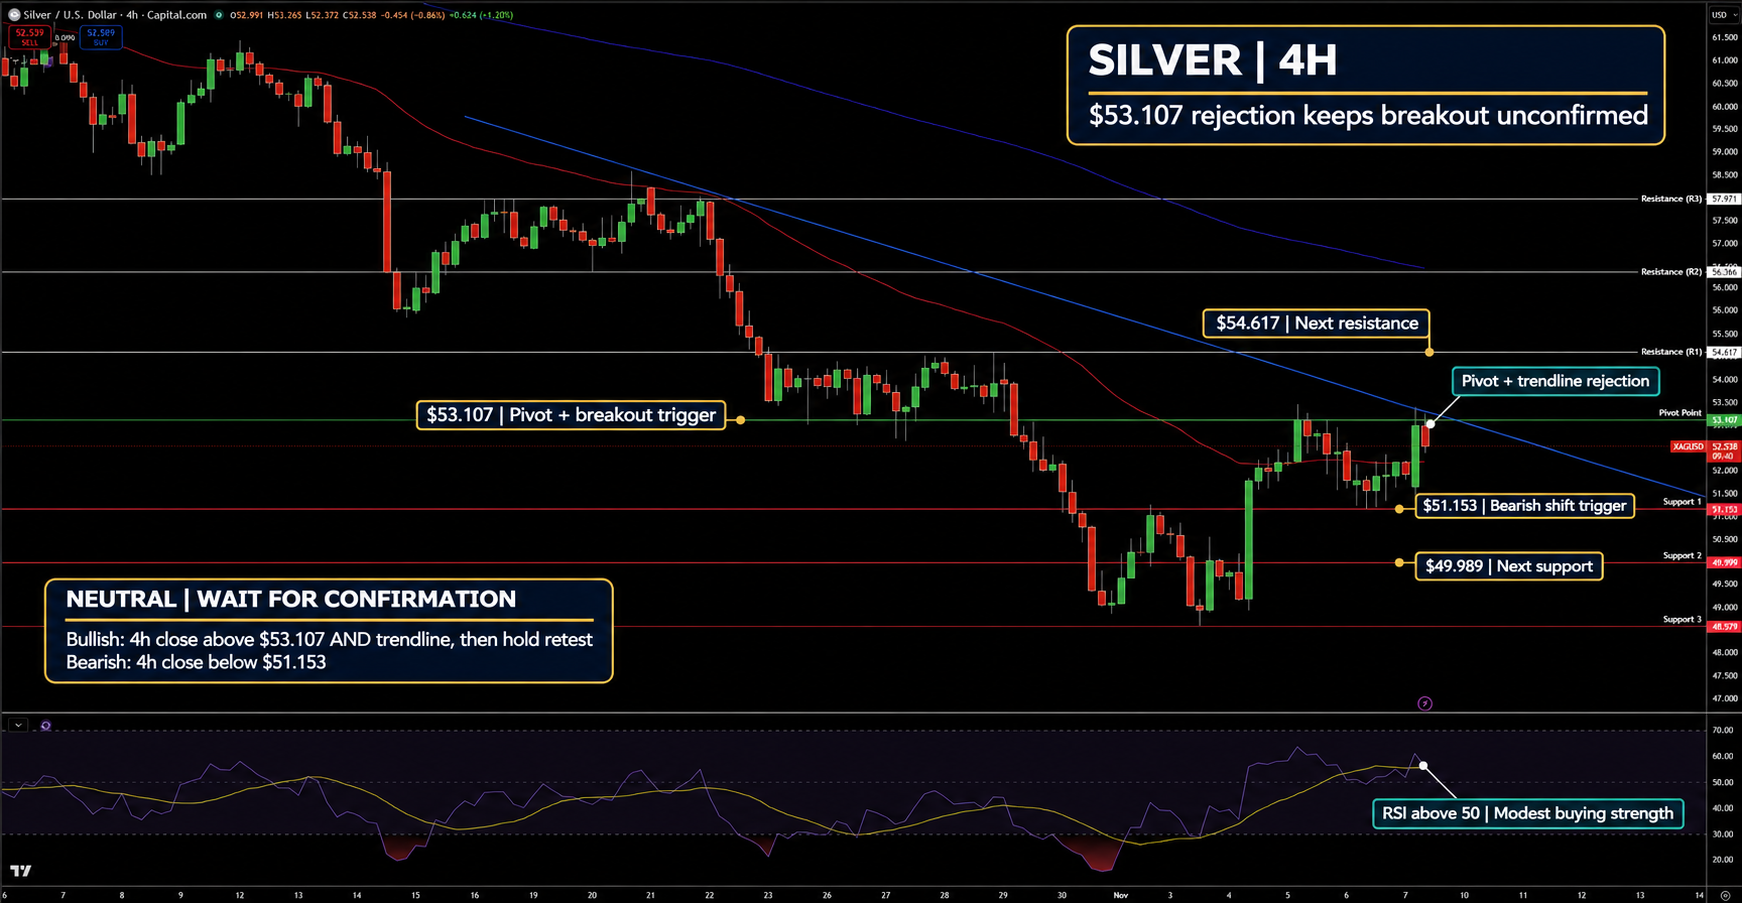
Silver trades near $52.538 per troy ounce on the four-hour Capital.com chart after another rejection around the $53.107 pivot, a marked reference level for the setup, and descending trendline. Price remains above the red moving average, so the latest rejection has slowed the rebound without yet confirming a support breakdown.
A four-hour close above $53.107 and the trendline would expose $54.617 resistance. Support stands at $51.153, followed by $49.989 if the rebound unwinds. RSI holds above 50 but has retreated toward its signal line, suggesting modest buying strength. I remain neutral until a breakout is confirmed. Holding above $53.107 after a retest would turn the bias bullish; a close below $51.153 would shift it bearish.