Gold Treads Water as Fed Focus Shifts to December
Precious metals followed the US interest rate path on Tuesday rather than geopolitical events. A pause in October is almost certain, and the focus is on December.

Gold: The Rate Path Is Back in Charge
Gold declined slightly in early Asian trade as investors focused on the upcoming FOMC meeting on October 27 and 28, and next week’s inflation data. While the consensus is the Fed will hold next week’s meeting, there is a 94% chance the central bank will increase rates in December. With the Fed Funds Rate in the 3.75-4.00% range after September’s hike, the opportunity cost of holding non-yielding gold is increasing.
Expectations for further rate increases is building overseas as well. Bank of Japan Governor Kazuo Ueda said he believes underlying inflation is approaching the Bank of Japan’s 2% target and increasing global demand for AI is putting further upward pressure on inflation. He signaled there is still room for further rate hikes.
Physical demand is rising. Last week, gold traded at a premium in India for the first time in over 3 months, due to lower prices drawing buyers for the festive season. Supply is still low; the value of gold imports to India in September 2026, fell by about 80% when compared to September 2025.
Silver: Imports Slow as the Demand Mix Shifts
September 2026 imports of silver by India fell 49% from a year ago. This change is worth noting since India is one of the world’s biggest silver buyers. The demand mix is also changing structurally. The Silver Institute expects industrial silver demand to fall 3% in 2026, as the negative impact of solar manufacturers’ switching is greater than the positive impact of the data centers, grid and auto infrastructure.
Gold Price Forecast
Every new Gold analysis as it publishes, today's technical signal and key levels, live price — on one page.
See all Gold forecastsSilver also faces rate hike headwinds. Yet, some safe haven flows are still supported by the Middle East tensions.
Gold Technical Analysis: XAU/USD Holds $4,119 as $4,147 Comes Into Focus
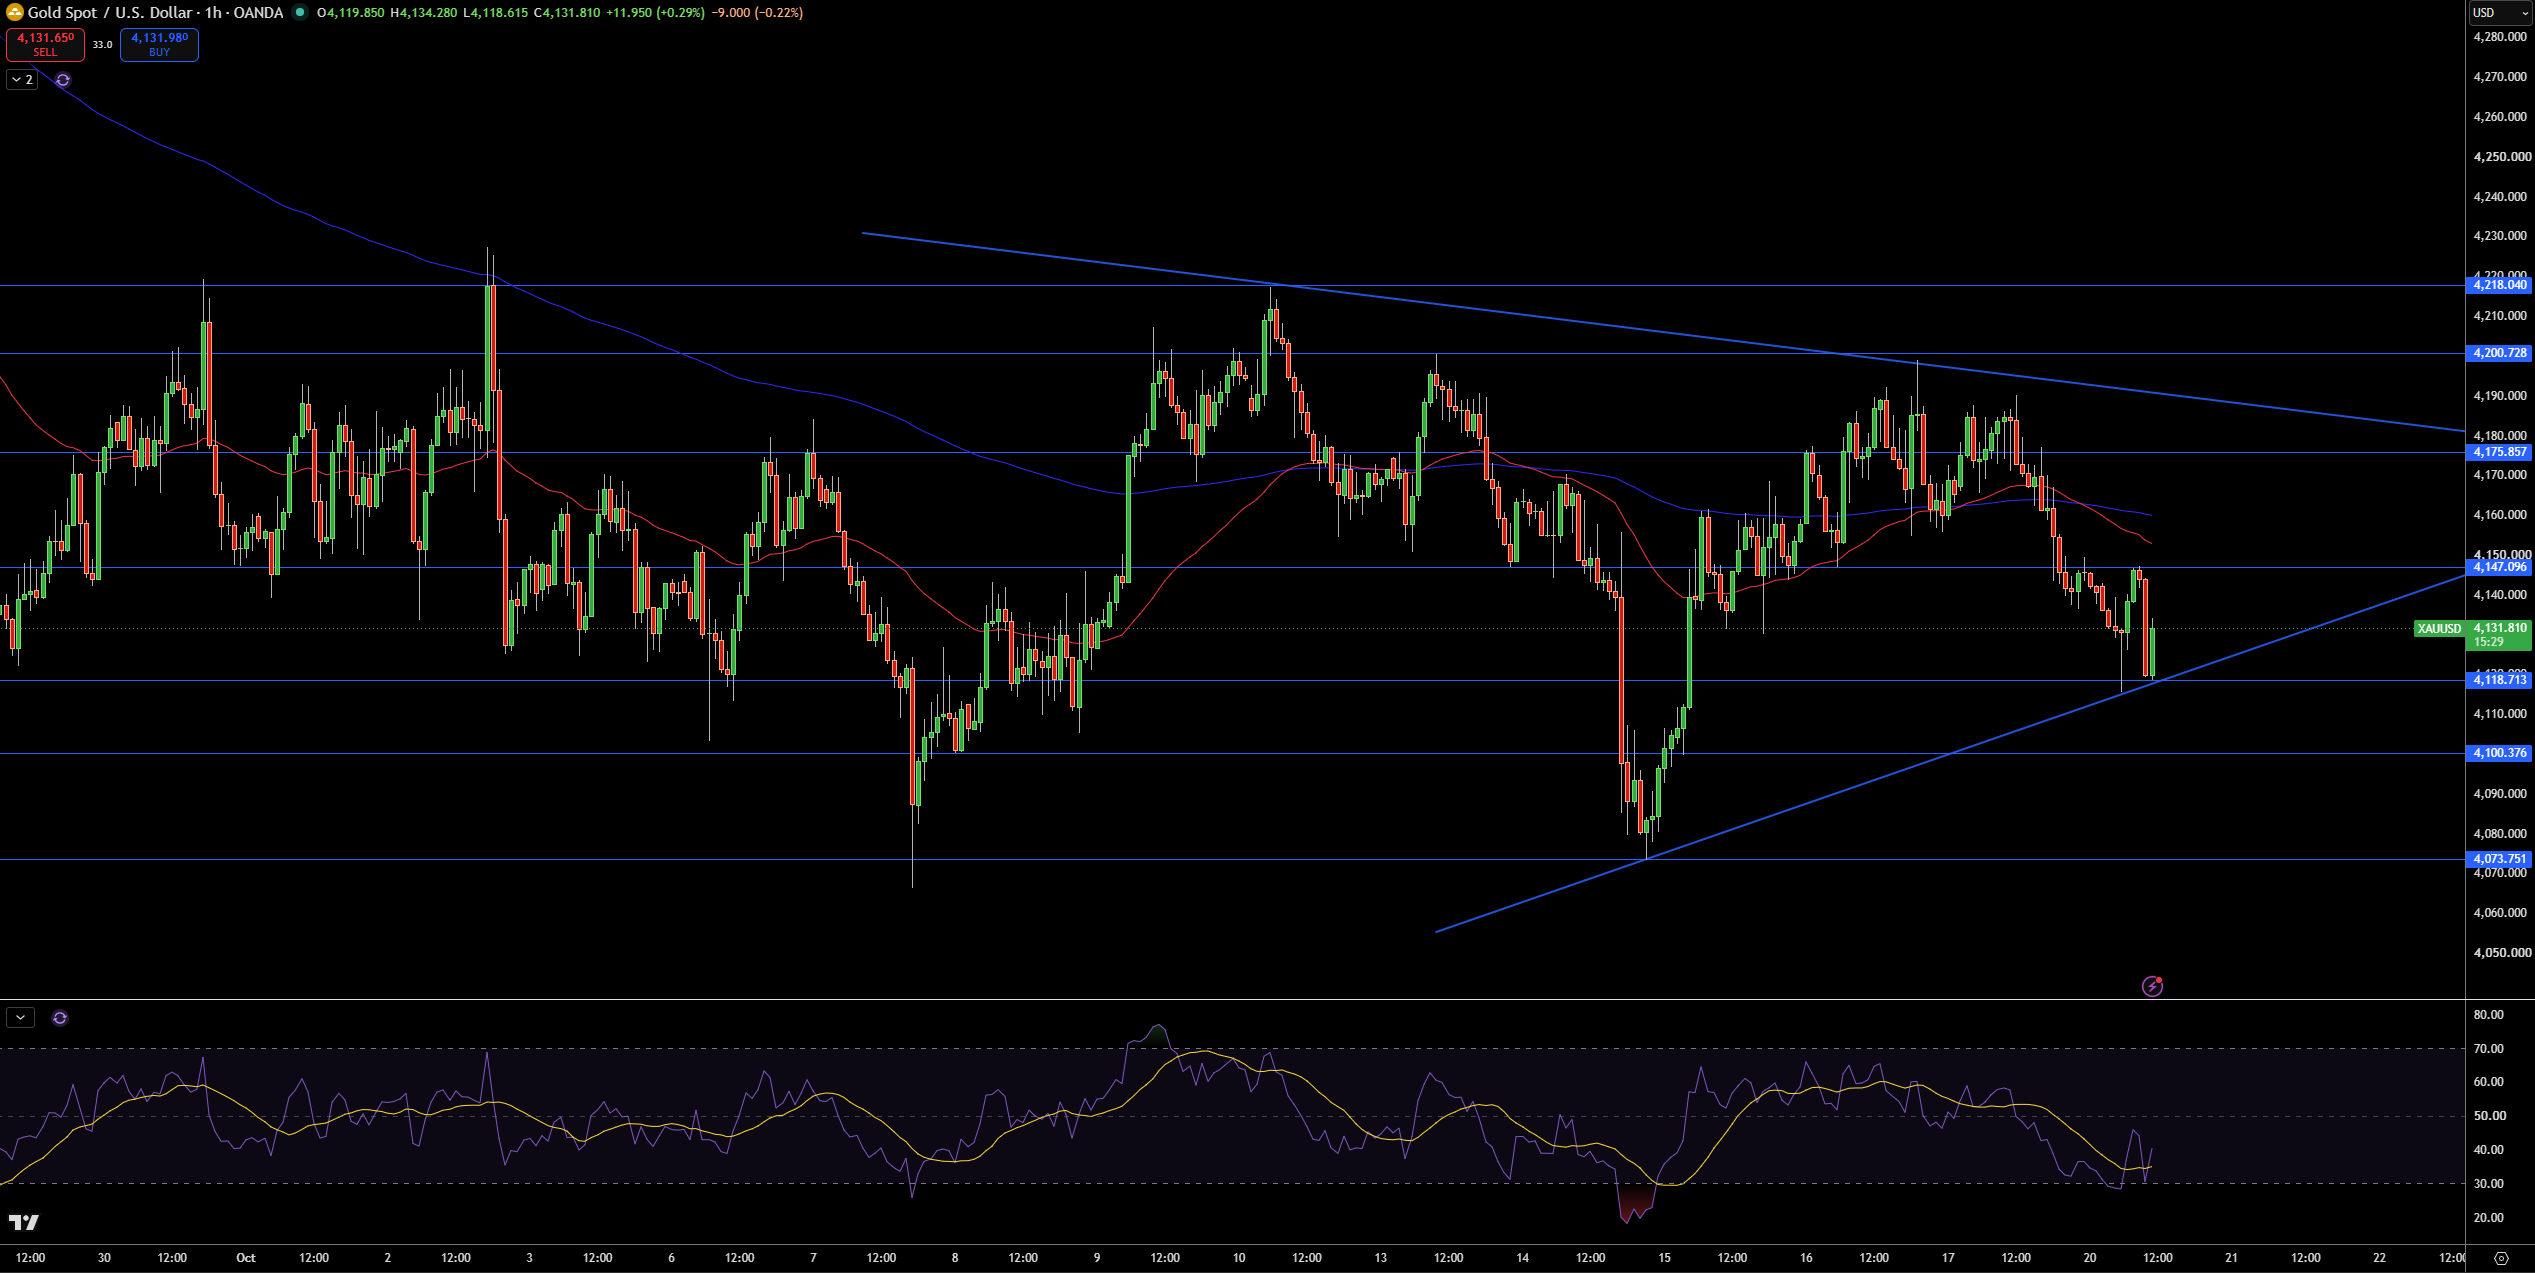
Gold (XAU/USD) is currently trading at approximately $4,132. Looking at the 1H chart, we can see a symmetrical triangle is forming between the falling trend line from the high at $4,218 and the rising trend line from the low at $4,074. Price has bounced from the $4,119 area, which is where the lower trend line of the triangle touches. Gold is trading below both the 50 and 200-hour moving averages, and the 50 hour moving average is below the 200-hour moving average. Therefore, sellers are slightly in control.
I see $4,147 as the first resistance level. A break above $4,147 would open the way to $4,176 and the upper trend line of the triangle. Vice versa, the next support area is $4,119 and the rising trend line. A break below that area would open the way to $4,100 and the low at $4,074.
RSI is currently at around 40 and just turned up and crossed above its signal line. This shows that selling pressure is easing, but the direction of the trend is not changing. Taking everything into account, I am neutral to slightly bearish until we see a move above $4,176, which would strengthen the case for a triangle breakout, or a break below $4,119, which would confirm a triangle pattern break down.
Silver Technical Analysis: XAG/USD Holds $57.39 as Trendline Resistance Is Retested
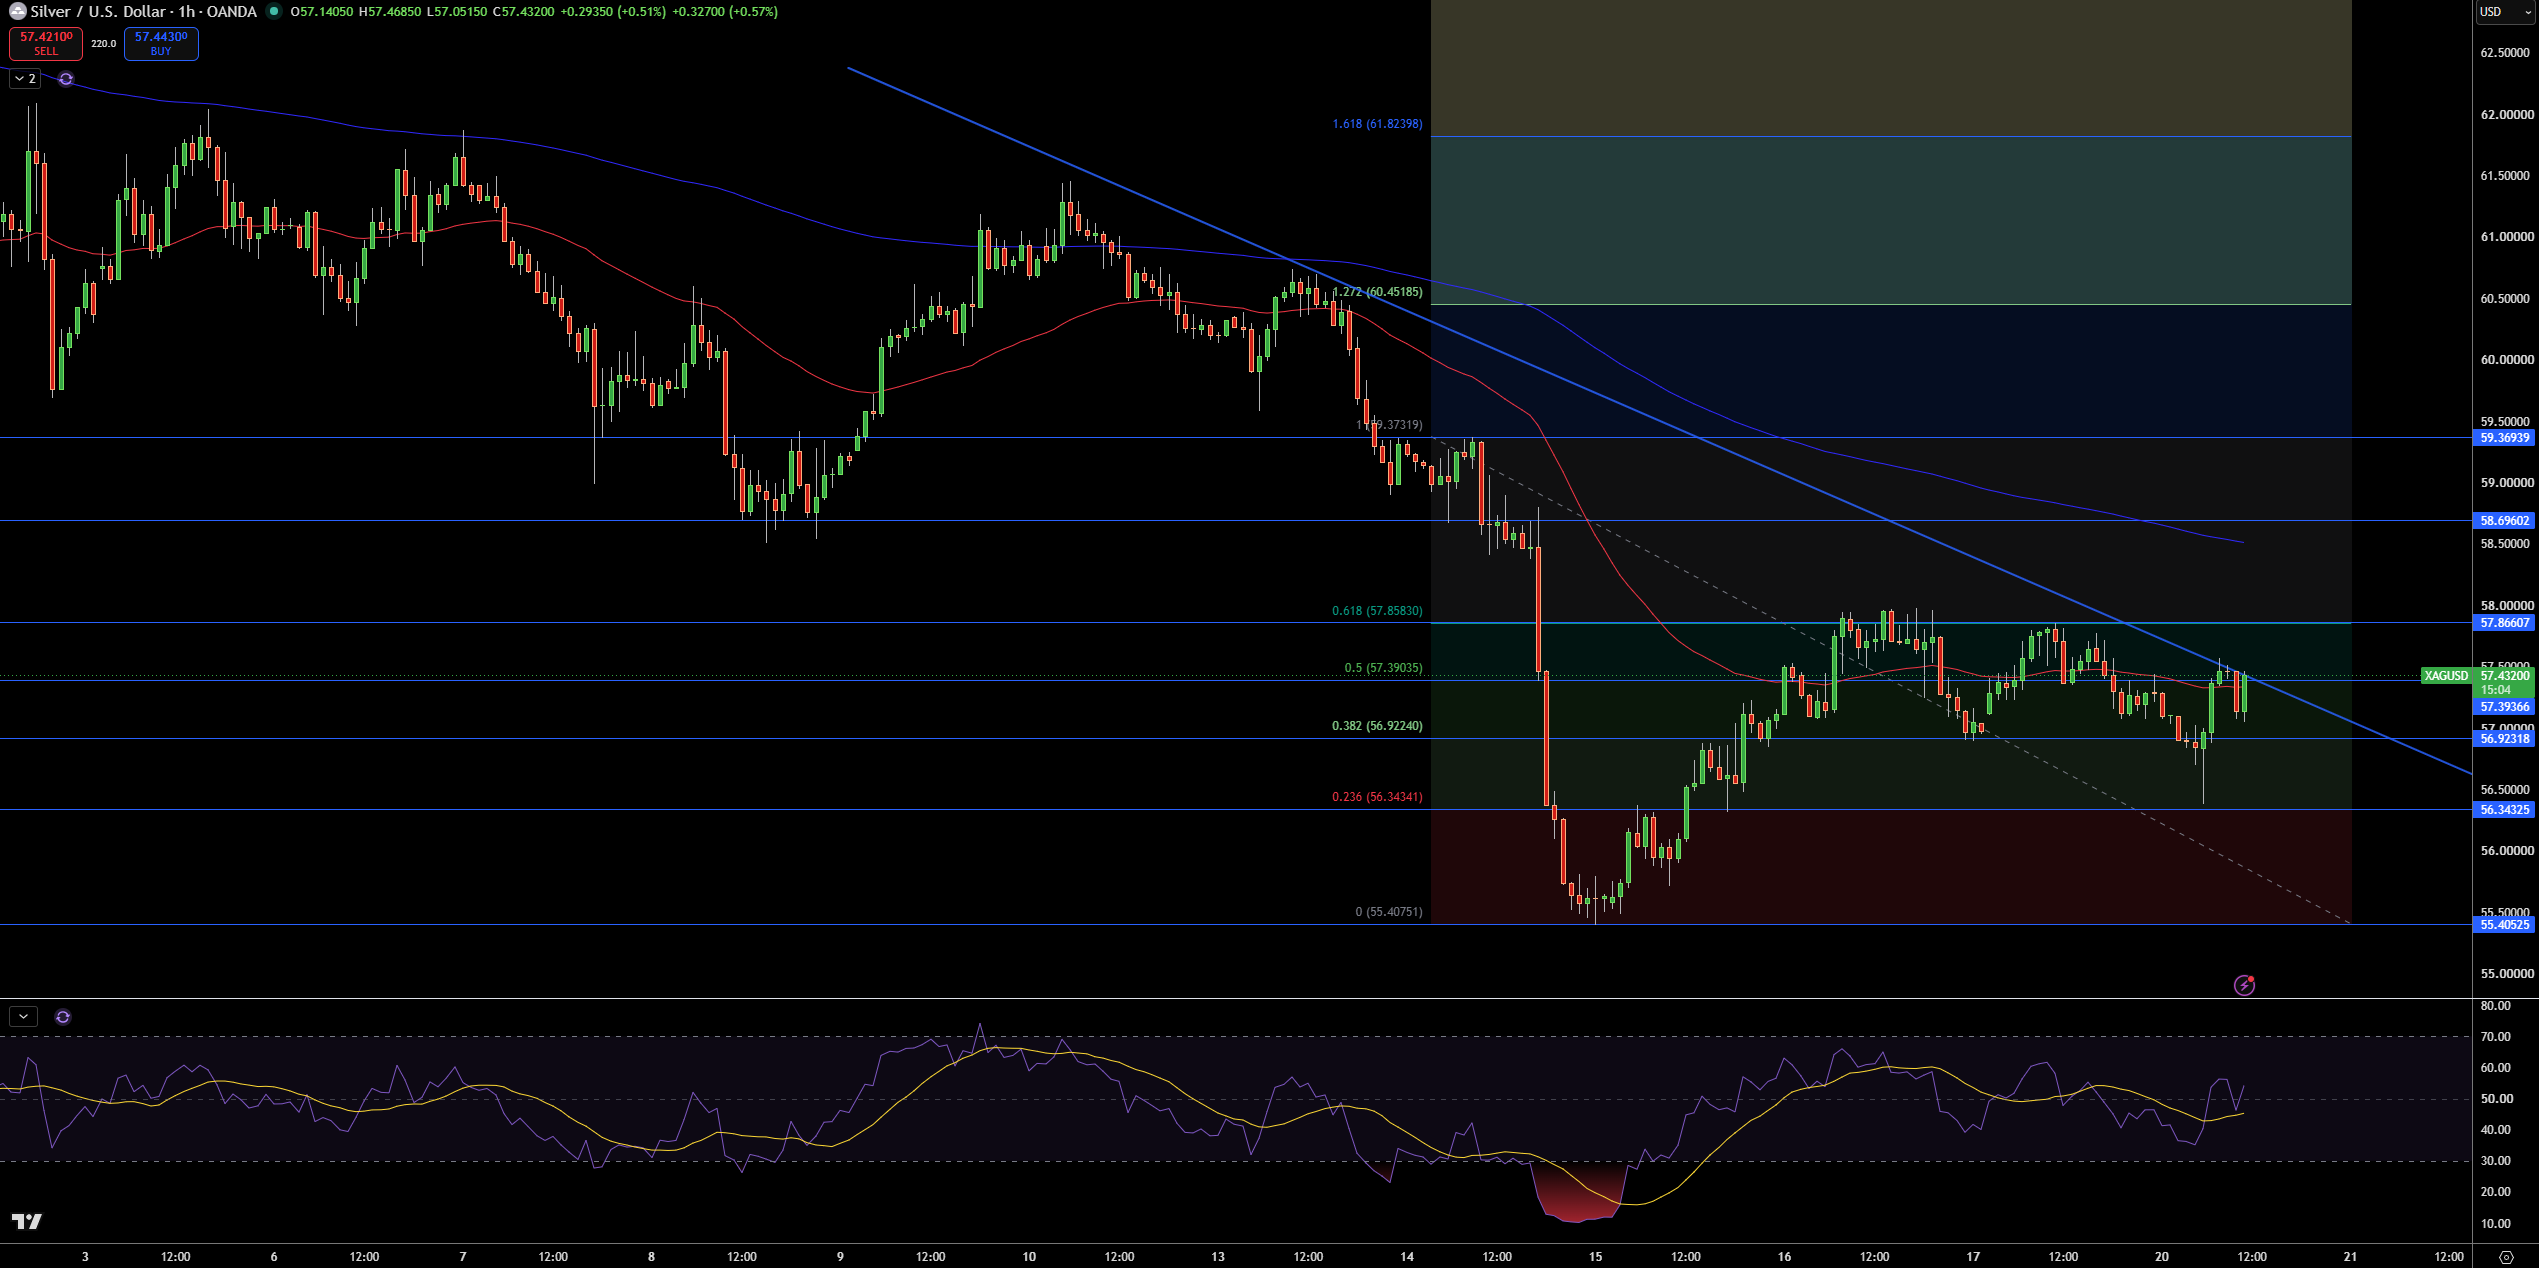
Silver is currently around $57.43 in the 1-hour chart. The price is trying to break the descending trendline from the early October highs, while bumping into the 50% Fibonacci retracement level at $57.39. Silver has been in a range from $56.92 to $57.86 for a few days now. The recent low at $56.34 was bought, and the price has broken the 20 period moving average, while the 100 period moving average is still falling and is near $58.50.
My first resistance is the trendline, followed by the 61.8% Fibonacci level at $57.86, and then $58.70 and $59.37. Potential support is at $57.39, then $56.92 (38.2%), and $56.34 (23.6%).
The RSI is at 54, and has a rising trendline from 45. The trendline suggests that the price is testing resistance and momentum is improving. I am neutral with a slight bias toward the bulls as long as Silver is above $56.92. $57.86 should confirm a breakout of the trendline. A breakdown of $56.92 should retest $56.34.