


Gold Holds Near Key Level as Fed Decision Looms
Gold and silver started the Fed’s two-day meeting on a cautious footing on Tuesday. Investors are weighing softer oil against the risk of a December rate hike, while buyers in India are using the lower prices to stock up.
Gold: Waiting on Warsh
Gold and silver traded lower on Tuesday as investors waited for the Fed’s decision, Business Standard reported, with Comex gold down $10.90 at $4,027.50 an ounce. The Fed is expected to hold its benchmark rate at 3.75% to 4.00% on Wednesday after hiking in September. Even so, CME’s FedWatch tool, which turns futures prices into rate odds, showed about a 73% chance of at least one hike by December on Monday.
This meeting comes without new economic forecasts from policymakers, so Chair Kevin Warsh’s press conference will be the main signal. Thursday then brings third-quarter GDP and September PCE inflation, the Fed’s preferred inflation gauge.
Energy is still the bigger pressure on gold. Higher oil has revived inflation fears and strengthened bets on more Fed hikes, which is why gold posted its steepest weekly drop since June last week. Higher rates hurt gold because it pays no interest.
Physical Demand: India Steps In
Lower prices are pulling Indian buyers back ahead of Diwali and the wedding season. Indian gold ETFs, funds that track the gold price and trade like shares, took in about ₹4,450 crore in September, the most in seven months, according to the World Gold Council. Gold also traded at a premium in India this month for the first time in more than three months as jewellery demand picked up, Reuters reported, meaning local buyers paid more than the official domestic price.
Gold Price Forecast
Every new Gold analysis as it publishes, today's technical signal and key levels, live price — on one page.
See all Gold forecastsGlobally, gold ETFs drew a record $31bn in the third quarter. That kind of dip buying gives gold a cushion, but it has not been enough to turn the rate story around.
Silver: Still the Weaker Link
Silver is trading near its lowest levels since November 2025 after last week’s sharper fall. Because it is both an investment metal and an industrial metal, it is more exposed than gold if the Fed signals that tighter policy is coming.
Gold Technical Analysis: XAU/USD Holds $3,975 as $4,039 Caps the Rebound
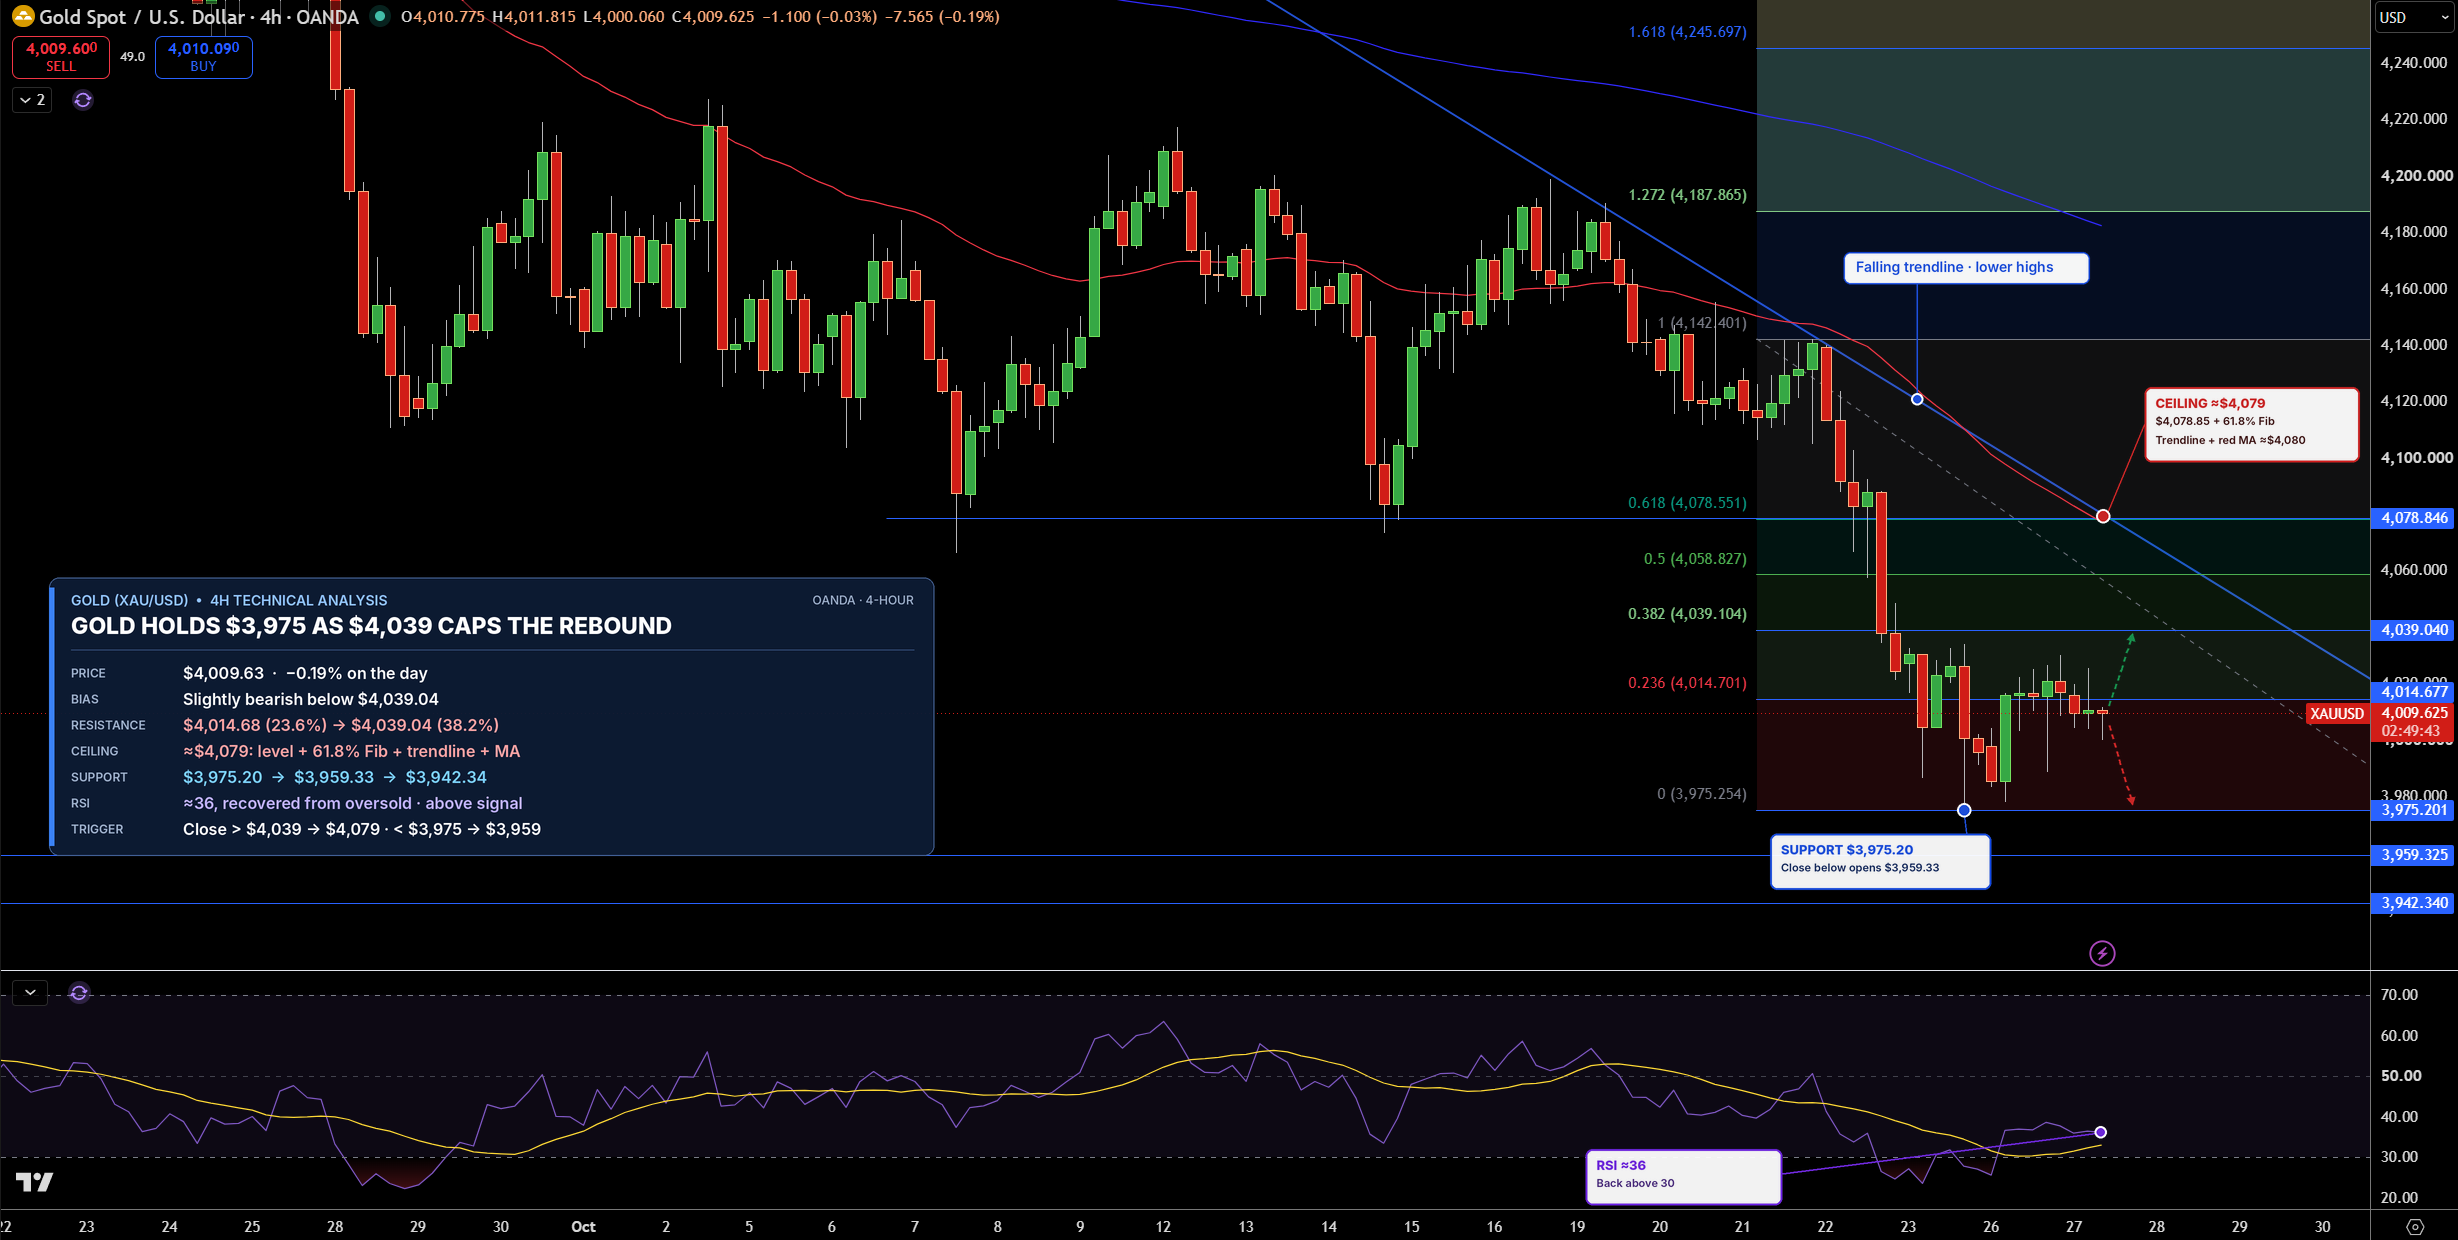
Gold is trading near $4,010 on the 4-hour chart. After last week’s drop from $4,142, prices have moved sideways between $3,975 and $4,015. A falling trendline, a line connecting lower highs, still caps every bounce.
Resistance, where sellers tend to step in, is $4,015, then $4,039, a Fibonacci level that shows how much of the drop has been recovered. Support, where buyers tend to step in, is $3,975, then $3,959.
RSI, which measures the strength of recent buying and selling, is near 36 and turning up from oversold, meaning prices had fallen too fast. I keep a slight bearish lean while gold stays below $4,039. A close above it would open $4,079, while a drop below $3,975 would point to $3,959.
Silver Technical Analysis: XAG/USD Slips to $53.26 as $52.41 Comes Into Focus
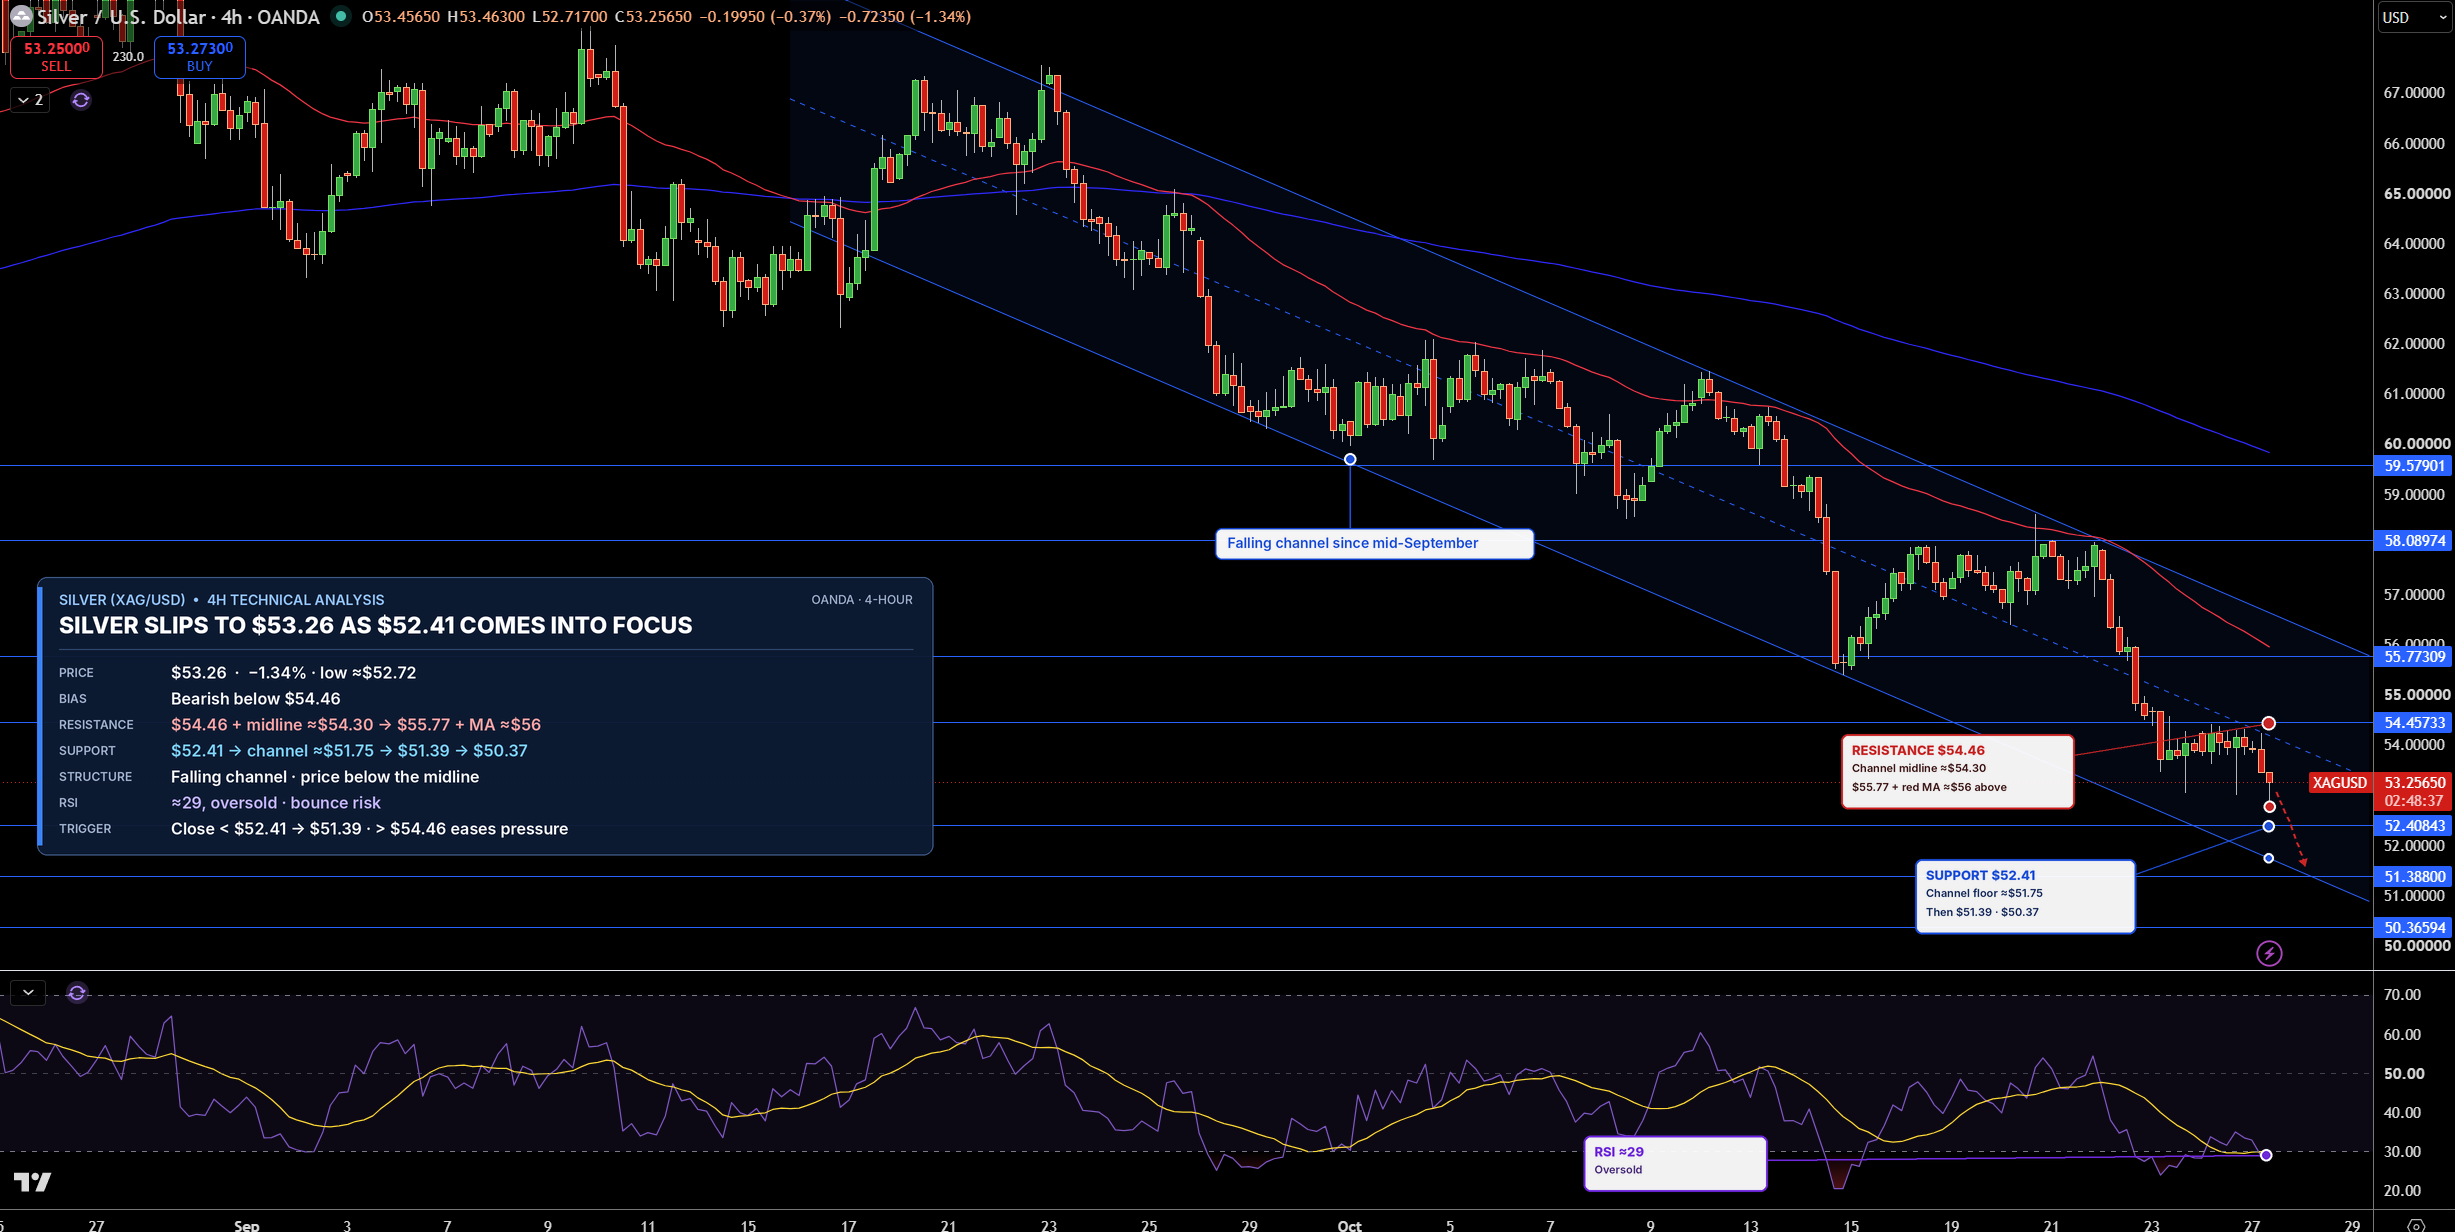
Silver is trading near $53.26 on the 4-hour chart, still inside a falling channel, two parallel lines that have guided prices lower since mid-September. After moving sideways near $54, it slipped to a fresh low near $52.70 today.
The first support is $52.41, then $51.39. On the upside, $54.46 is the first resistance, followed by $55.77.
RSI is near 29, which is oversold, so a short bounce is possible. In my view, silver stays bearish below $54.46. A close below $52.41 would open $51.39.