


Gold Slips to One-Week Low as Fed Hike Bets Harden
Gold touched its lowest level since November 4 on Thursday after hot US inflation data and hawkish Fed comments lifted the dollar and cemented expectations of a rate increase next month, Reuters reported. Spot gold was down 0.2% at $3,977.99 by 05:06 GMT, back below the $4,000 mark it held after Tuesday’s sell-off.
Gold: The Fed Chorus Grows Louder
Traders now fully price a Fed rate hike next month and another in March 2027, according to CME’s FedWatch tool, which turns futures prices into rate odds. The odds of a half-point move have also risen. Fed Governor Christopher Waller said a 0.3% core inflation reading in October would prompt him to consider a half-point hike in December, Reuters reported, and the CPI report delivered exactly that 0.3% rise in core prices, which leave out food and energy.
Other officials sounded the same note. Philadelphia Fed President Anna Paulson said the Fed has more rate increases ahead, and Vice Chair for Supervision Michelle Bowman stressed that bringing down inflation remains the central bank’s top priority, CNBC reported. Gold pays no interest, so higher rates raise the cost of holding it.
Analysts see little near-term relief. “The near-term macro setup for gold does not seem positive,” said ANZ’s Soni Kumari. Markets are “pointedly struggling for a follow through,” said Ilya Spivak, head of global macro at Tastylive. OCBC analysts were more balanced, saying they see “two-way risks in the near term” and are not turning bearish on gold’s medium-term prospects. US producer price data on Friday is the next test.
The Central Bank Floor
Official buying still offers support. Central banks bought 321 tonnes of gold in the third quarter, 42% more than a year earlier, the World Gold Council’s Gold Demand Trends report shows, and China’s central bank added about 25.8 tonnes in October, official data showed, its largest monthly increase since September 2023, according to market tracker Wind Info. In my view, that demand explains why each Fed-driven drop has slowed near $4,000 rather than turned into a rout, even if it cannot stop the slide on its own.
Gold Price Forecast
Every new Gold analysis as it publishes, today's technical signal and key levels, live price — on one page.
See all Gold forecastsSilver: Outpacing Gold on the Bounce
Spot silver climbed 3% to $53.03 on Wednesday, while spot gold rose 0.6%, Reuters reported, so the gold-to-silver ratio, the number of silver ounces needed to buy one ounce of gold, narrowed. That bounce has not held. In my view, silver remains exposed to the same rate pressure, along with the risk that tighter policy slows the industrial demand behind much of its use.
Gold Technical Analysis: XAU/USD Breaks Below Trendline as $3,944 Comes Into Focus
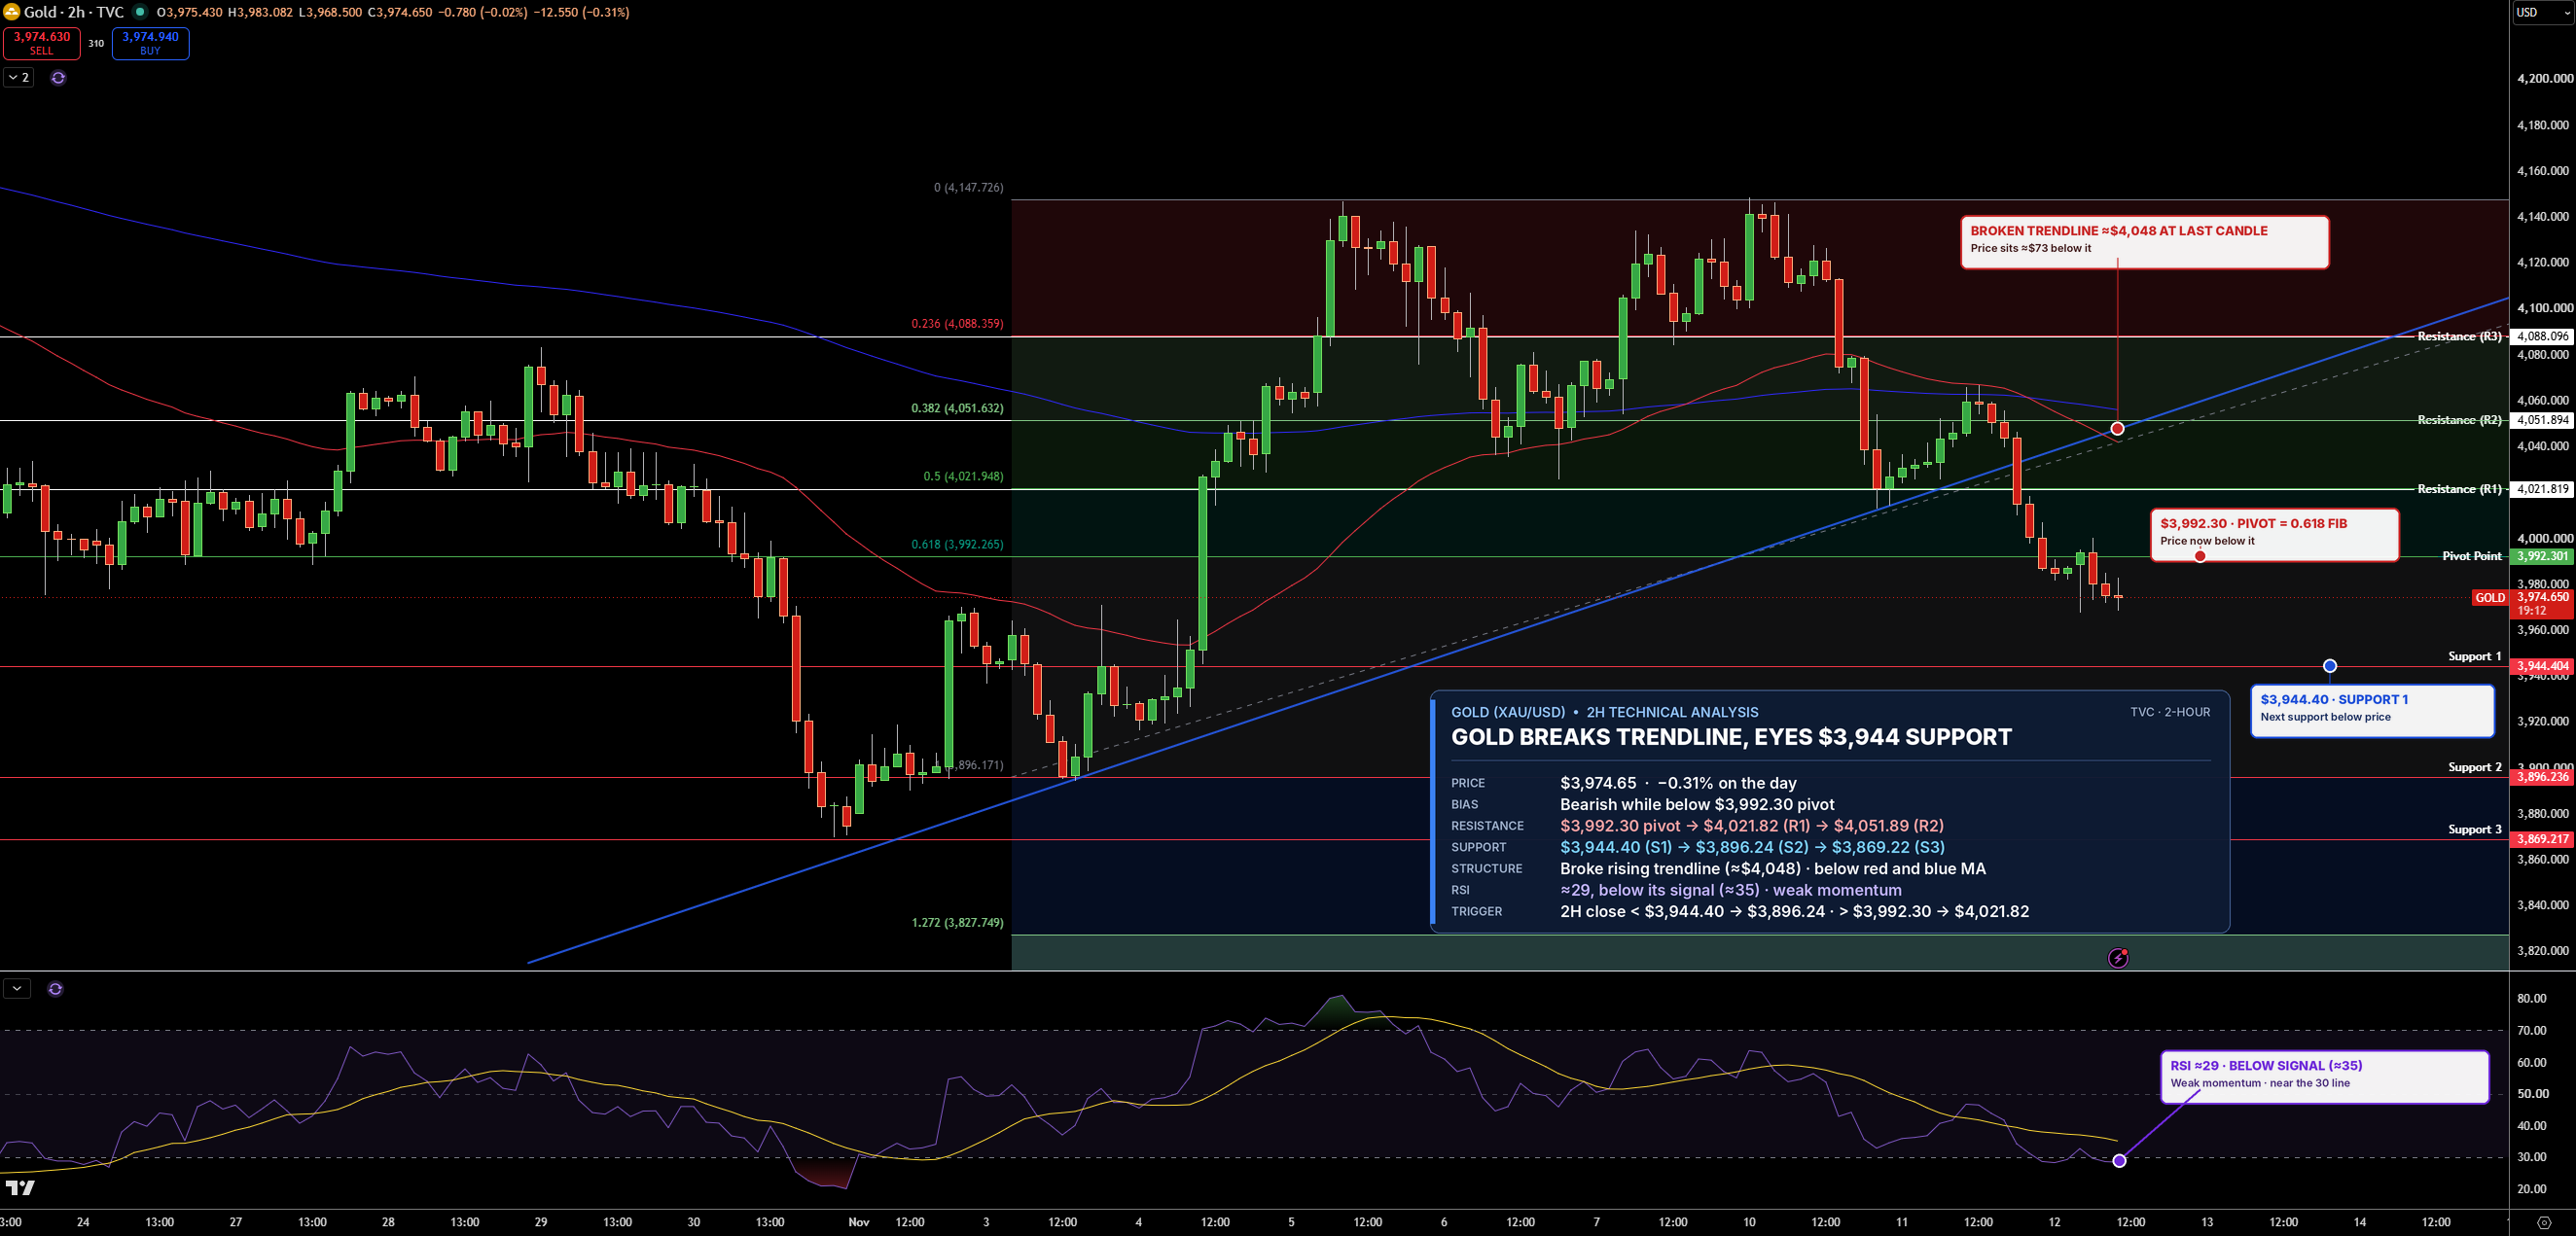
Gold is trading near $3,975 on the 2-hour chart. Prices have broken below the rising trendline, a line connecting higher lows since November 3, and slipped under $3,992, the pivot point, a level calculated from the previous period’s high, low and close that traders use to judge direction. Gold is below both moving averages, which track average prices over time, and the faster one has crossed below the slower one.
Support, where buyers may step in, is $3,944, then $3,896. Resistance, where sellers may return, is $3,992, then $4,022. RSI, a 0 to 100 gauge of buying and selling strength, is near 29, which is oversold, meaning prices fell very fast, so a short bounce is possible. I stay bearish while gold holds below $3,992. A close below $3,944 would open $3,896.
Silver Technical Analysis: XAG/USD Tests $51.14 After Trendline Rejection
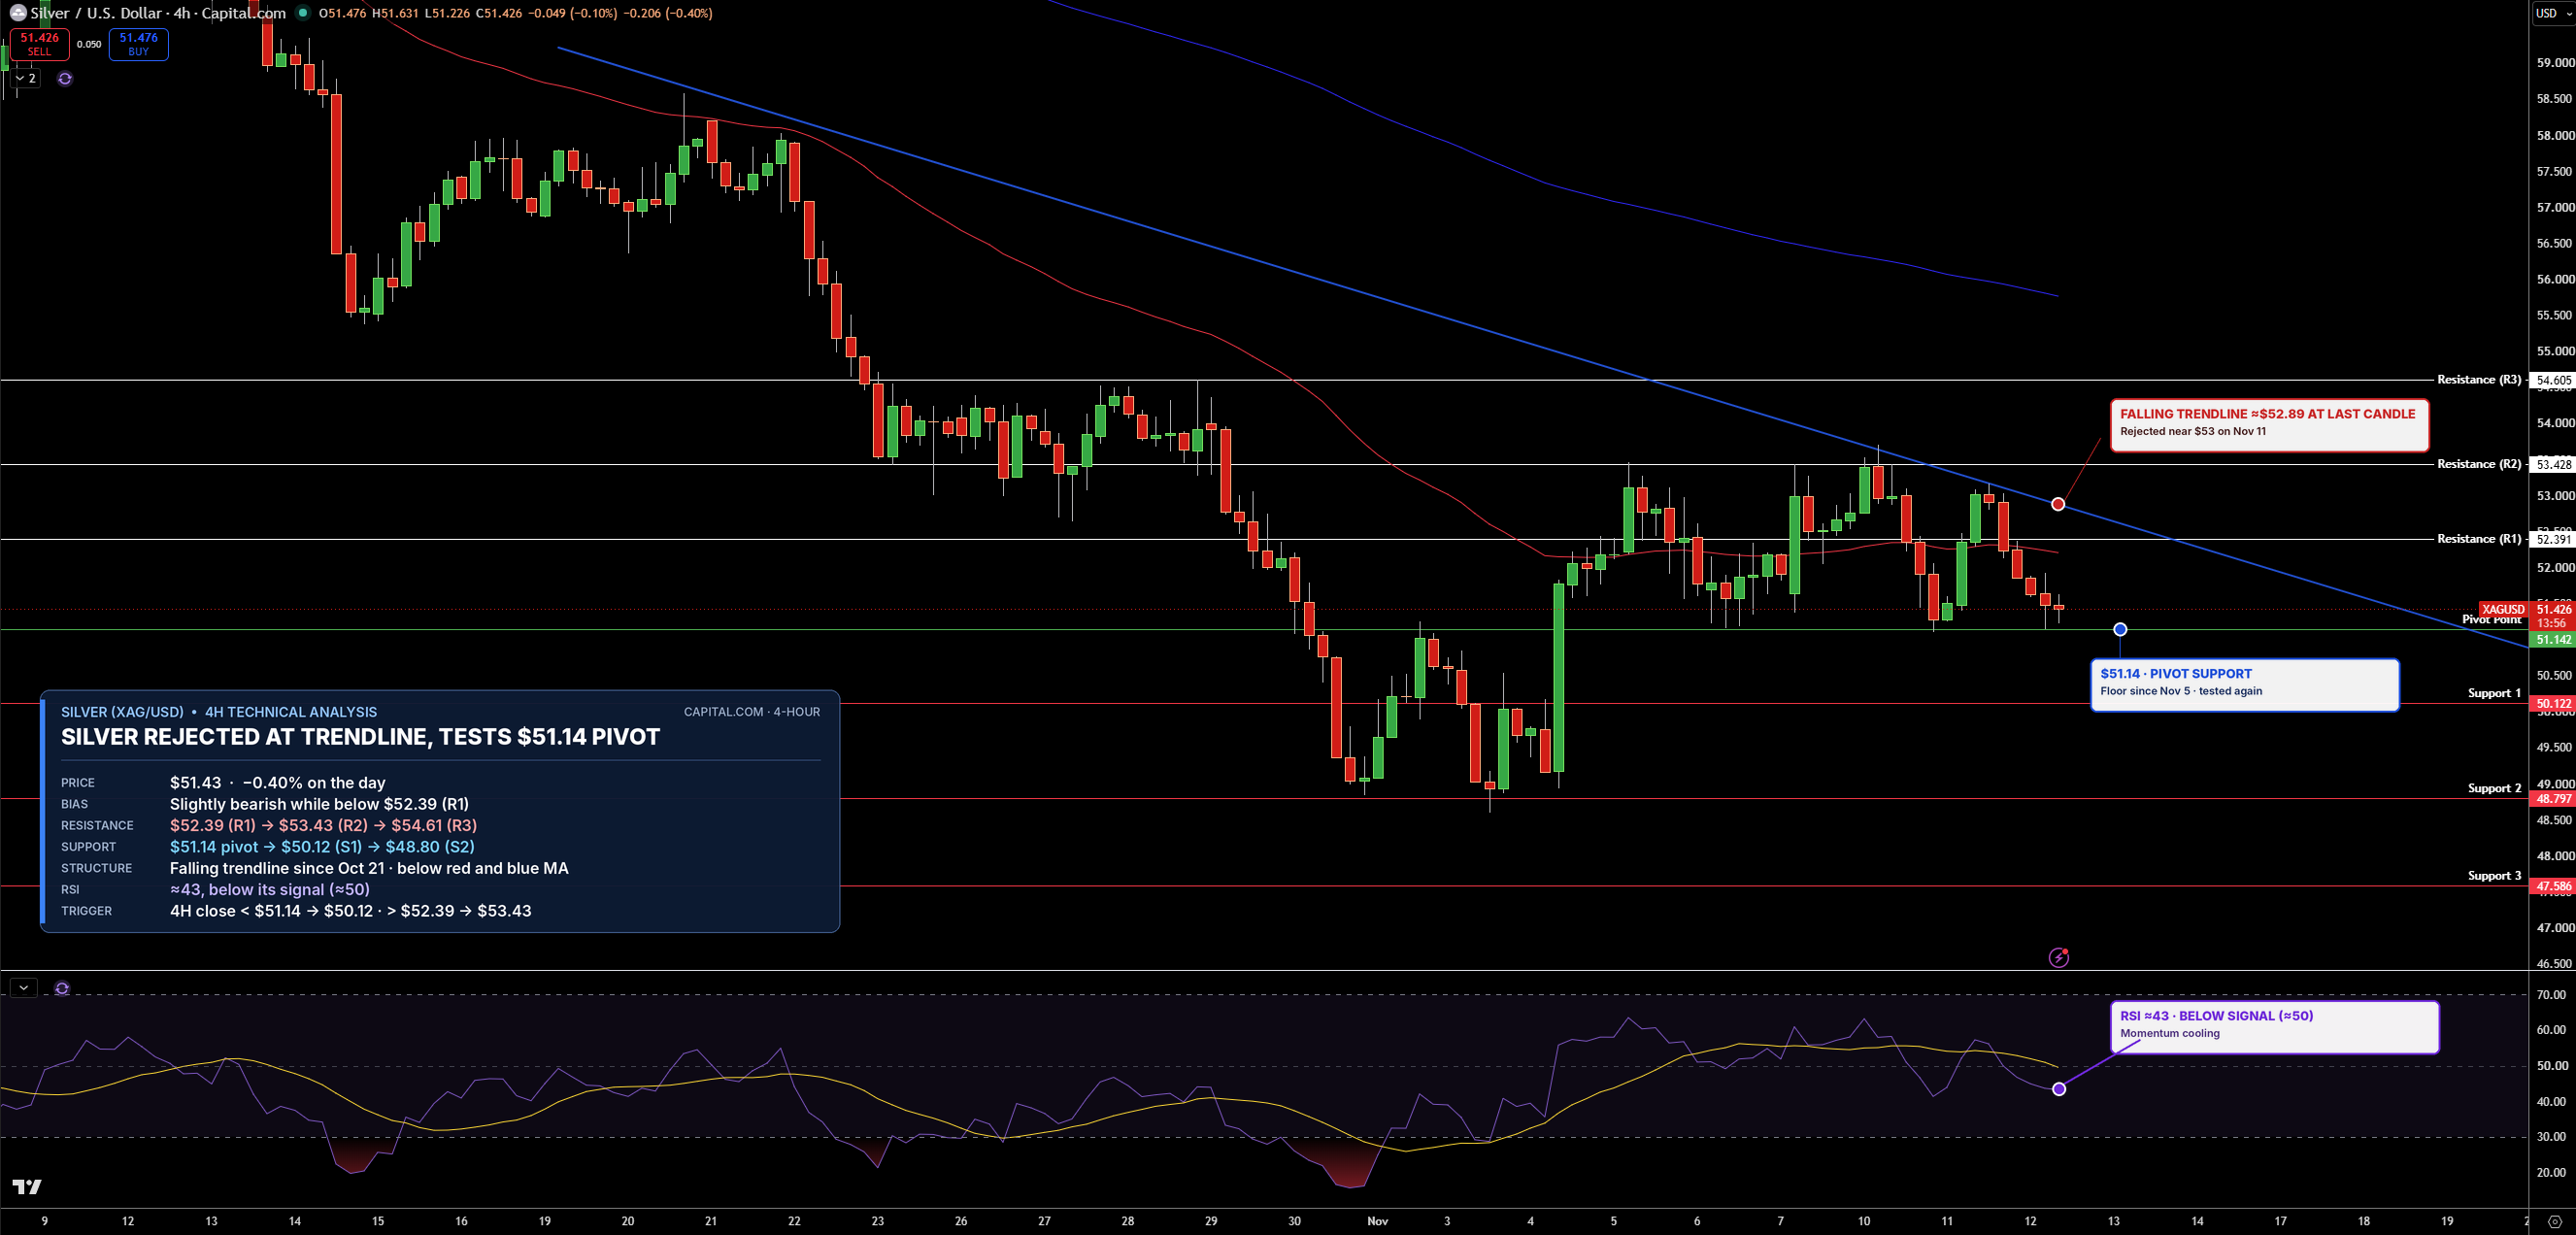
Silver is trading near $51.43 on the 4-hour chart. Sellers turned prices back again near $53 at the falling trendline from October 21, and silver has slipped below both moving averages. It is now testing its $51.14 pivot, which has held as a floor since November 5.
Support is $51.14, then $50.12. Resistance is $52.39, then $53.43. RSI is near 43 and below its signal line, a slower average of RSI. The bias is a slight bearish lean while silver stays below $52.39, and a close below $51.14 would open $50.12.