



Gold fell more than 1% on Wednesday to its lowest level since September 2025, as a firm dollar and expectations of higher US interest rates weighed on bullion, Reuters reported. Spot gold traded near $3,796.37 at 0242 GMT, and investors now await minutes of the Fed’s October 27 to 28 meeting, due at 1900 GMT.
Gold: Williams Keeps Hikes on the Table
New York Fed President John Williams said on Tuesday that the central bank will likely need to raise rates again to curb inflation, though he pushed back against a more aggressive path, Reuters reported. OANDA senior market analyst Kelvin Wong said gold’s weakness has been driven mainly by sentiment and technical factors, along with hawkish Fed signals and rising Treasury yields that have lifted the dollar. The dollar held near a 19-month high, which makes bullion more expensive for buyers holding other currencies.
Traders see a 95.7% chance of a quarter-point Fed hike in December and a 4.3% chance of a half-point move, according to CME’s FedWatch tool, which turns futures prices into rate odds. Gold pays no interest, so higher rates raise the cost of holding it.
Tuesday’s data gave the Fed little reason to back off. US retail sales rose 0.2% in October, the Census Bureau said, while the control group, which strips out volatile items and feeds into GDP, jumped 0.6%. Even Williams’ resistance to faster hikes did not stop the slide, which in my view shows how firmly a December move is now priced.
Silver: Selling Deepens
Silver fell 2.9% to $46.01 on Wednesday, with platinum down 1.3% and palladium 1.9% lower, Reuters reported.
Gold Price Forecast
Every new Gold analysis as it publishes, today's technical signal and key levels, live price — on one page.
See all Gold forecastsGold Technical Analysis: XAU/USD Breaks Below $3,836 as $3,781 Support Is Tested
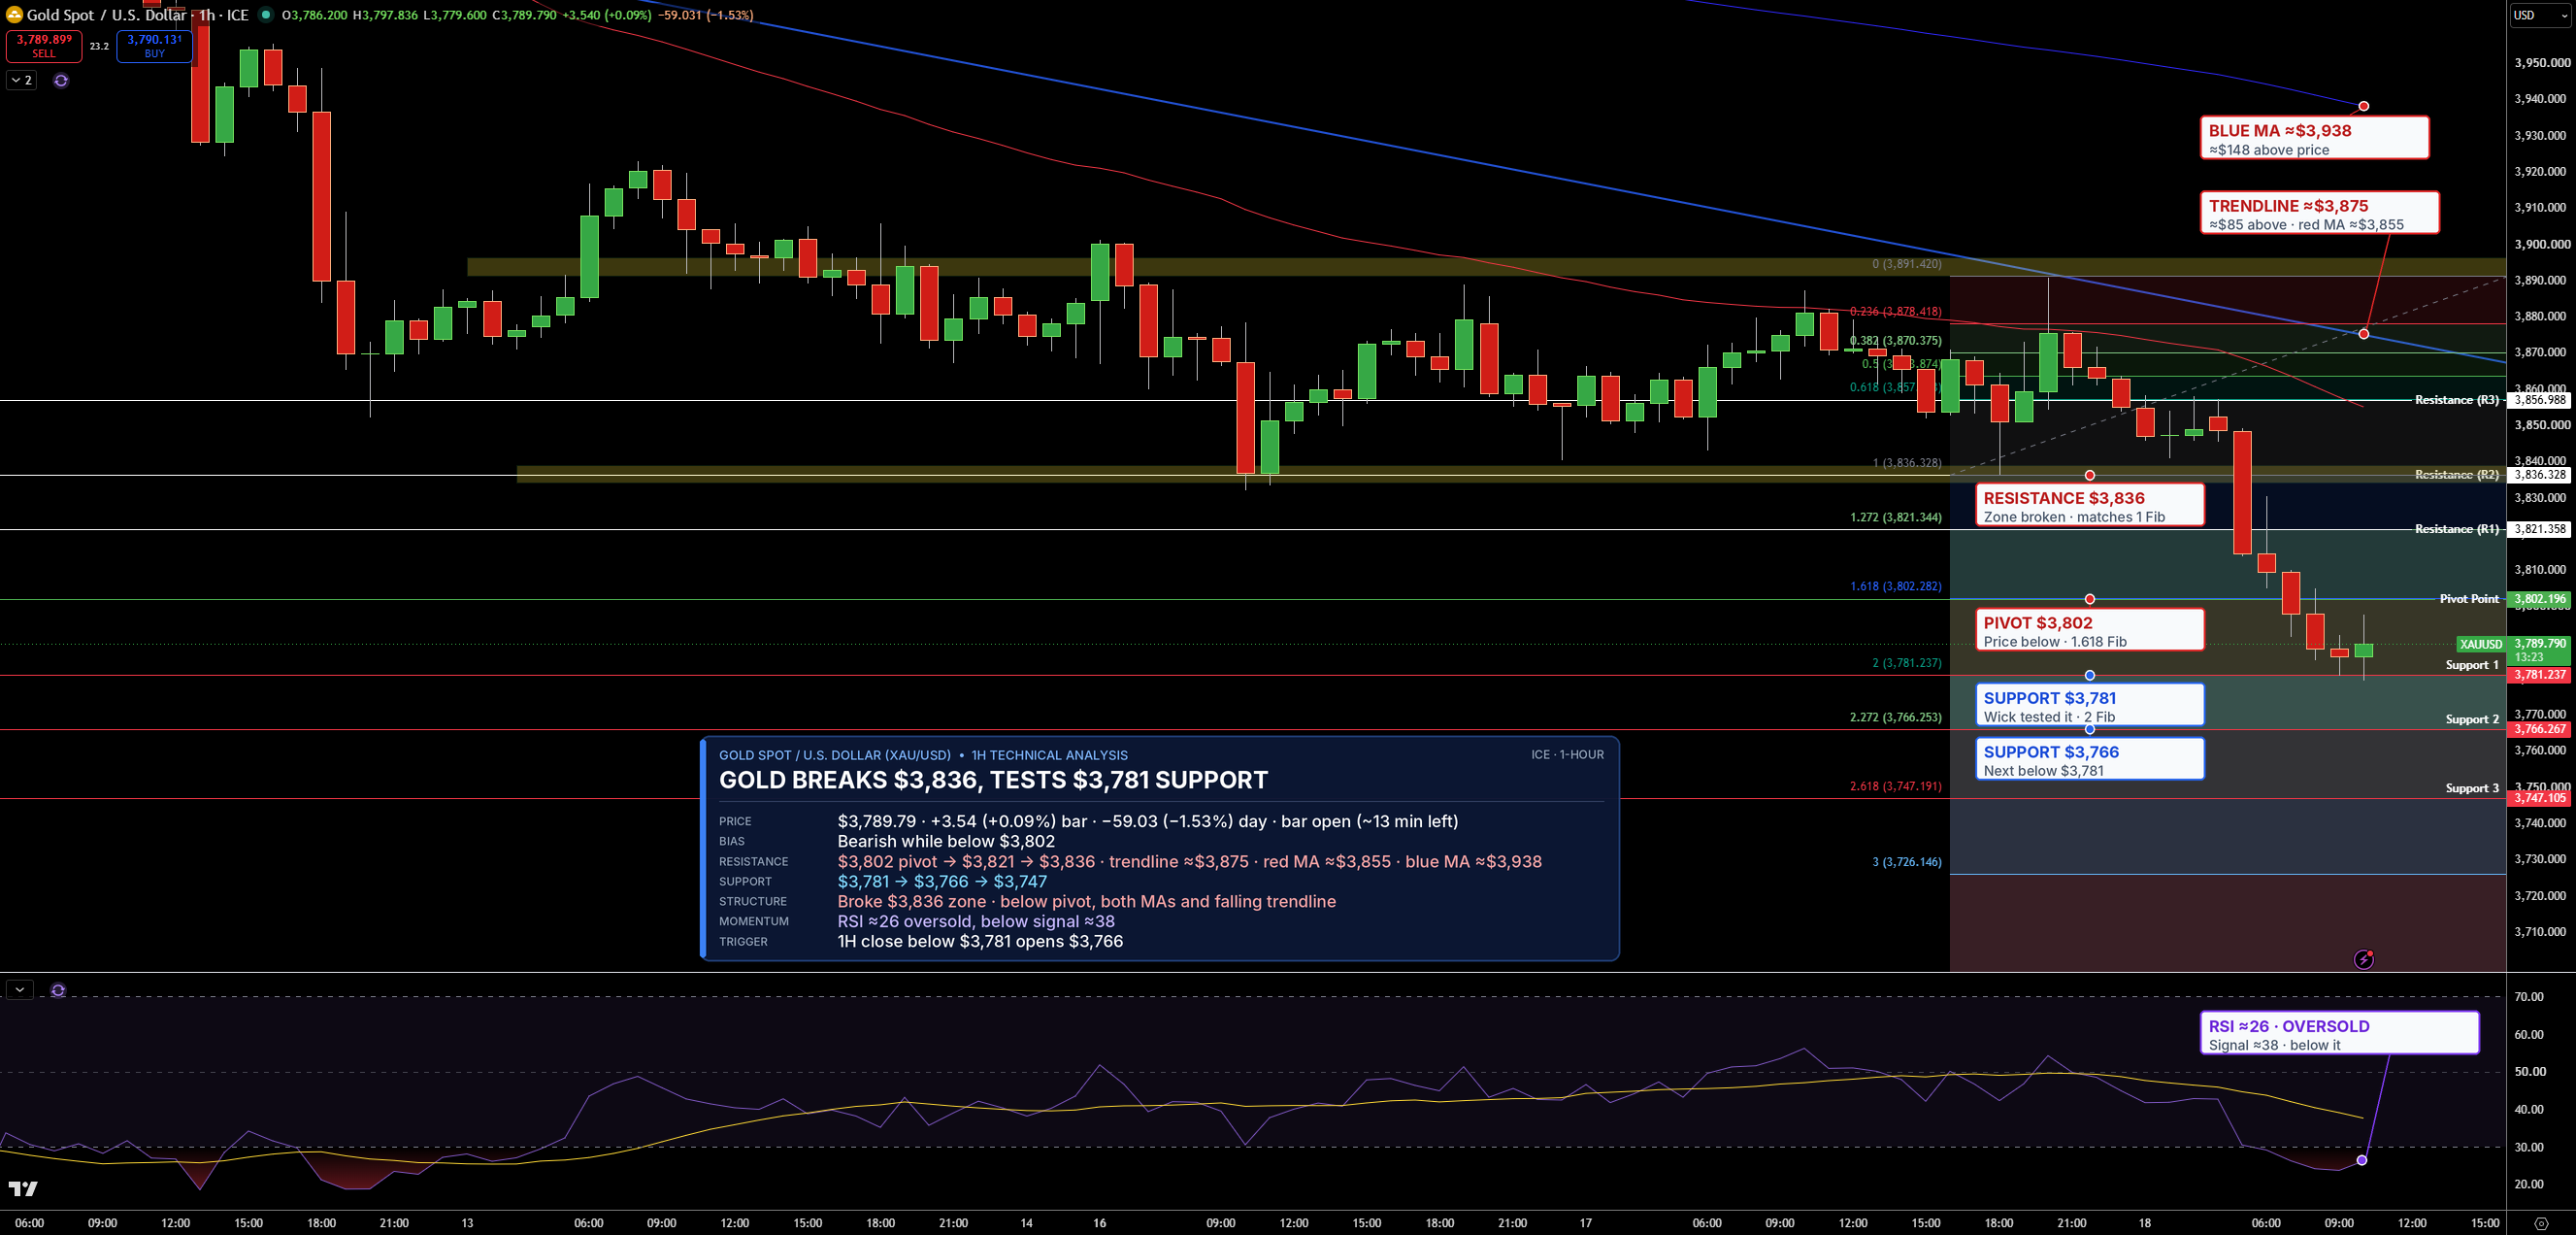
Gold is trading near $3,790 on the 1-hour chart after breaking below the $3,836 zone, a floor that had held in recent sessions. Prices have also fallen under $3,802, the pivot point, a level calculated from the previous period’s high, low and close that traders use to judge direction. Gold remains below both moving averages, which track average prices over time, and under a falling trendline.
Support, where buyers may step in, is $3,781, then $3,766. Resistance, where sellers may return, is $3,802, then $3,821. RSI, a 0 to 100 gauge of buying and selling strength, is near 26, which is oversold, meaning prices fell very fast, so a short bounce is possible. I stay bearish while gold holds below $3,802. A close below $3,781 would open $3,766.
Silver Technical Analysis: XAG/USD Bounces From $45.74 Pivot After Sharp Drop
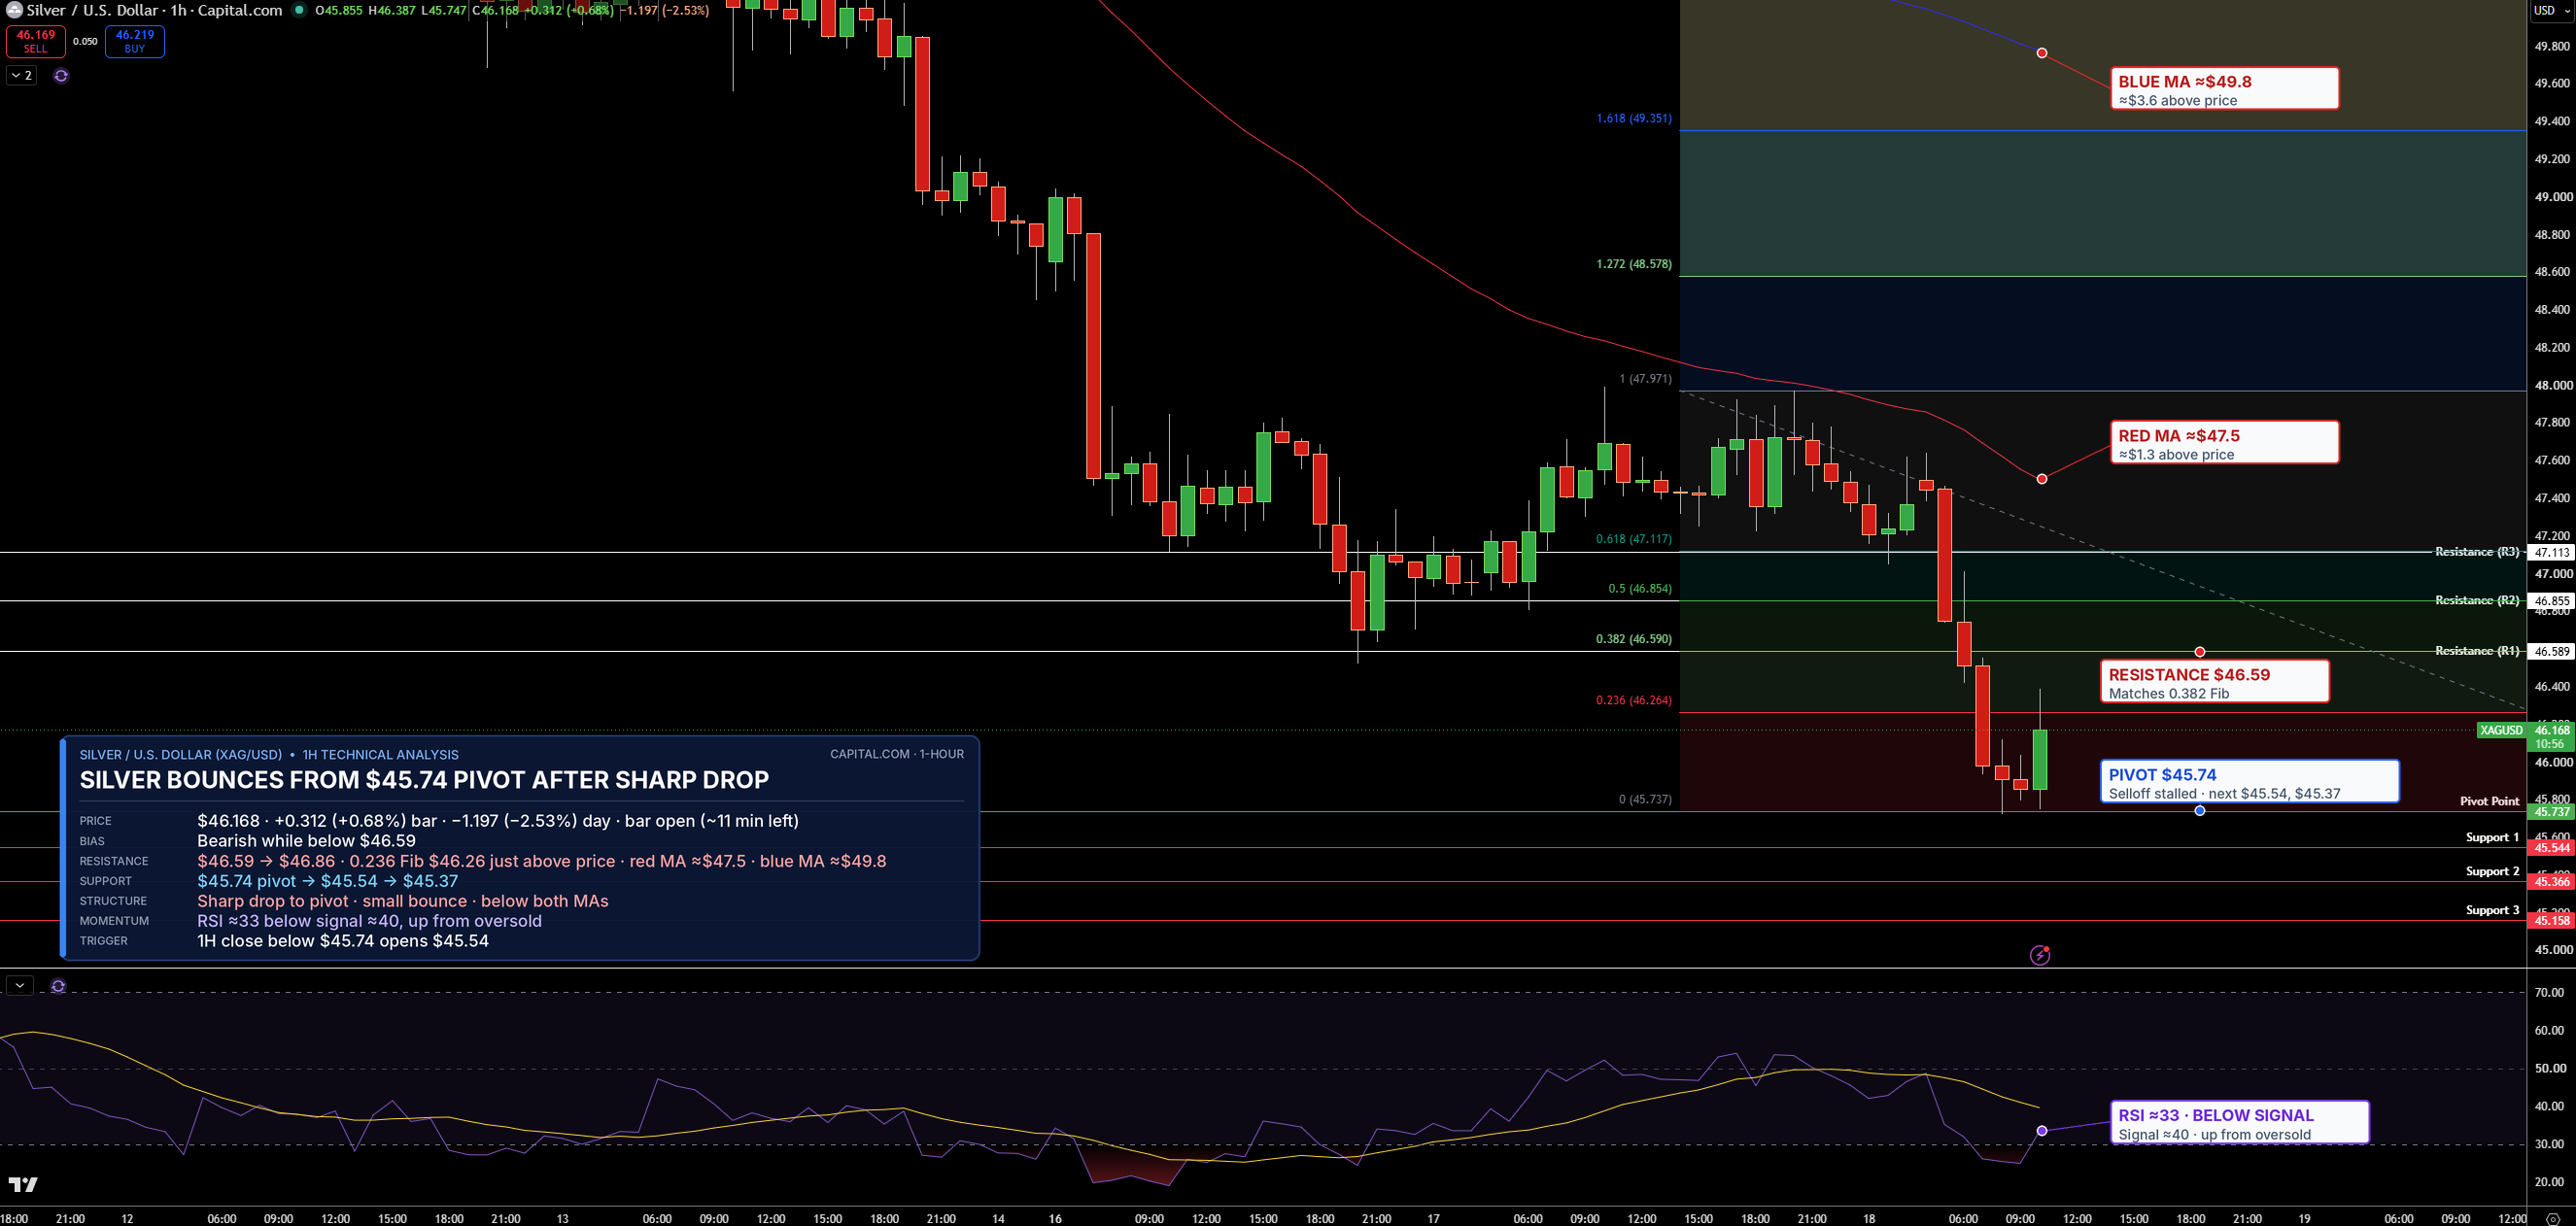
Silver is trading near $46.17 on the 1-hour chart. A sharp selloff stopped at the $45.74 pivot, and buyers have stepped in for a small bounce, though silver remains below its faster moving average.
Resistance is $46.59, then $46.86, both Fibonacci retracement levels, which show how much of the drop has been recovered. Support is $45.74, then $45.54. RSI has climbed to about 33 from oversold but is still below its signal line, a slower average of RSI. The bias stays bearish while silver trades below $46.59, and a close below $45.74 would open $45.54.