


Gold Stuck at One-Year Lows as Fed Hawks Close Ranks
Gold dipped on Monday as a firmer dollar and elevated Treasury yields weighed, after bullion fell 4.5% last week to a more-than-one-year low, Reuters reported. Investors are waiting for remarks from Fed Chair Kevin Warsh and the minutes of the October policy meeting due Wednesday. Spot gold fell 0.3% to $3,867.39 by 04:59 GMT.
Gold: No Relief From the Rate Path
Markets price a 90% chance of a quarter-point Fed hike in December and a 10% chance of a half-point move, according to CME’s FedWatch tool, Reuters said. Tim Waterer, chief market analyst at KCM Trade, said a stronger dollar, elevated Treasury yields and firm expectations of a December hike leave gold “neutral to mildly bearish.” Gold pays no interest, so higher rates raise the cost of holding it.
Friday’s producer price data offered little comfort. Final demand prices rose 0.3% in October, slowing from 1.4% in September, but the 12-month rate climbed to 6.5% from 6.3%, the largest rise since November 2022, the Bureau of Labor Statistics said. Goods prices rose 0.5% on the month. In my view, a slower monthly reading would normally ease rate fears, but with the annual rate at its highest since November 2022, it gave gold no lift.
Fed officials kept up the pressure. Kansas City Fed President Jeff Schmid said inflation is still “running too hot,” and Vice Chair Philip Jefferson said he is taking his policy cues from inflation, Reuters reported. In my view, Warsh’s tone and Wednesday’s FOMC minutes decide whether gold can stabilize near $3,850.
Silver: Industrial Metal, Monetary Pain
Spot silver fell 2.8% to $47.38 on Monday, while platinum dropped 1.4% and palladium 2%, Reuters reported. Research published on Friday forecast a 5% fall in global silver demand in 2026, citing weaker jewelry demand and lower use in solar cells. In my view, that adds a demand problem to the rate pressure already weighing on precious metals.
Gold Price Forecast
Every new Gold analysis as it publishes, today's technical signal and key levels, live price — on one page.
See all Gold forecastsGold Technical Analysis: XAU/USD Drifts Toward $3,852 as Sellers Stay in Control
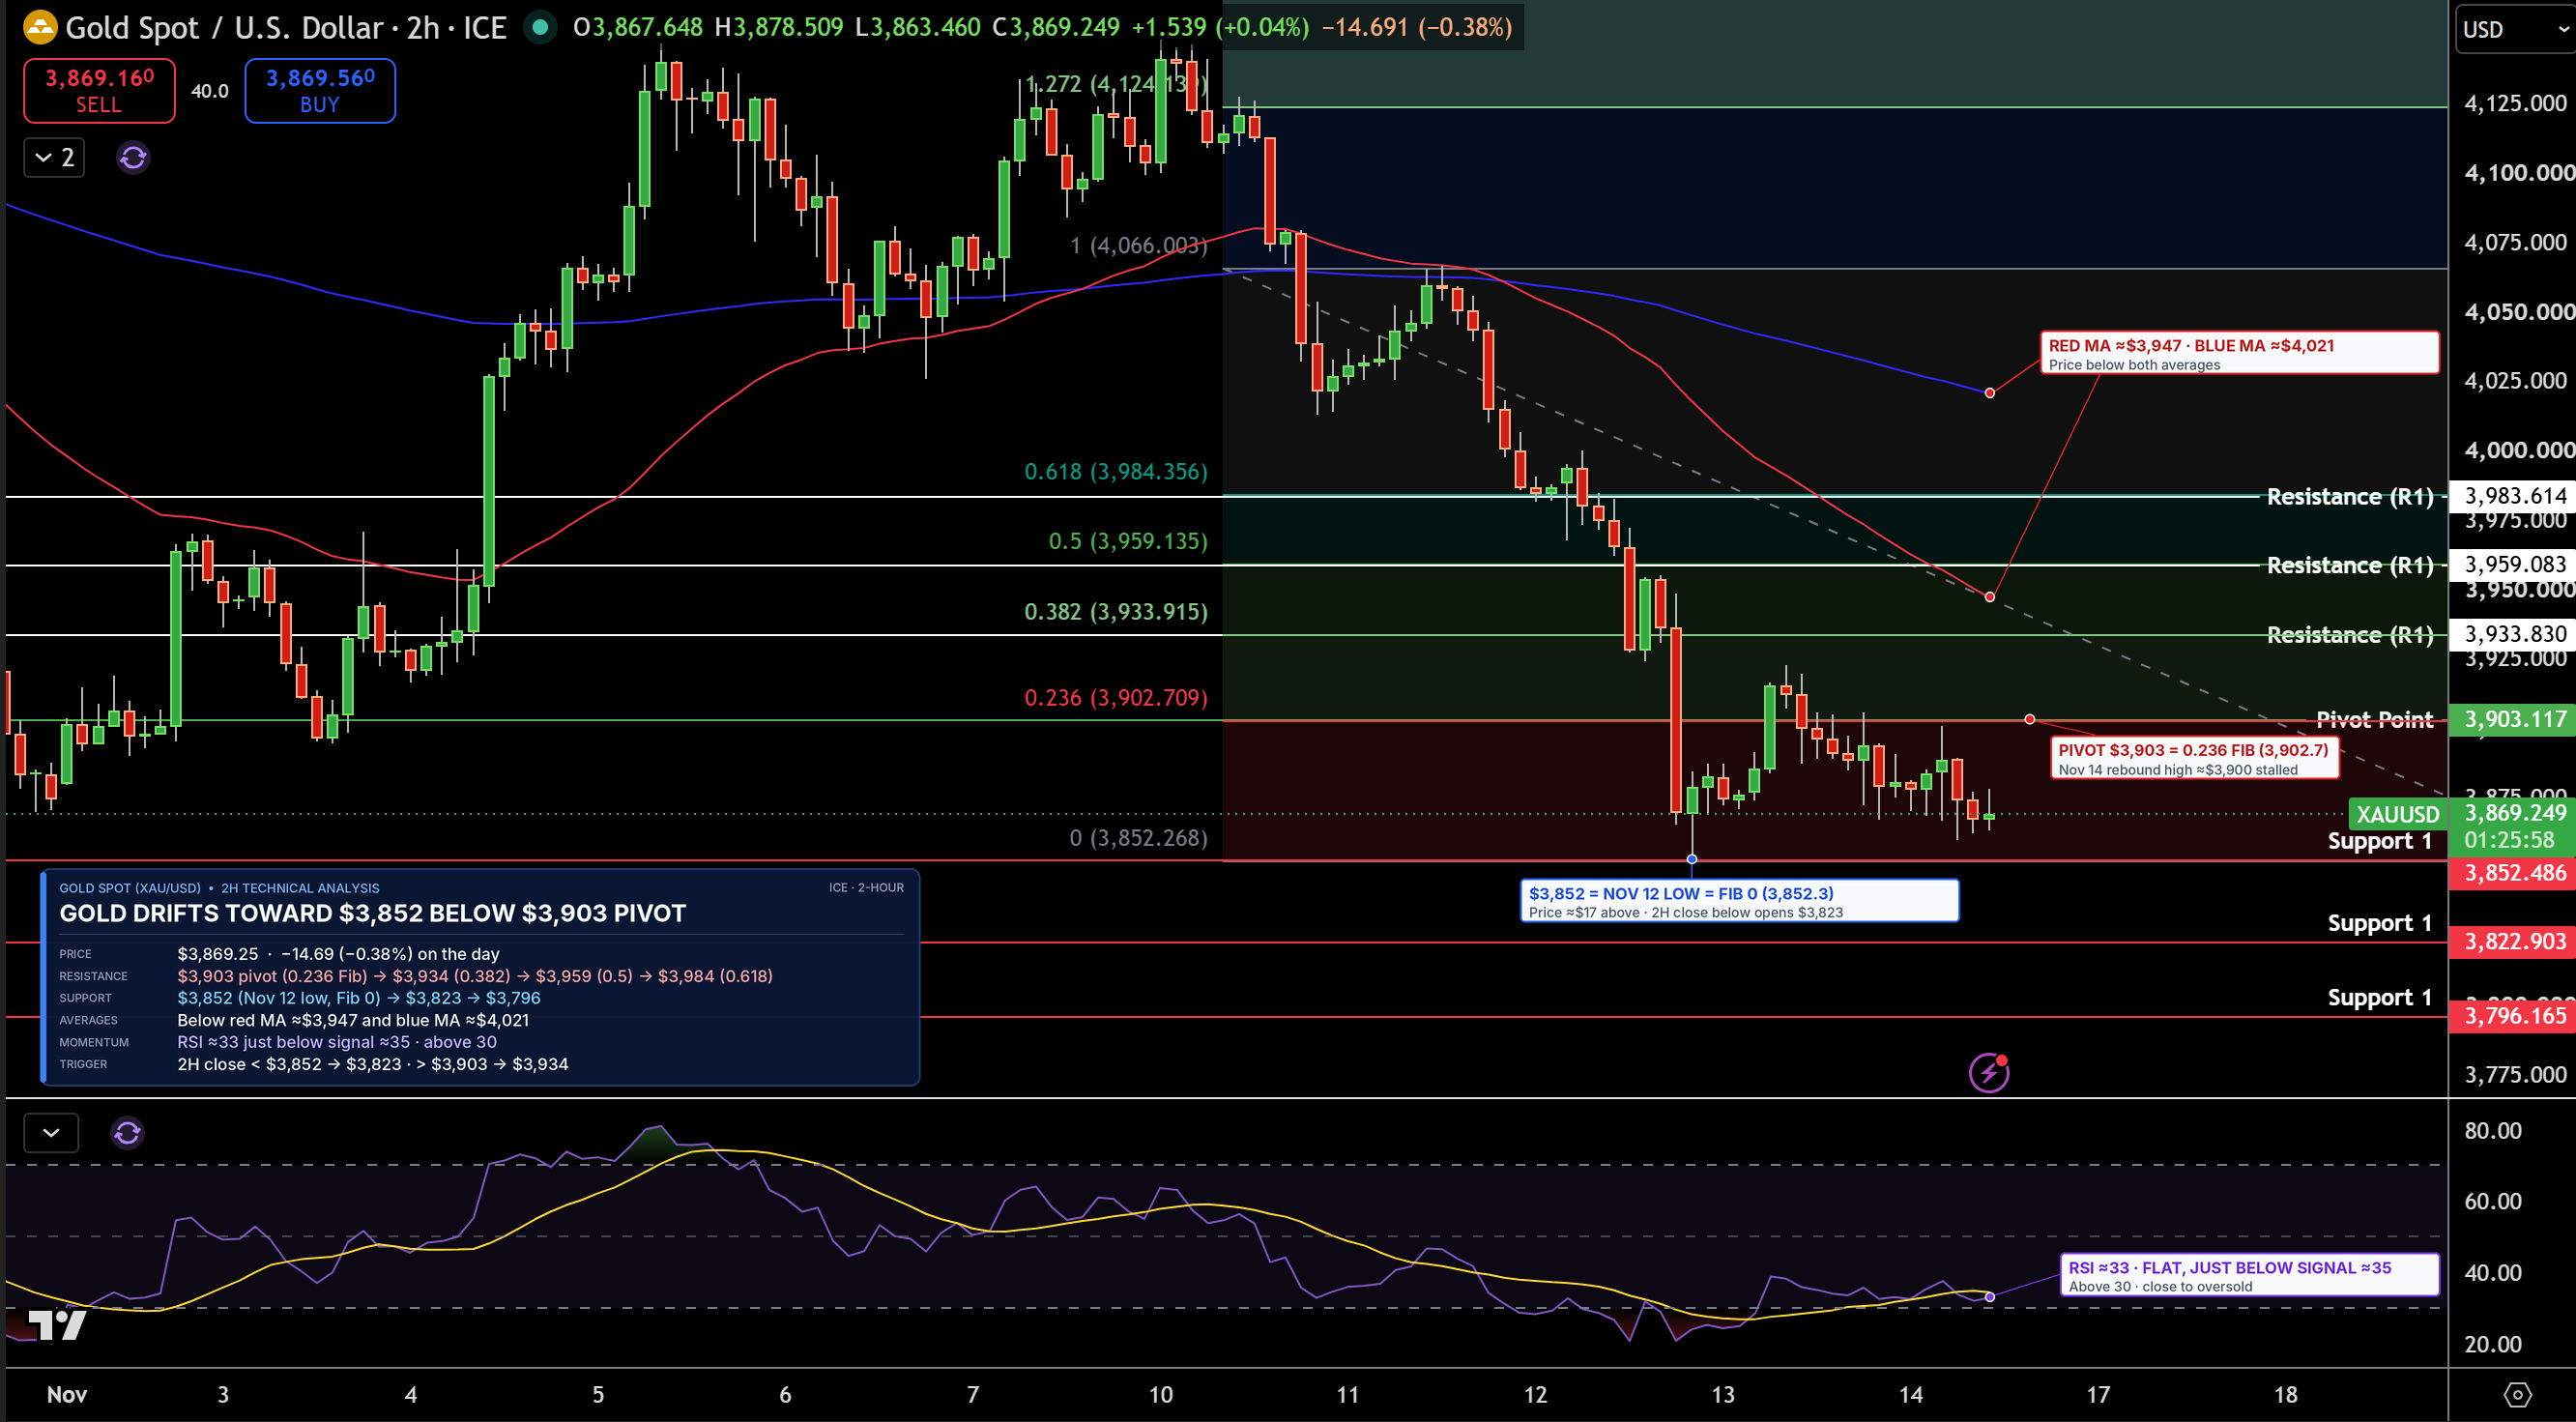
Gold is trading near $3,869 on the 2-hour chart. Rebounds have stalled below $3,903, the pivot point, a level calculated from the previous period’s high, low and close that traders use to judge direction, and prices are drifting back toward last week’s $3,852 low. Gold remains below both moving averages, which track average prices over time.
Support, where buyers may step in, is $3,852, then $3,823. Resistance, where sellers may return, is $3,903, then $3,934. RSI, a 0 to 100 gauge of buying and selling strength, is near 33 and flat, so selling pressure is steady and close to oversold. I stay bearish while gold holds below $3,903. A close below $3,852 would open $3,823.
Silver Technical Analysis: XAG/USD Breaks Below $48.72 as $46.92 Comes Into Focus
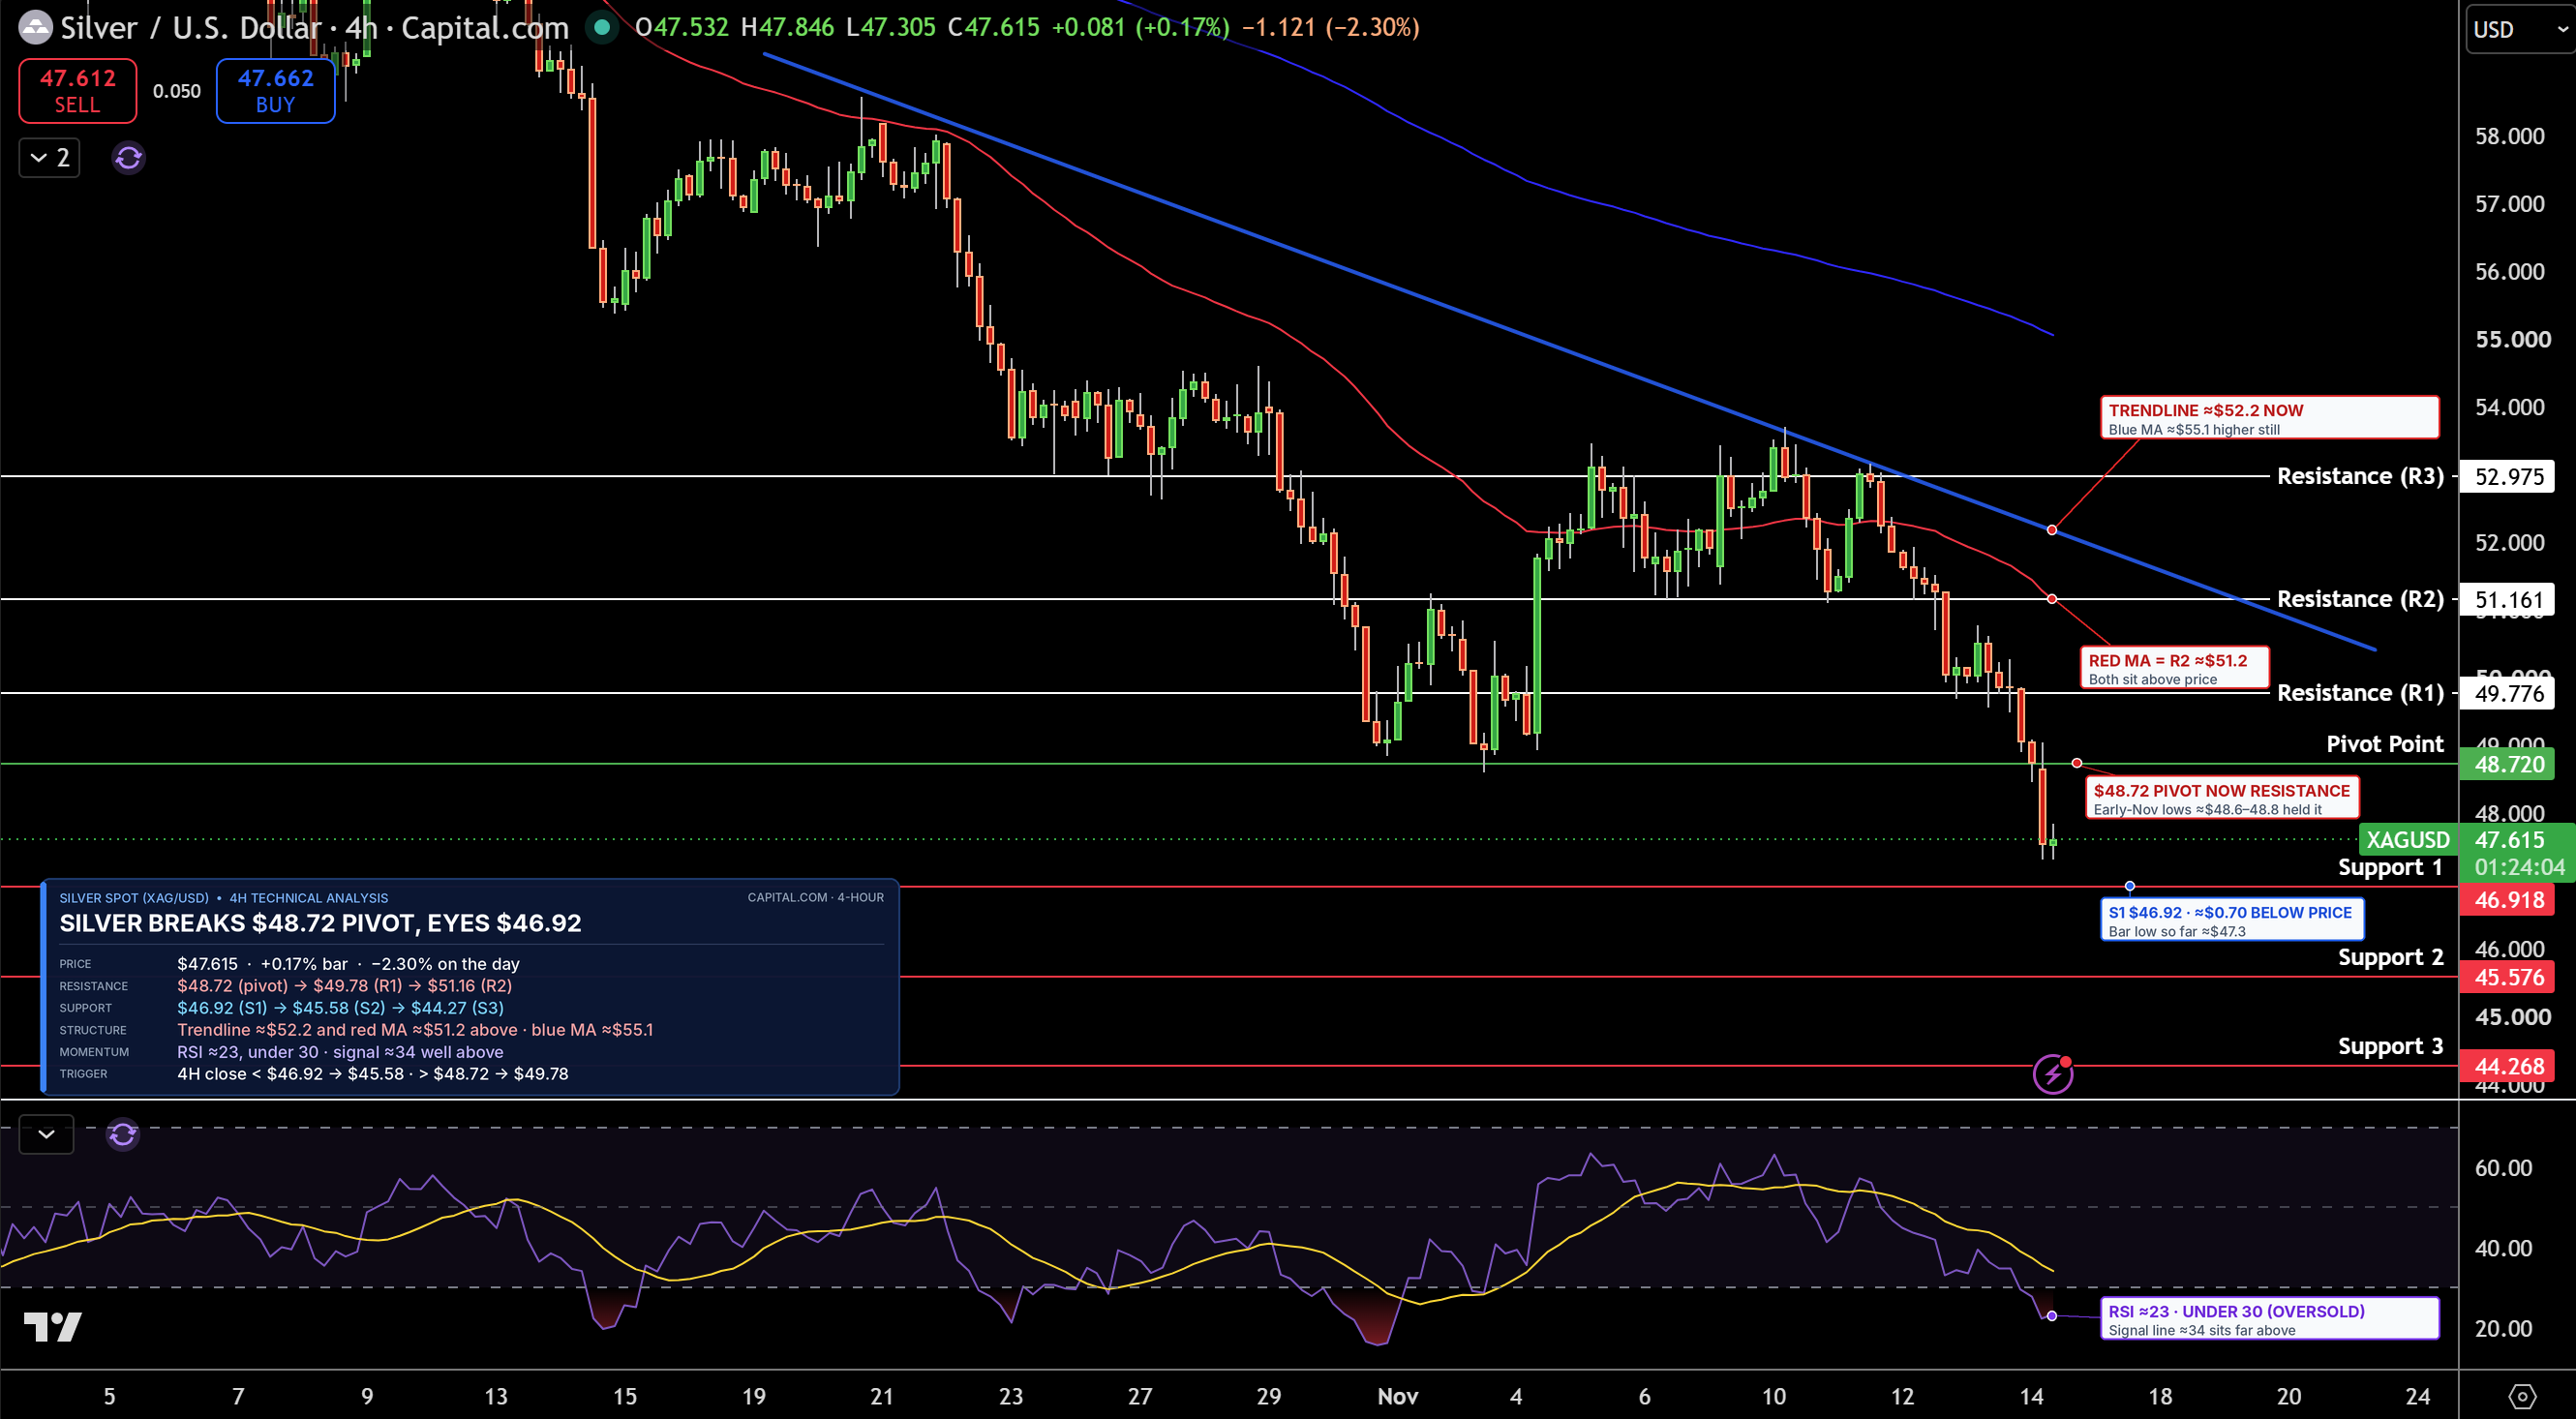
Silver is trading near $47.62 on the 4-hour chart after breaking below its $48.72 pivot, a level that had held as a floor in early November. A falling trendline, a line connecting lower highs, still caps every rally, and both moving averages are sloping down above price.
Support is $46.92, then $45.58. Resistance is $48.72, then $49.78. RSI is near 23, which is oversold, meaning prices fell very fast, so a short bounce is possible. The bias stays bearish while silver trades below $48.72, and a close below $46.92 would open $45.58.