


Gold held near its lowest level since September 2025 on Thursday, as a stronger dollar and bets on a December Fed rate hike weighed on bullion, Reuters reported. Spot gold was little changed at $3,722.84 an ounce at 0452 GMT, after touching $3,693.13 earlier in the session. The US dollar hovered near a 19-month high, which makes bullion more expensive for buyers holding other currencies.
Gold: Fed Minutes Point to More Hikes
Minutes of the Fed’s October 27-28 meeting, released on Wednesday, showed that “almost all participants” judged further rate increases would likely be appropriate in the months ahead. A few officials who supported holding rates viewed the decision as “a close call.” Fed officials also wrote in the minutes that “many participants viewed the AI buildout as a material source of inflation risk.” Two officials floated the possibility of a half-point increase next month, the Associated Press reported. The minutes themselves did not name a half-point move; they said “a couple of participants” noted that an increase of more than 25 basis points, or a quarter point, could warrant consideration at the next meeting if incoming inflation data were unfavorable.
Fed speakers added to the message. Governor Christopher Waller said the Fed needs to respond more aggressively to inflation, and Governor Michael Barr said he is likely to back tighter policy, Reuters reported. Markets price a 90% chance of a quarter-point hike in December and a 10% chance of a half-point move, according to CME FedWatch, which turns futures prices into rate odds.
“We saw a little bit of a pop earlier today in the session after what was a very aggressive sell-off yesterday. But now, we’re seeing selling pressure returning,” said Ilya Spivak, head of global macro at Tastylive. OCBC analysts wrote that “the break below $3,800 risks reinforcing bearish sentiment,” adding that the continued decline raises the risk of further liquidation. In my view, gold needs a shift in those rate odds, not just a pause in selling, to win back the $3,800 level.
Silver: Holds Near $45 as US Data Comes Into View
Spot silver edged up to $45.14 an ounce, while platinum steadied at $1,370.60, Reuters said. The World Platinum Investment Council said on Wednesday that the platinum market will swing back to a deficit next year due to higher bar and coin demand and smaller outflows from platinum-backed exchange-traded funds.
Gold Price Forecast
Every new Gold analysis as it publishes, today's technical signal and key levels, live price — on one page.
See all Gold forecastsThe next test comes later on Thursday, with US weekly jobless claims and the Philadelphia Fed’s November manufacturing survey, both due at 8:30 a.m. ET.
Gold Technical Analysis: XAU/USD Tests Channel Top Below $3,755 Pivot
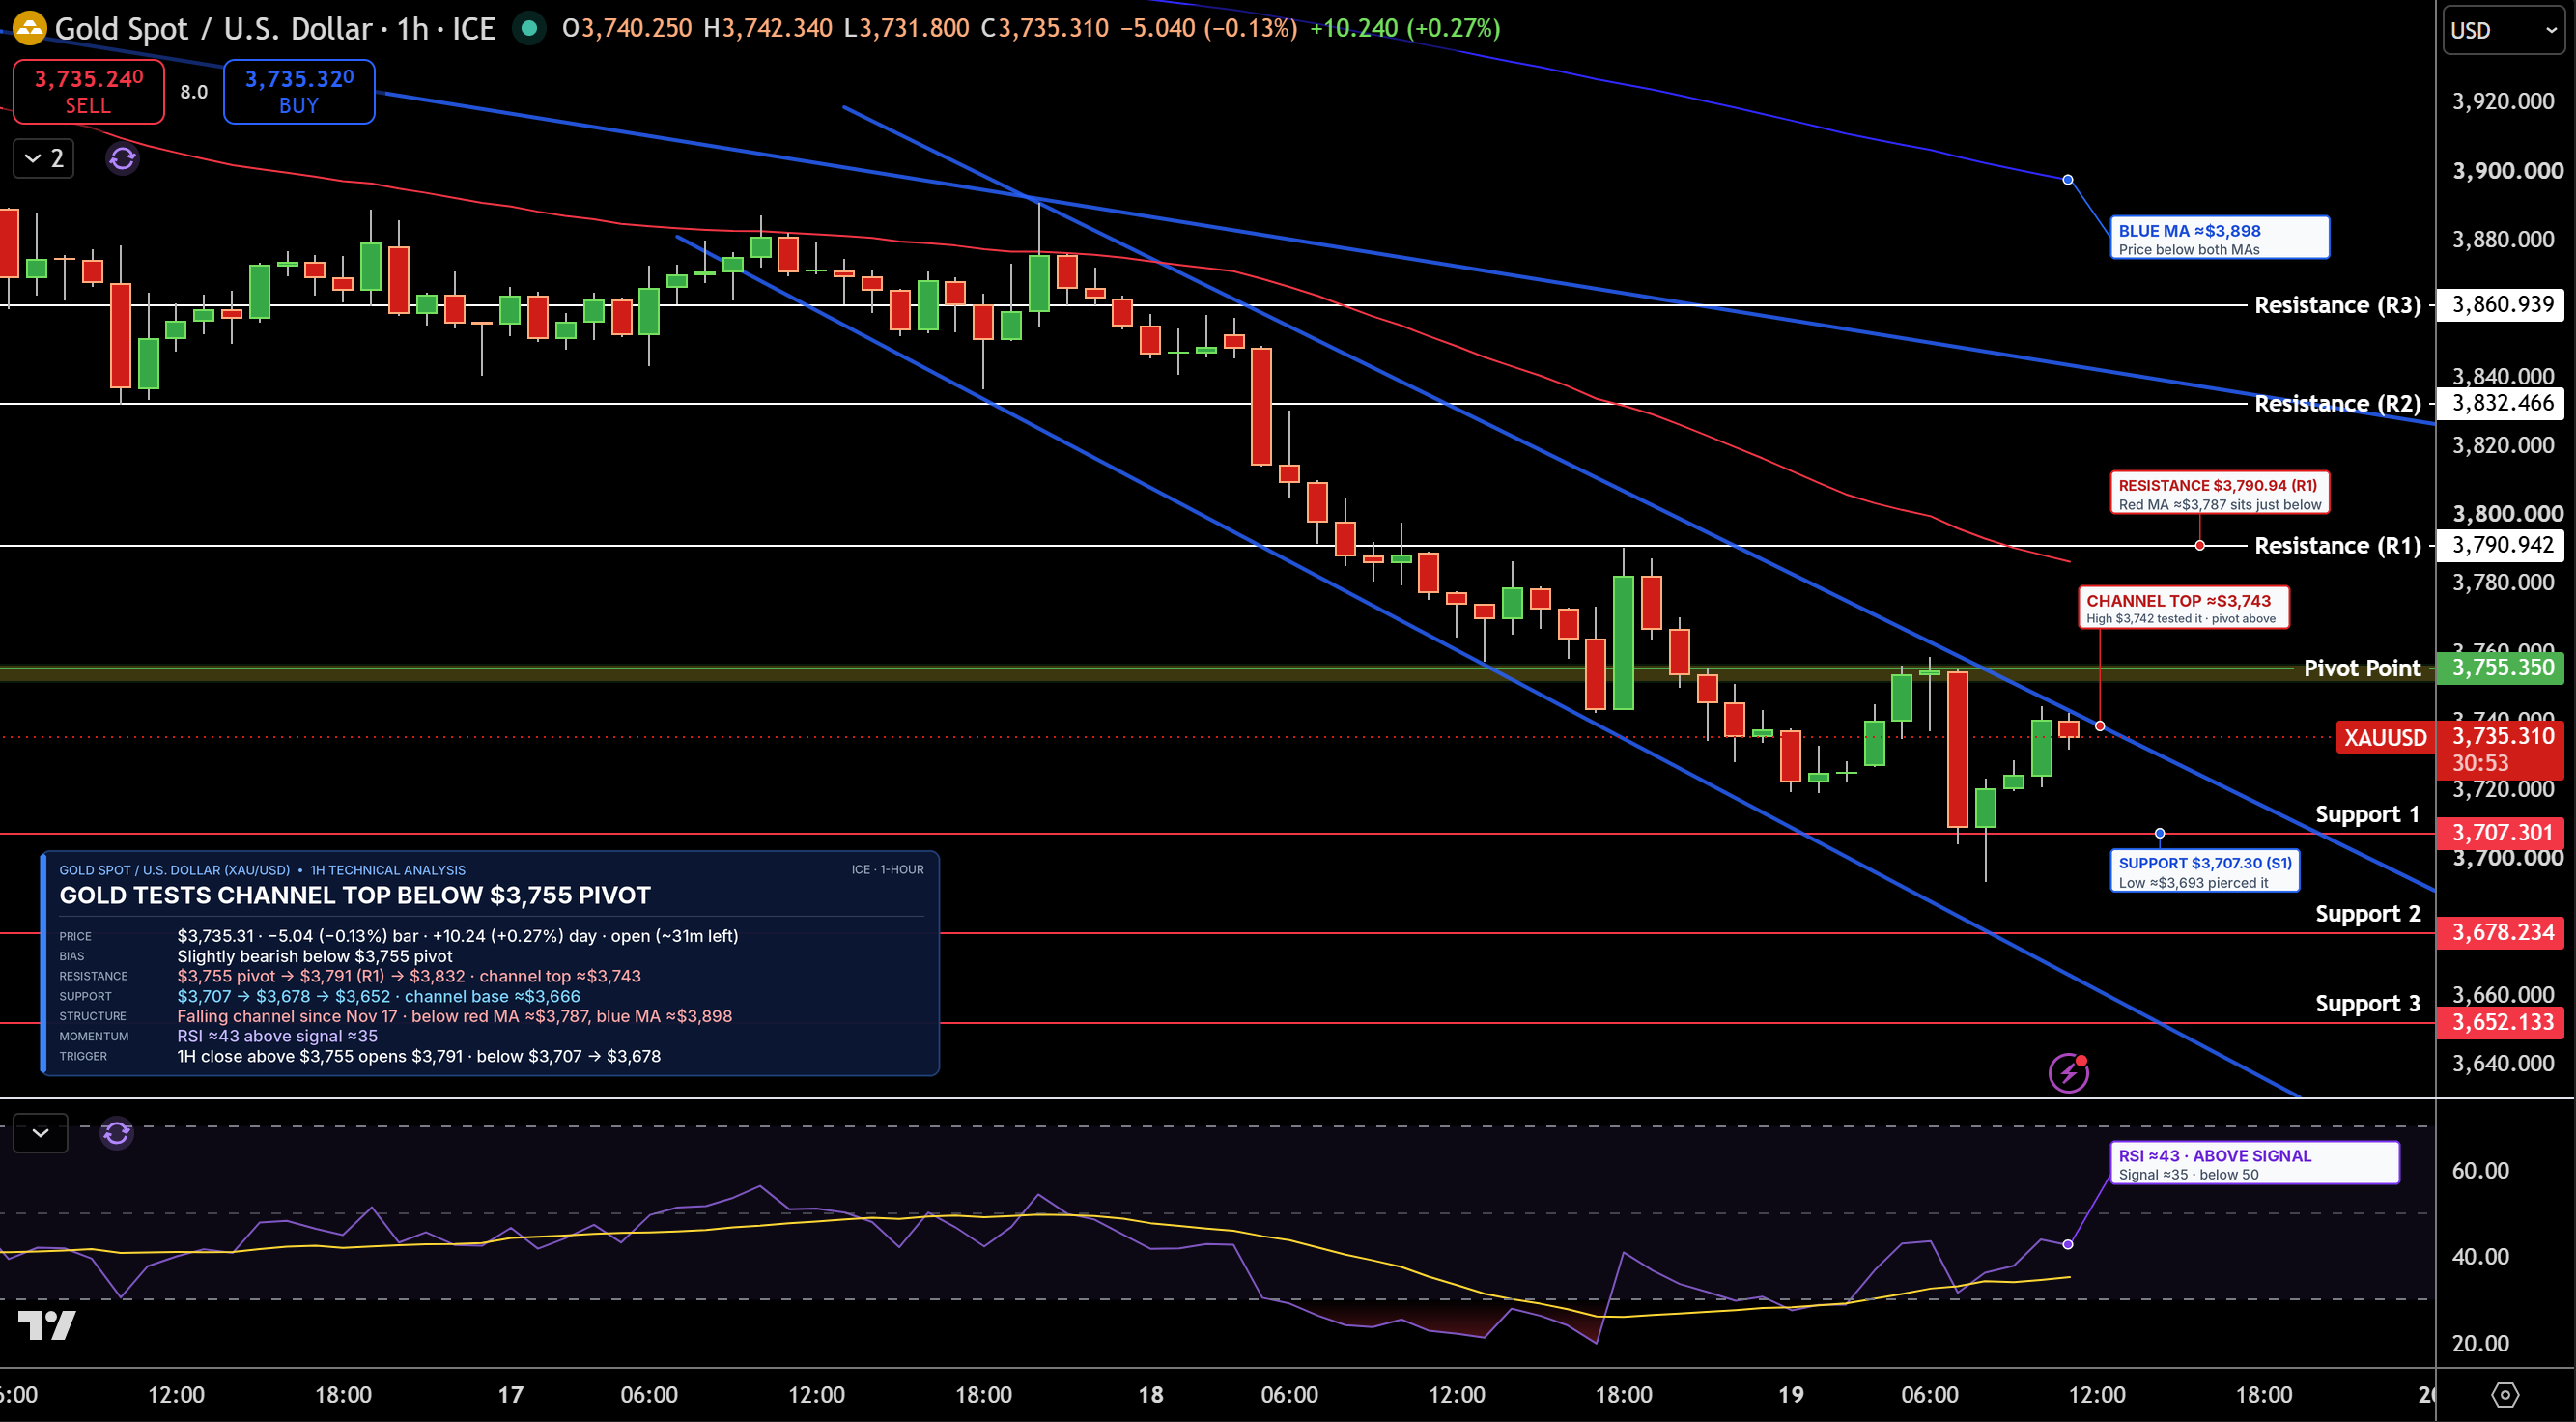
Gold is trading near $3,735 on the 1-hour chart. Prices are still moving inside a falling channel, two parallel lines that have guided them lower since November 17, and a bounce from the $3,707 area is now testing the top of that channel. Gold remains below $3,755, the pivot point, a level calculated from the previous period’s high, low and close that traders use to judge direction, and below both moving averages, which track average prices over time.
Resistance, where sellers may return, is $3,755, then $3,791. Support, where buyers may step in, is $3,707, then $3,678. RSI, a 0 to 100 gauge of buying and selling strength, has climbed to about 43 and is above its signal line, a slower average of RSI, so selling is easing. I hold a slight bearish lean while gold stays below $3,755. A close above it would open $3,791, while a drop below $3,707 would point to $3,678.
Silver Technical Analysis: XAG/USD Presses Falling Trendline Below $45.70 Pivot
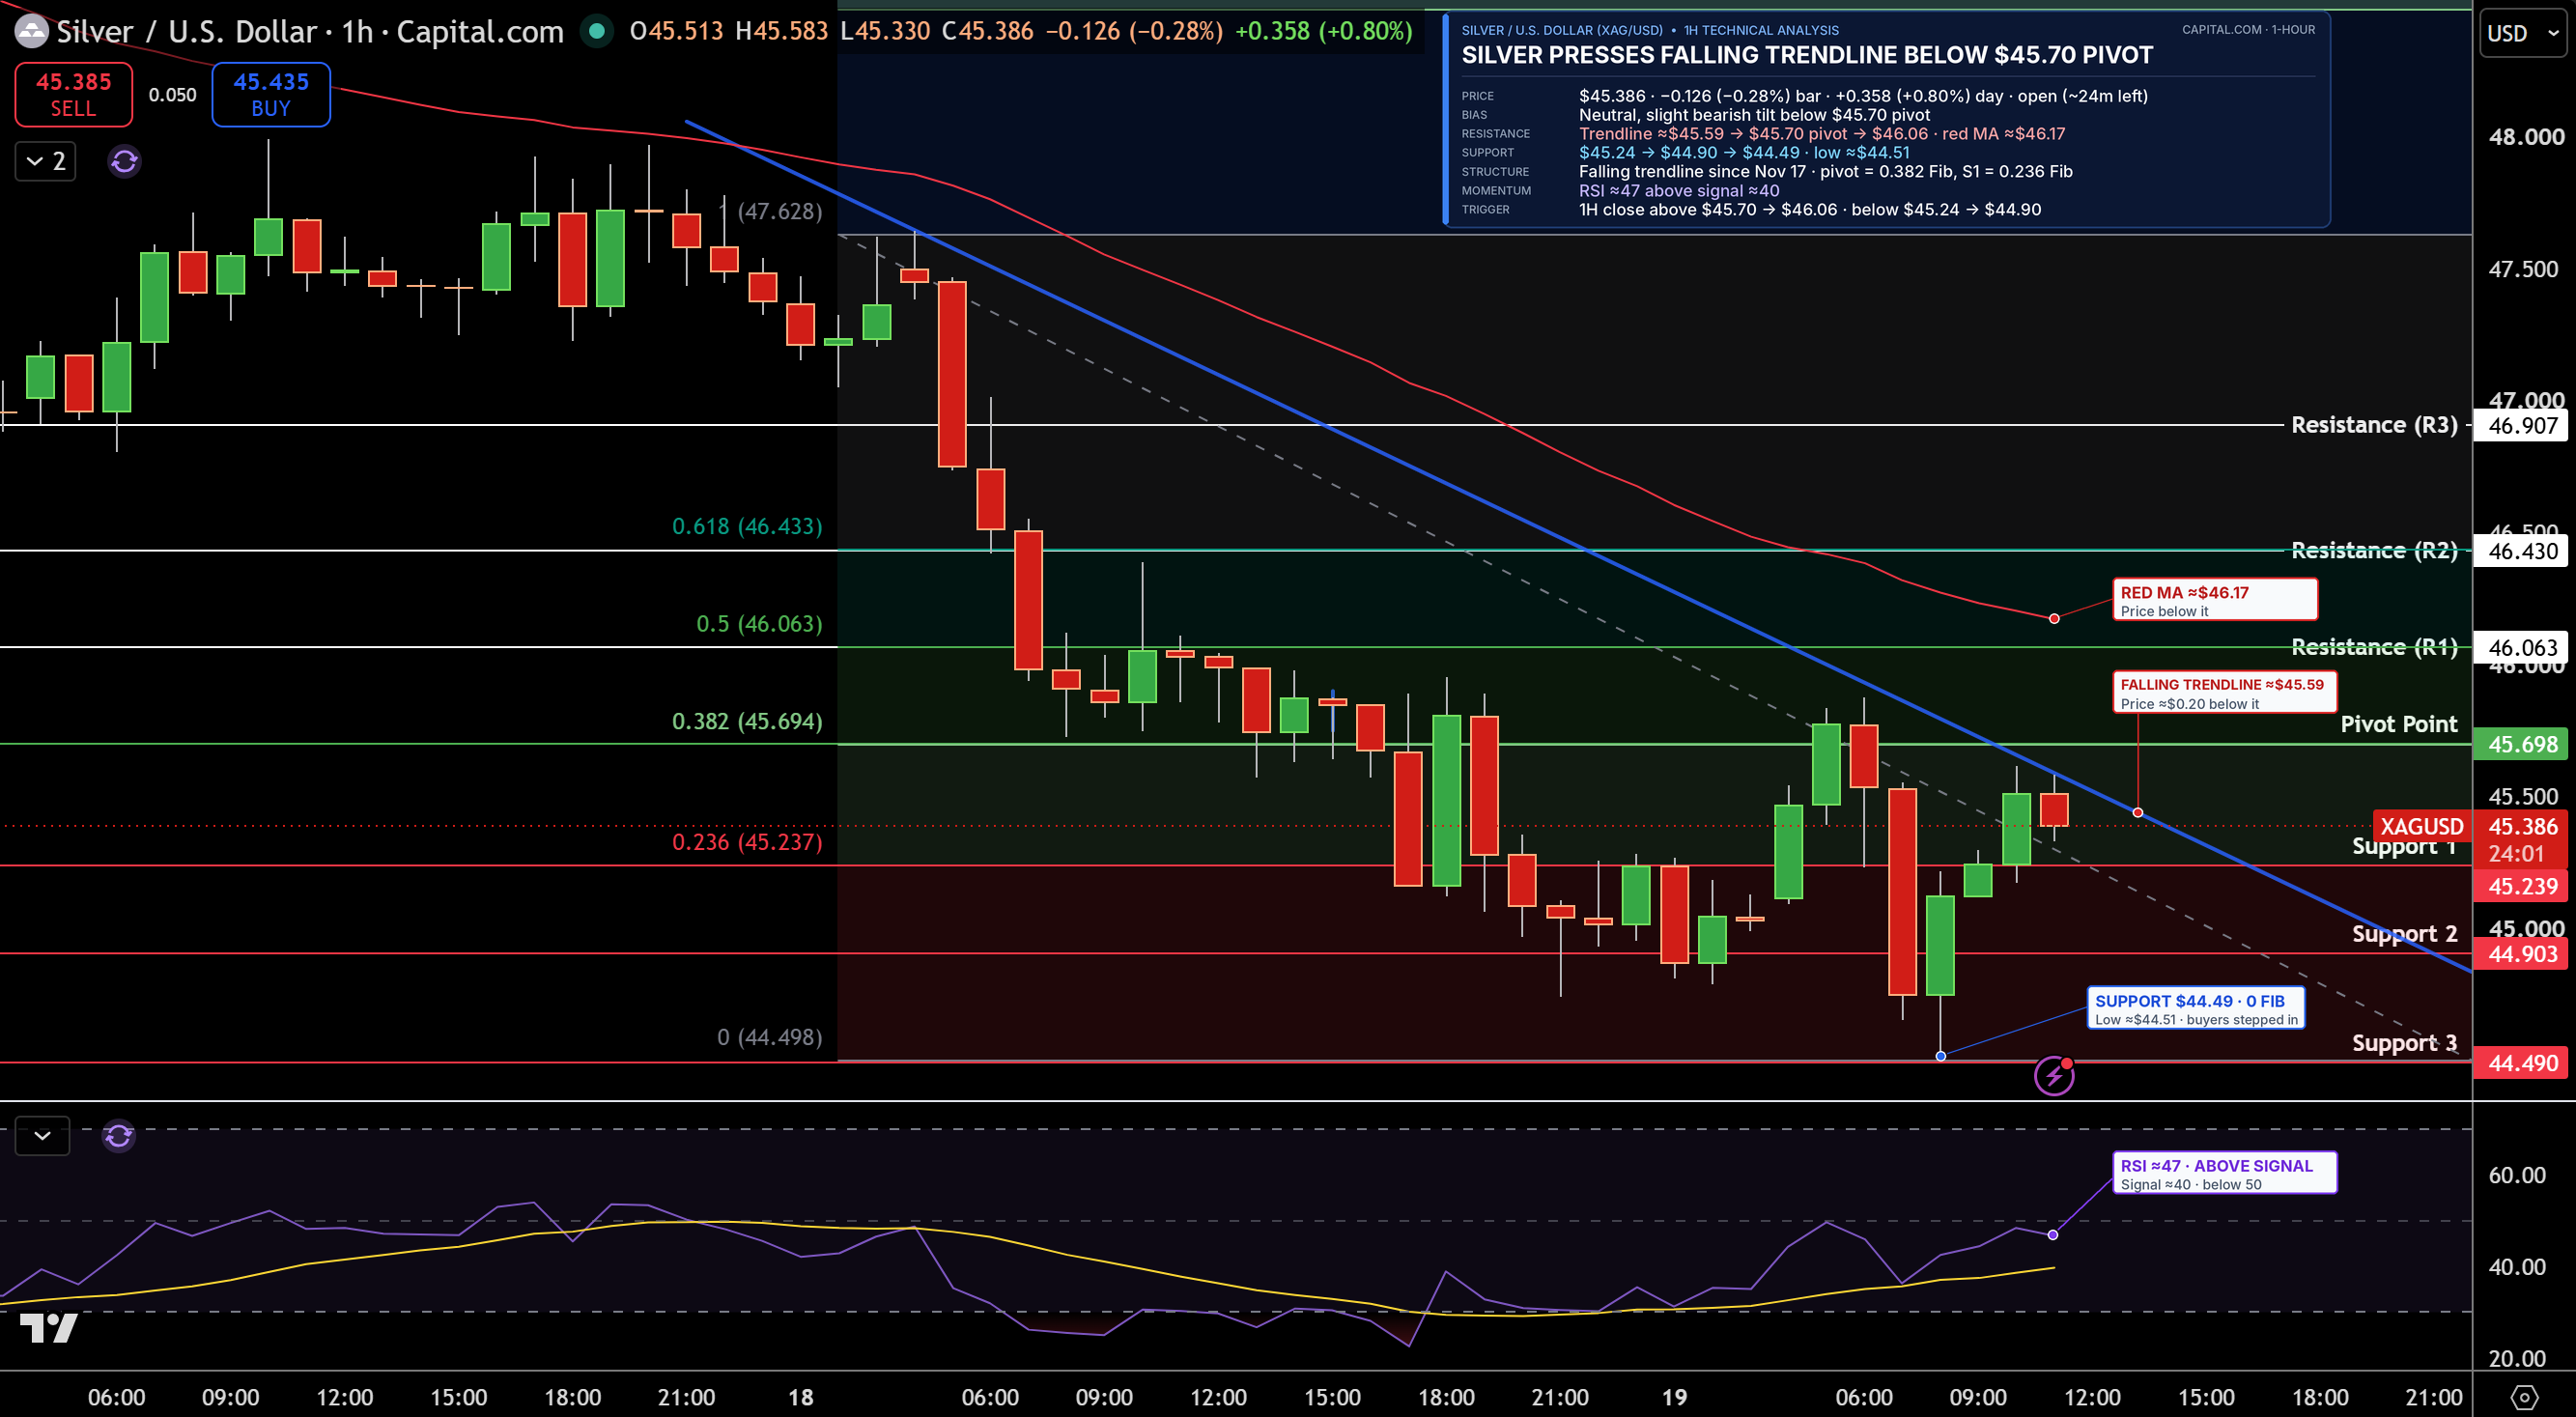
Silver is trading near $45.39 on the 1-hour chart. Buyers stepped in near $44.50, and prices have climbed back to a falling trendline, a line connecting lower highs since November 17. Silver is still below the $45.70 pivot and below its faster moving average.
Resistance is $45.70, then $46.06. Support is $45.24, then $44.90. RSI is near 47 and above its signal line, so momentum is improving. Silver keeps a slight bearish lean below $45.70. A close above that pivot would confirm a break of the trendline, while a drop below $45.24 would point to $44.90.