Gold and Silver Firm as Softer Oil Cools Fed Hike Bets
Precious metals gained at the beginning of the week as a drop in crude prices and expectations of a slower Federal Reserve rate hike combined to offer support.

Gold: Oil and the Fed Set the Tone
In the previous trading session, spot gold gained slightly, with some reporting this was due to lower oil prices alleviating concerns of rising inflation, while traders waited for the Fed’s next move. According to the CME’s FedWatch, traders are pricing in a 16% chance of a rate hike this month; however, a 92% chance of a rate hike in December. Traders scaled back their expectations of a rate hike in October after the comments by Fed Chair Kevin Warsh last week.
Indian gold demand has recovered following a recent fall in prices with dealers last week charging a premium for the first time in over three months. Demand has increased for the festive season and as wedding season is about to commence. Dealers were charging a premium of up to $7 an ounce, while a week earlier they were charging a discount of up to $6 an ounce. Physical gold supplies are restricted and imports fell to $1.8 billion in September from $9.6 billion in the same month last year. In China, gold premiums were in the range of $4 to $13 an ounce with some cautious buying in the spot market.
Silver: Riding the Same Rate Relief
Silver also appreciated on easing rate hike expectations. Ajay Kedia of Kedia Advisory said the metals were benefiting from short covering. Broader market trends and a decrease in crude prices are also providing some support as it eases inflation concerns. Silver is still expected to be more volatile than gold.
What Comes Next
The next important economic data to be released will be PCE on October 29, a day after the Fed’s October 27-28 meeting. As expected, focus will be on the December meeting of the Federal Reserve for both metals.
Gold Price Forecast
Every new Gold analysis as it publishes, today's technical signal and key levels, live price — on one page.
See all Gold forecastsGold Technical Analysis: XAU/USD Holds $4,176 as $4,201 Remains the Key Breakout Test
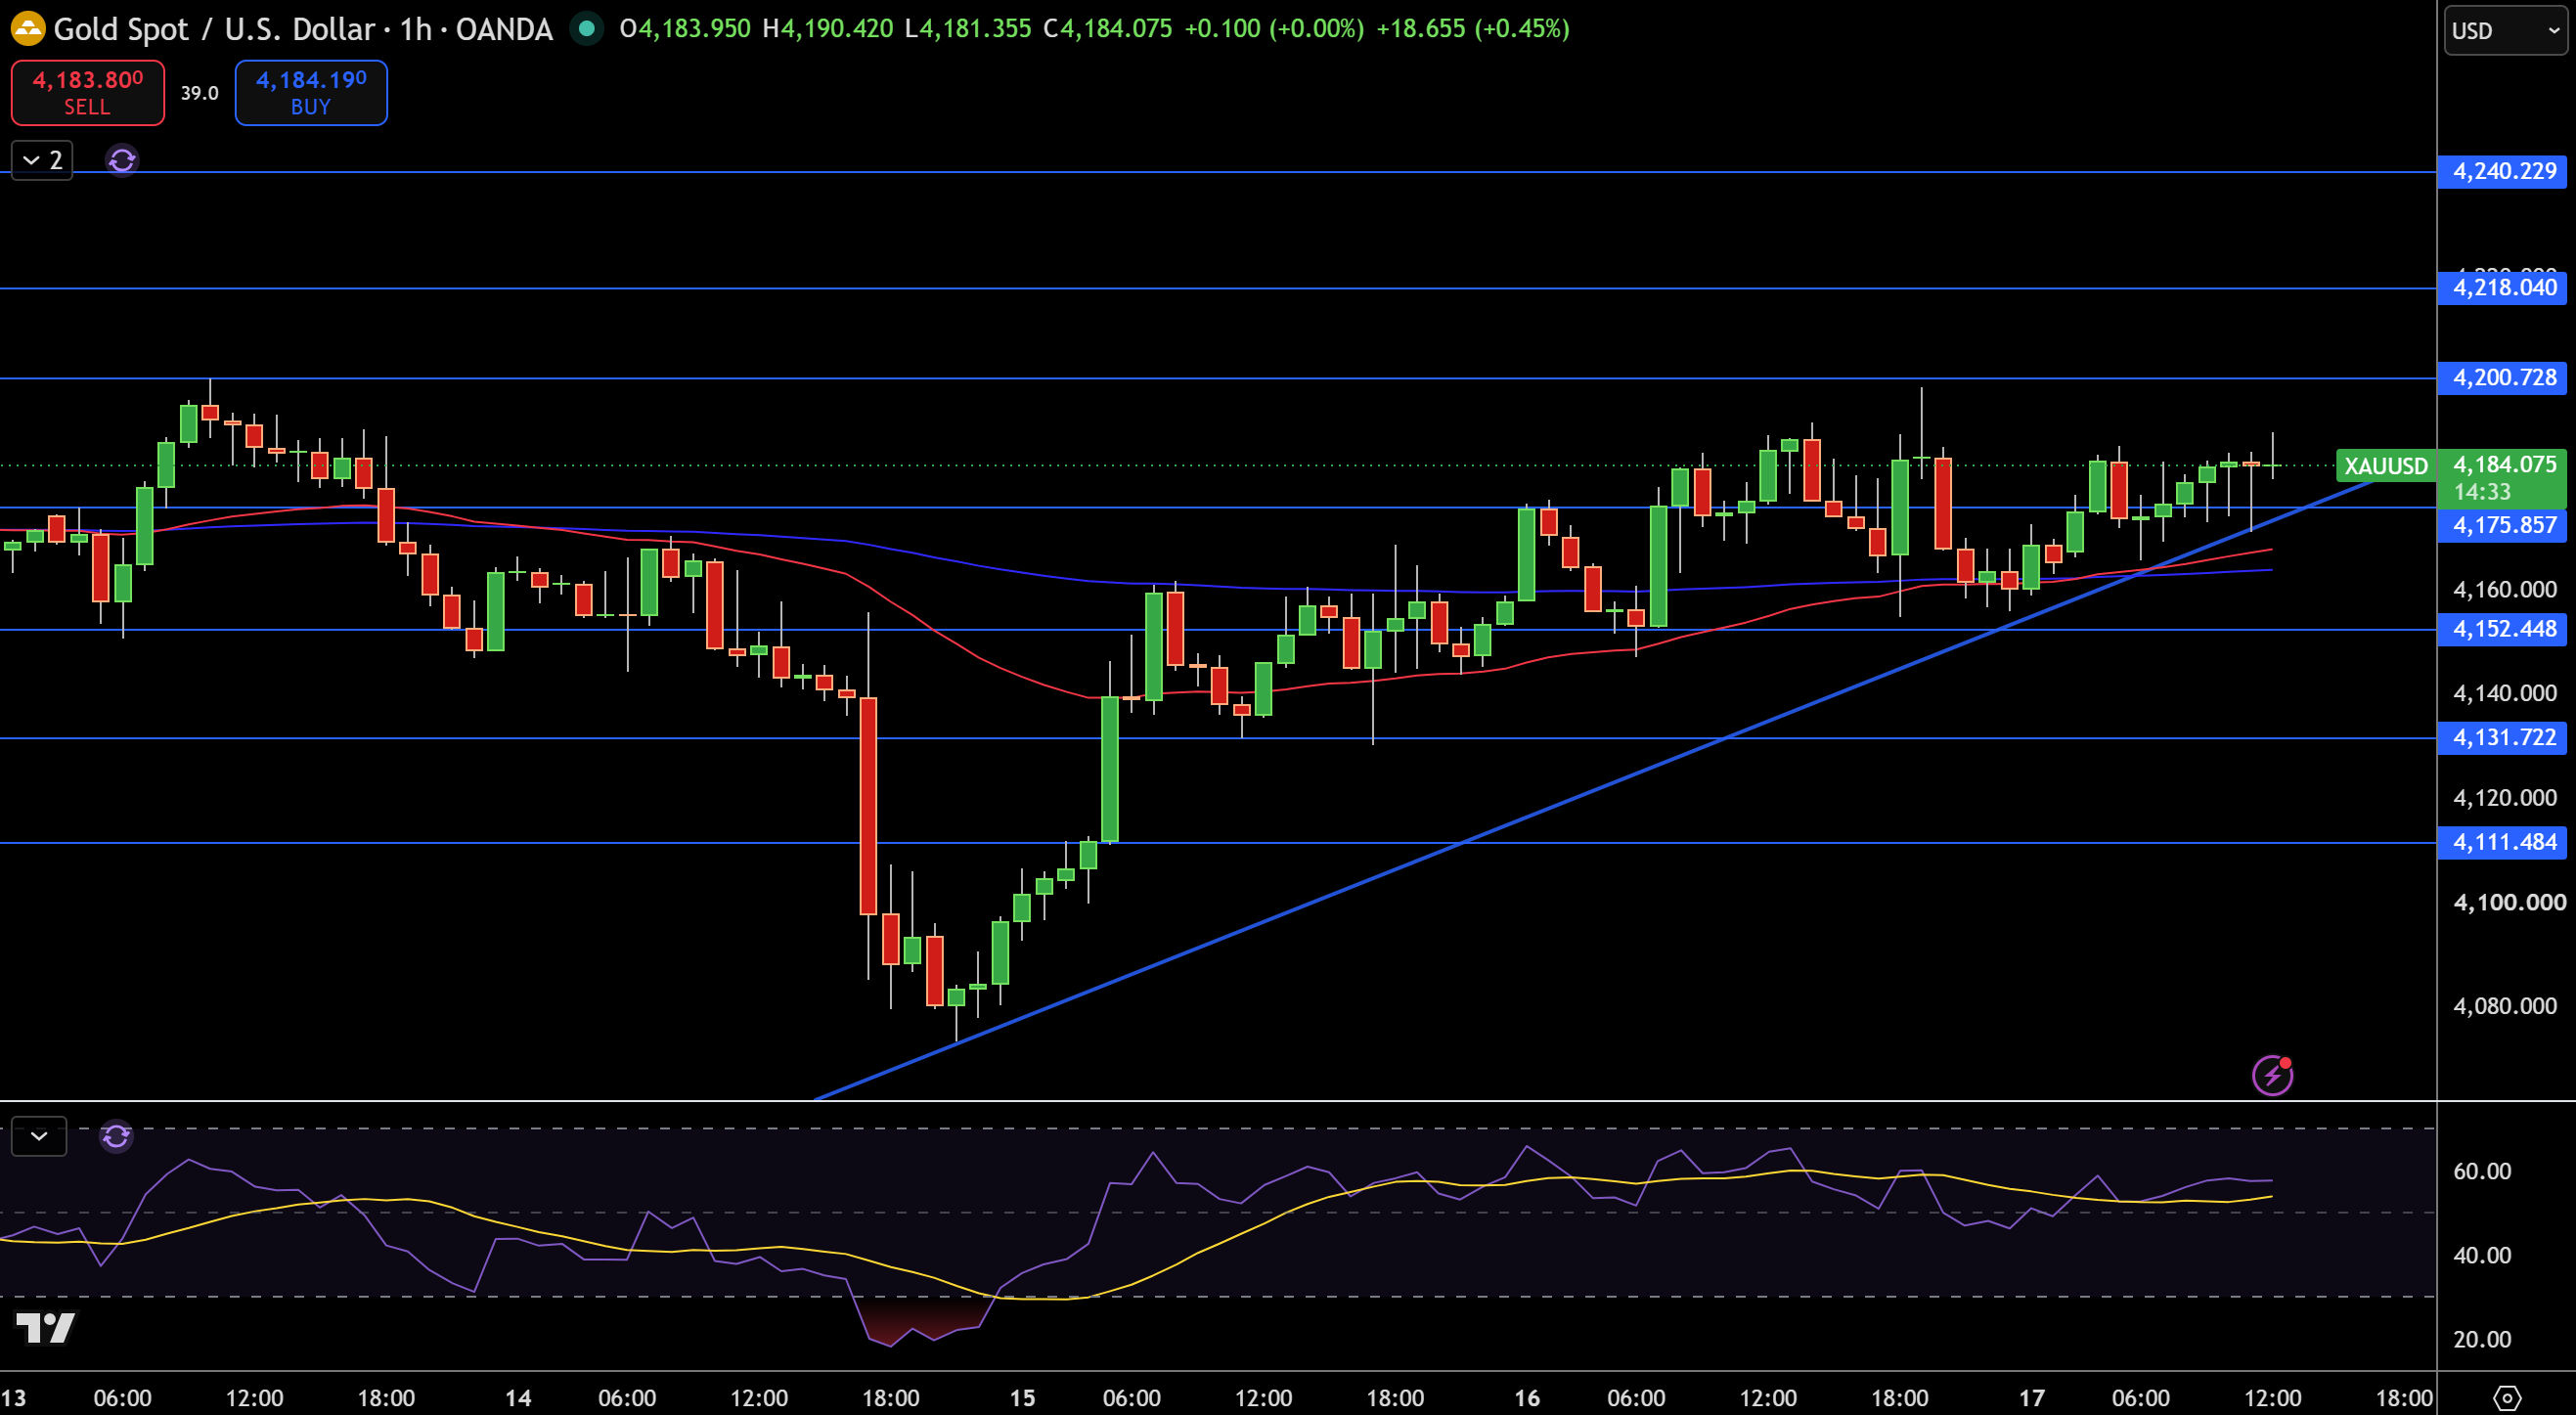
As of writing, gold is near $4,184 on the 1-hour chart. What’s notable is how the price has been consolidating in a tight range of $4,176 to $4,201 during the recovery from the mid-month lows. Meanwhile, the rising trendline is reaching the $4,176 support, and both moving averages are located underneath. The faster of the two has crossed above the slower, which is constructive for the short-term outlook.
The initial resistance is at $4,201, a level that has been holding rejections over the past few sessions. A break above that would put $4,218 and then $4,240 in sight. Below, a breakdown of $4,176 and the trendline would open up support at $4,152, and then $4,132 and $4,111.
RSI is at about 57, which is above its signal line at 54. This shows a marginally positive but non-accelerating momentum. While the price of gold is trading above $4,176, a slightly bullish bias is justified. The break of $4,201 would validate the bullish bias. A close below $4,152 would change the structure to bearish.
Silver Technical Analysis: XAG/USD Holds $57.39 as $57.86 Trendline Resistance Caps the Rebound
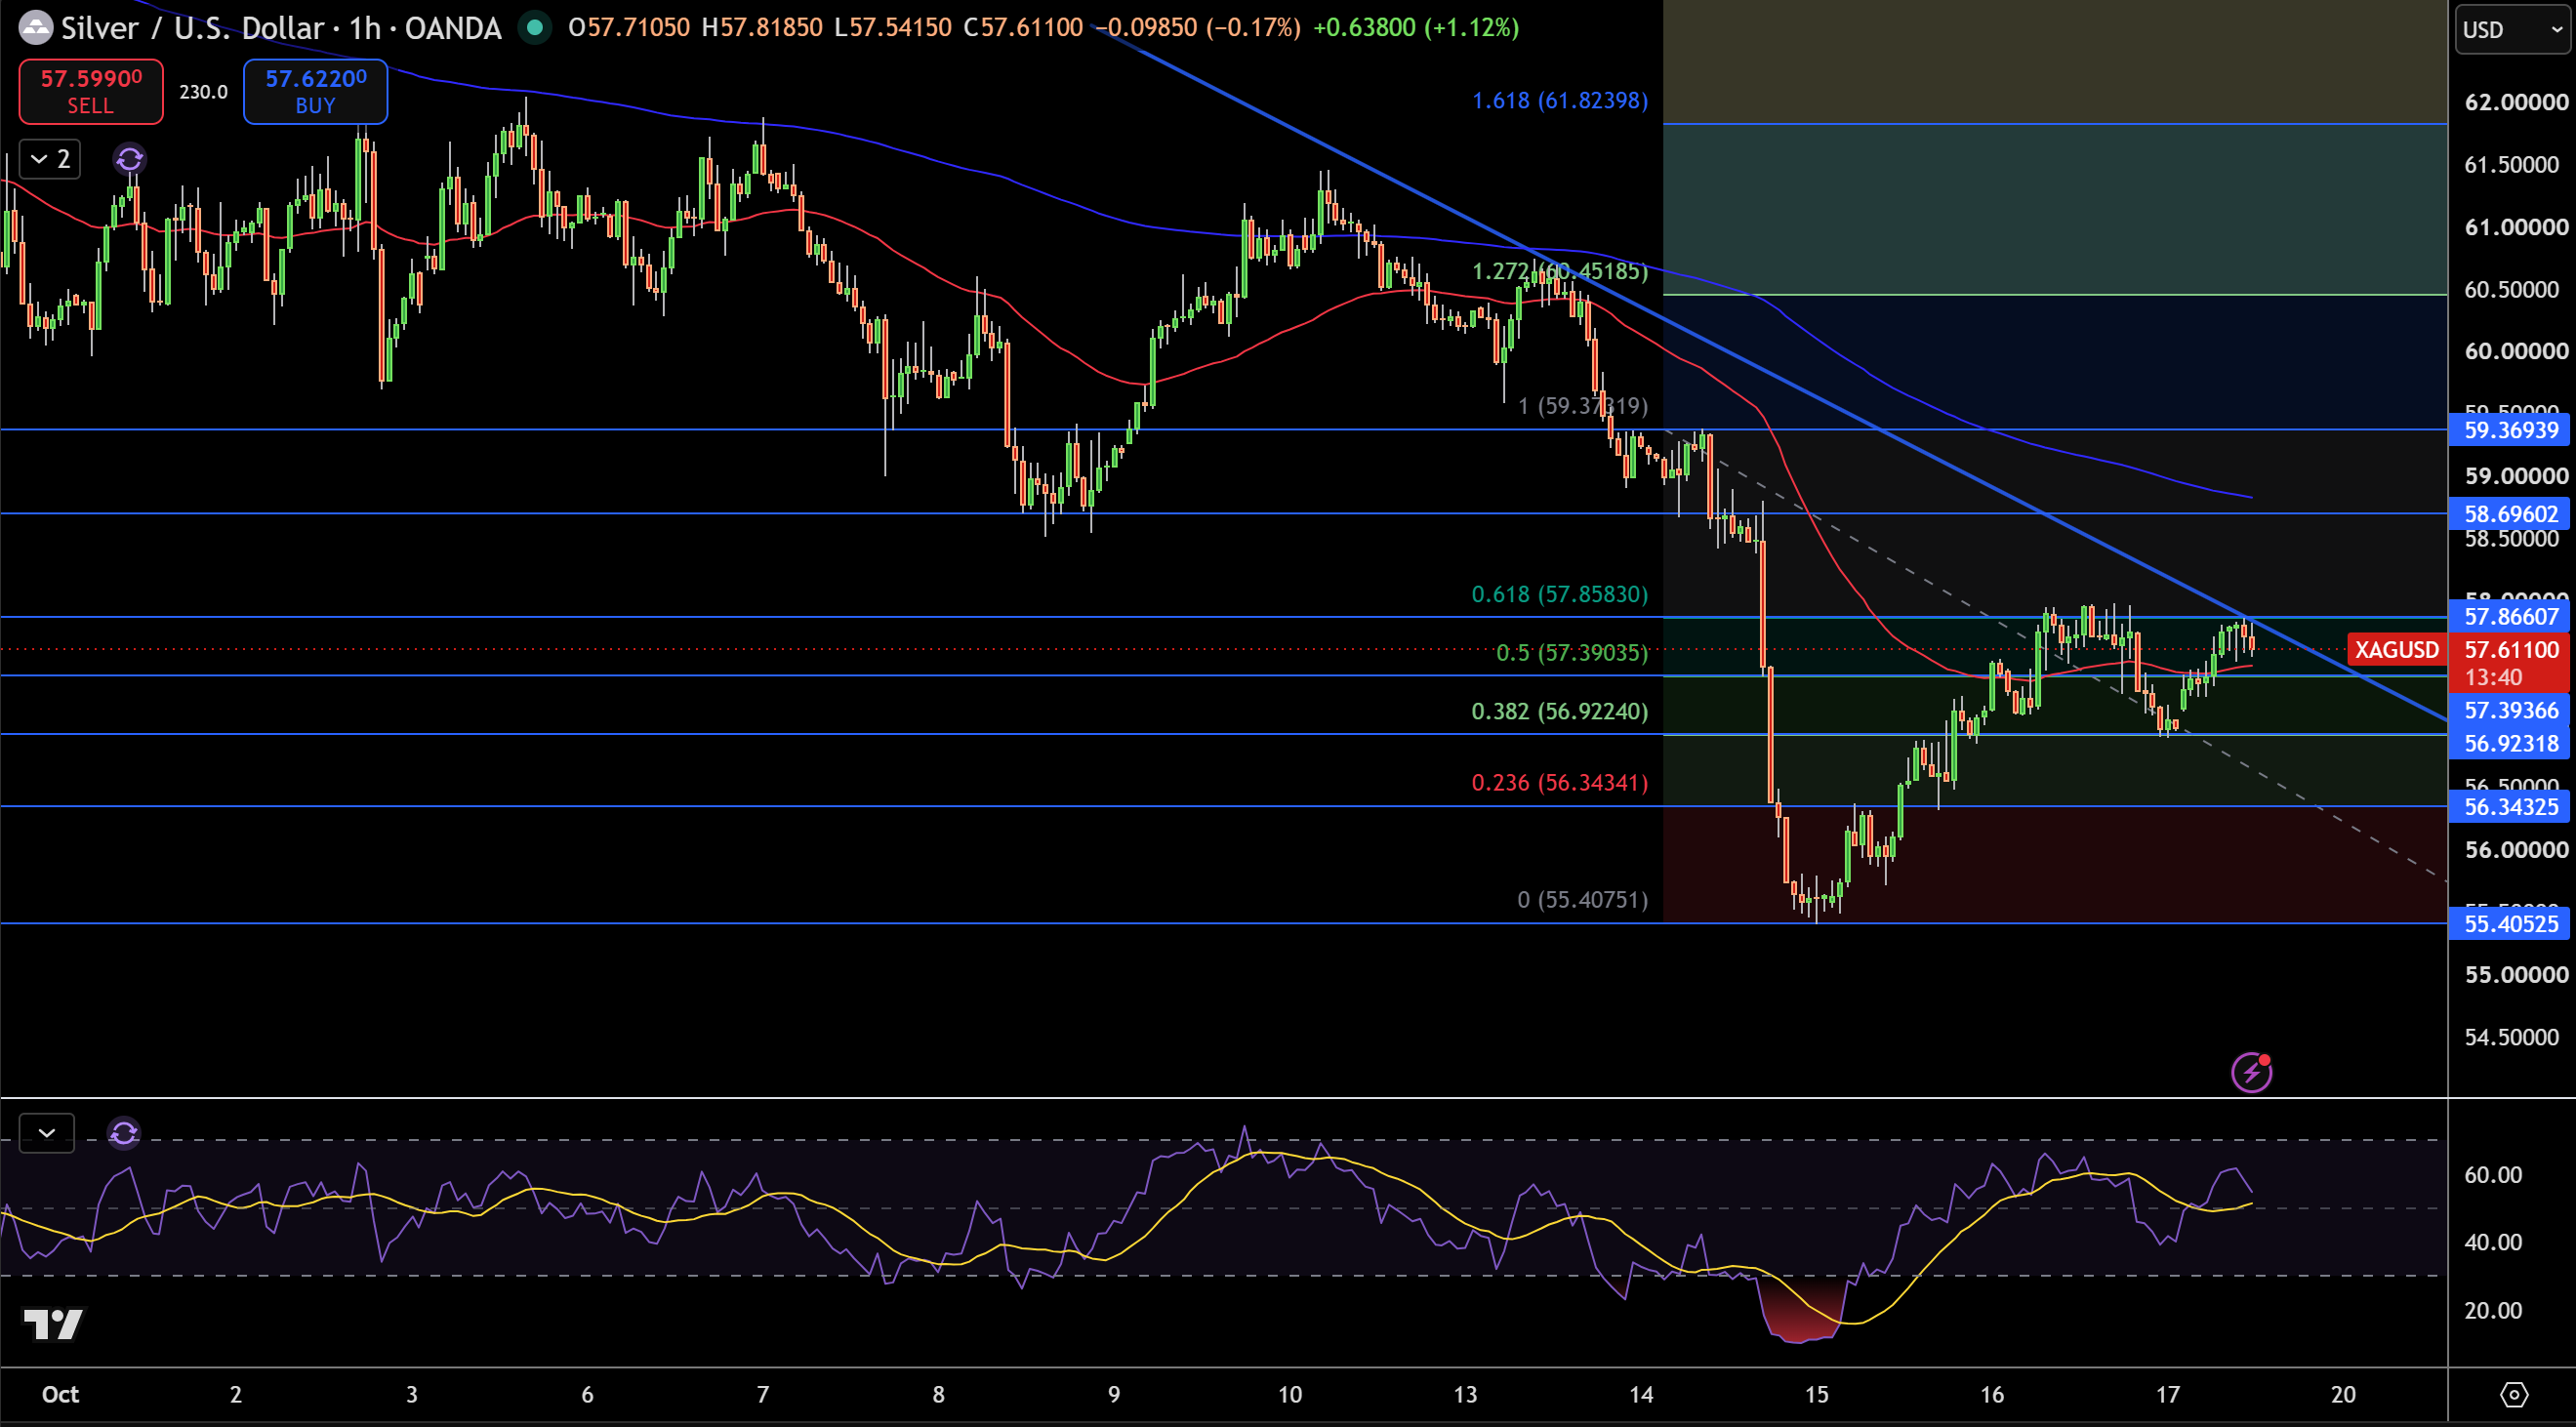
Silver is trading around $57.61 on the 1 hour chart. What stands out is that the bounce off of $55.41 has run into a key confluence at $57.86. This level is a 61.8% Fibonacci retracement, and is confluent with the longer term descending trendline from the early October highs. Price has been rejected at this trendline twice. Silver is trading above the faster moving average, but remains below the slower moving average at $58.85.
I’m looking for a break of $57.86 to open the door to $58.70, and then the $59.37 swing high. Support is at $57.39, the 50% retracement, $56.92 at the 38.2% retracement, and $56.34 at the 23.6% retracement.
RSI is at 55, and turning lower, however, it remains above the 51 signal line. This means that, while momentum is fading, it is still net positive. I remain neutral while Silver trades below the descending trendline. A break above the $57.86 level confirms a bullish breakout. A break below the $56.92 level favors a deeper correction.