So, Trump signed the deal over the weekend, right?
No. He signed nothing.
Friday’s Situation Room meeting ended with no decision. What followed was a Truth Social post listing maximalist demands: Iran must agree to never hold a nuclear weapon, the Strait of Hormuz must open immediately with no tolls in both directions, and Iran’s enriched uranium would be dug up in a joint operation and destroyed. Iran’s Fars outlet rejected the post within hours, saying it raised issues contradicting the text both sides had supposedly agreed. Over the weekend, the deal stayed out of reach. Oil bounced on the renewed deadlock, and this morning, gold is down 1.4% while crude oil is up over 3.5%.
Gold Rejects Key Resistance
I wrote on Friday that gold had reached its recent high but had not reclaimed the broken support line, and that the bounce depended on a signature which had not arrived. The signature still has not arrived. The bounce is unwinding exactly where the chart said it should.
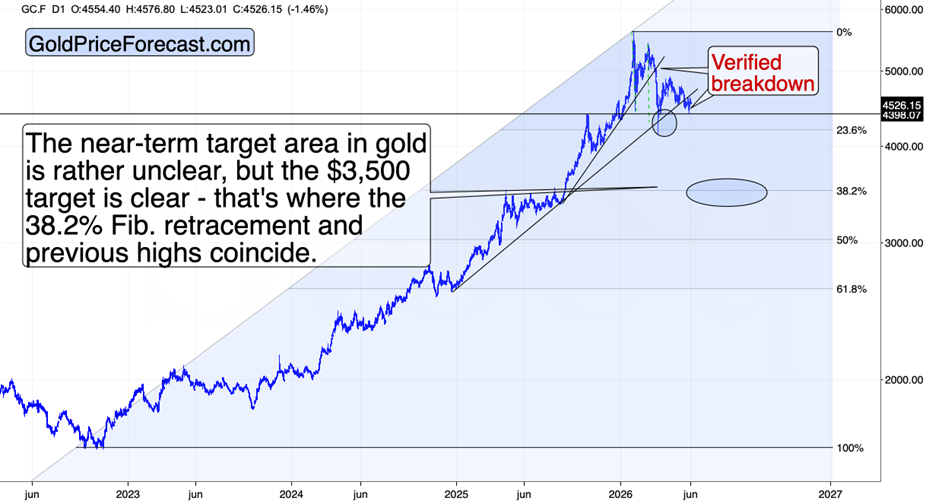
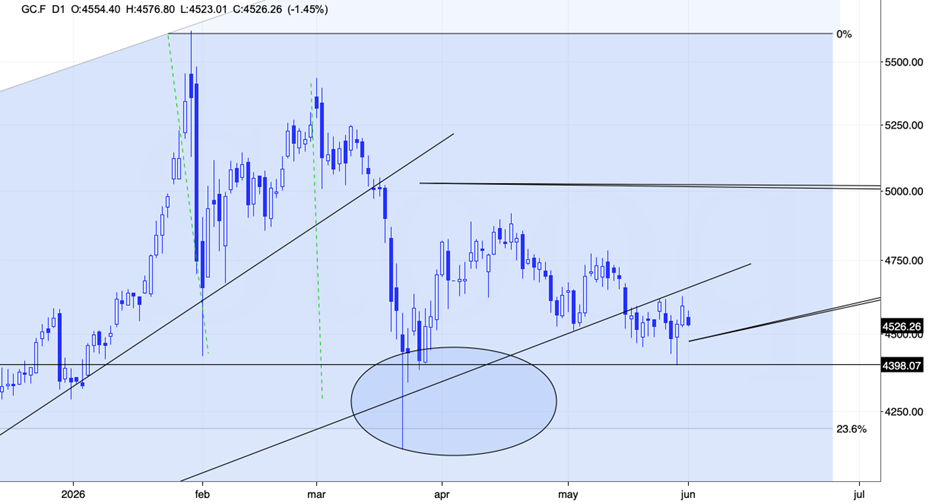
Friday’s rally was pretty much erased in today’s pre-market trading.
The back-and-forth trading that started in mid-May is boring, but it’s not neutral. It’s bearish, as it’s taking place below the rising resistance line. With each passing day, we’re getting closer to the next big move lower.
And doesn’t that remind you of something?
That steady decline that we’ve seen since mid-April?
It should, because we’ve already seen it before.
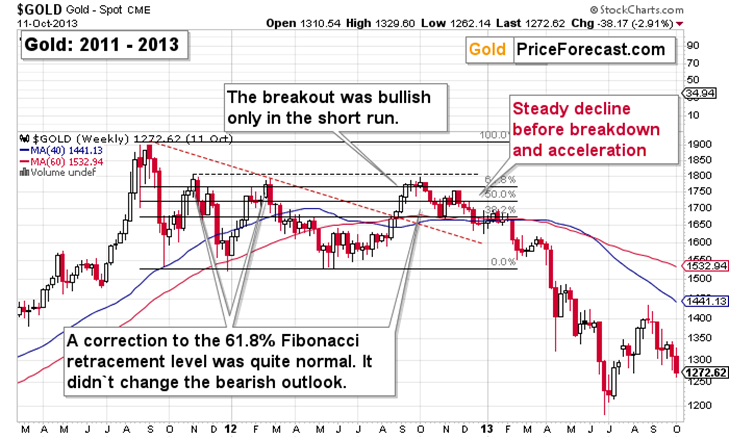
It was quite some time ago (13 years ago – time flies) when we saw something similar. Those events are very much connected despite the time gap. Both steady declines took place after a major top that was preceded by a sharp rally, and that was immediately followed by a rebound.
Gold Price Forecast
Every new Gold analysis as it publishes, today's technical signal and key levels, live price — on one page.
See all Gold forecastsA Powerhouse Dollar
Let’s keep the currency context in mind as well.
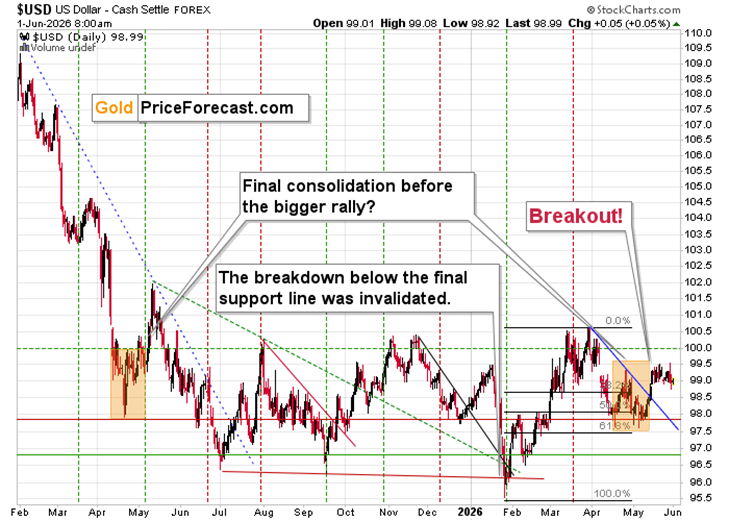
The USD Index is after a short-term breakout and after a lengthy pause. Quite a lot depends on individual geopolitical events and decisions, but technically, the USD is ripe for a rally.
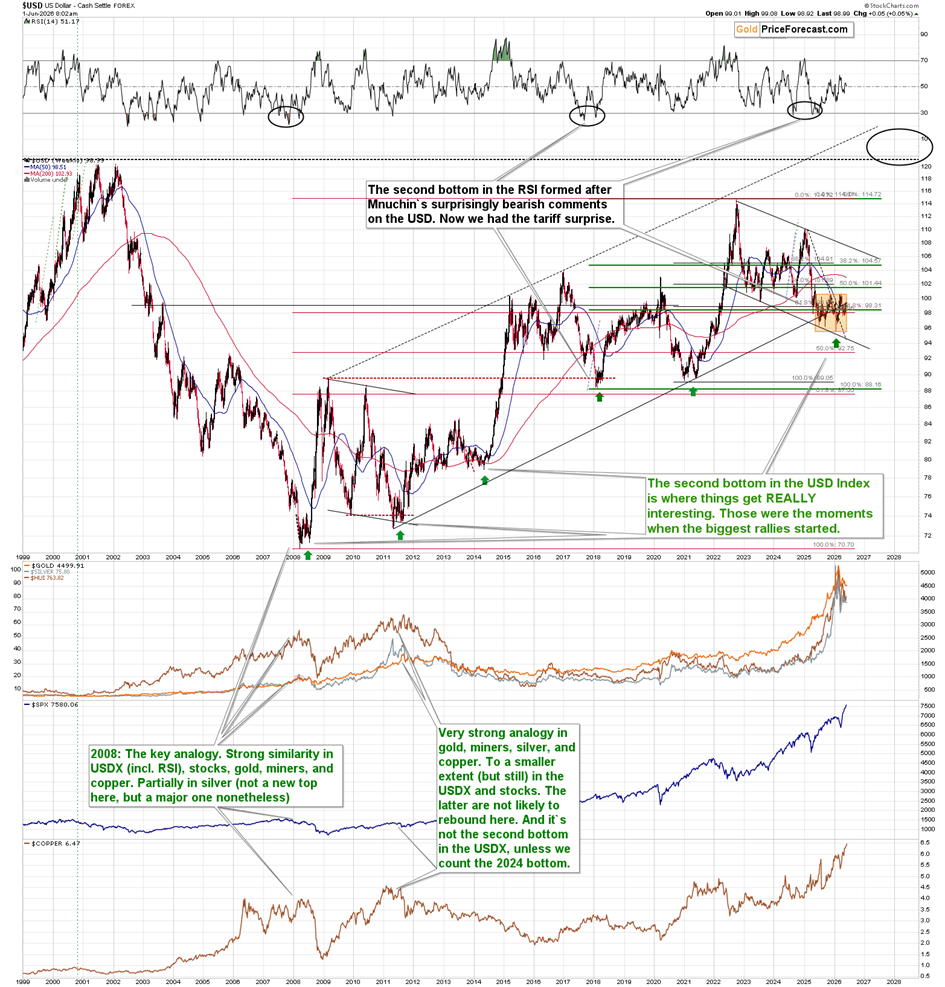
The broad “consolidations” were usually bottoms, not big pauses between big declines.
Zooming out even further allows us to see the main trend clearly.
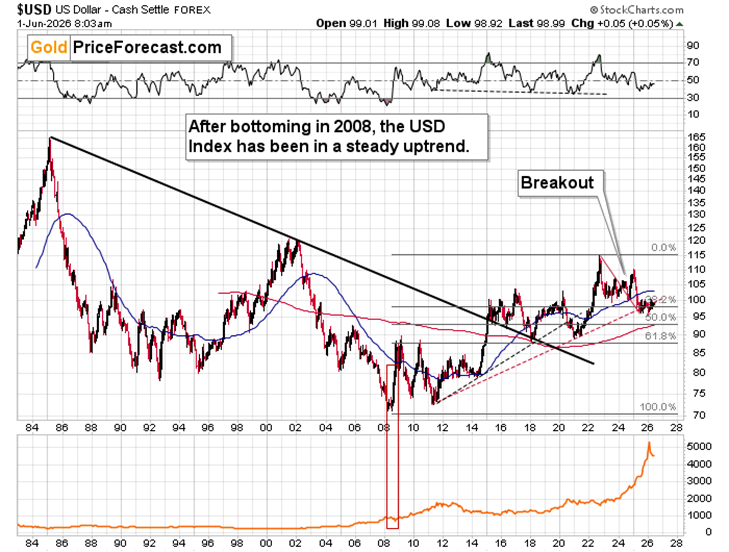
Despite the very negative narrative that the U.S. currency is getting in the precious-metals-oriented media/websites… It’s actually been on the rise since 2008! The key breakout happened in 2014/2015, and it was then verified. Right now, the USD Index is testing its rising, red support line.
Technically, it looks like the next big move will be to the upside. IF the AI bubble bursts in the following months, taking stocks lower, we can expect a sharp rally, similar to what we saw in 2008.
The precious metals market is not at a point similar to 2008, though, but to 2012-2013 – it’s more vulnerable to a huge decline given the massive rally in the preceding months.
This means that the big move higher in the USD Index could trigger a really (!) substantial decline in the prices of precious metals and mining stocks.
One more thing before wrapping it up for today.
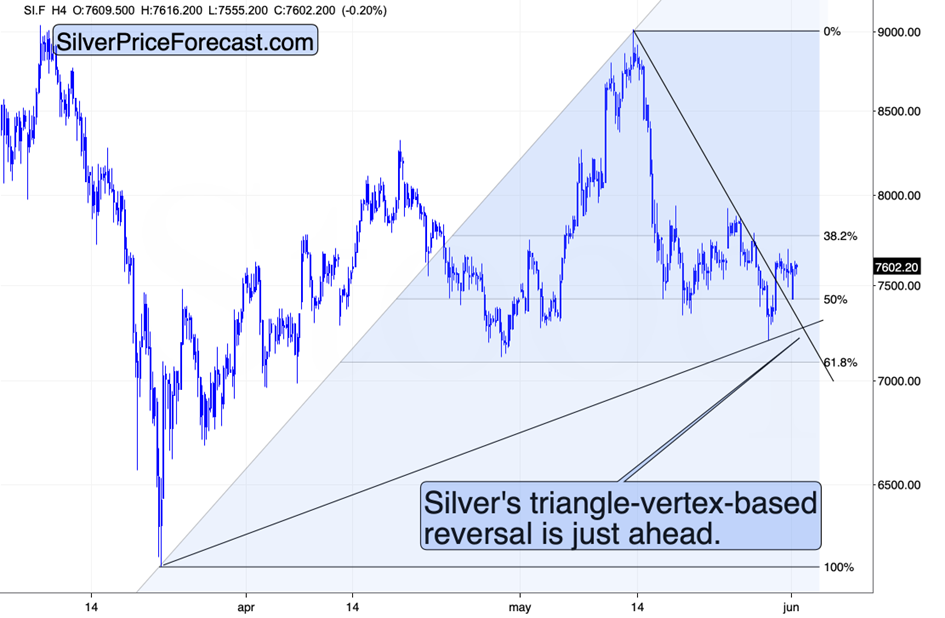
Silver’s triangle-vertex-based turning point is just ahead, and silver is holding up quite well today. It could be the case that we’ll get one final quick move up that would fail and trigger declines across the board (in case of the precious metals sector).
The outlook for the following weeks/months remains bearish.
As always, I’ll keep my subscribers updated.
Thank you for reading today’s analysis – I appreciate that you took the time to dig deeper and that you read the entire piece. If you’d like to get more (and extra details not available to 99% investors), I invite you to stay updated with our free analyses – sign up for our free gold newsletter now.
Thank you.
Sincerely,
Przemyslaw K. Radomski, CFA