



Key Insights

- Brent and WTI crude poised for 6% weekly gain amid ongoing Middle East tensions.
- New U.S. sanctions and Chinese deflationary pressures add complexity to oil price dynamics.
- Natural gas dips significantly, reflecting a bearish sentiment and potential for further decline.
Oil Prices Steady Amid Middle East Tensions and Global Dynamics
Oil prices remained relatively steady on Friday, with both Brent crude and West Texas Intermediate (WTI) crude experiencing minor adjustments, yet poised for a nearly 6% weekly gain amidst ongoing Middle East tensions.
This is after Israel declined a ceasefire proposal from Hamas, escalating conflicts particularly around Rafah. The situation has introduced a conflict-premium into oil prices, underscoring the market’s sensitivity to geopolitical developments.
Despite the tensions, there has been no direct impact on oil production, even as non-OPEC countries like Norway and Guyana ramp up output and Russia’s exports exceed OPEC+ commitments due to refinery issues.
Additionally, new U.S. sanctions on entities and a tanker for breaching the Russian oil price cap, coupled with deflationary pressures in China, are influencing global oil price dynamics.
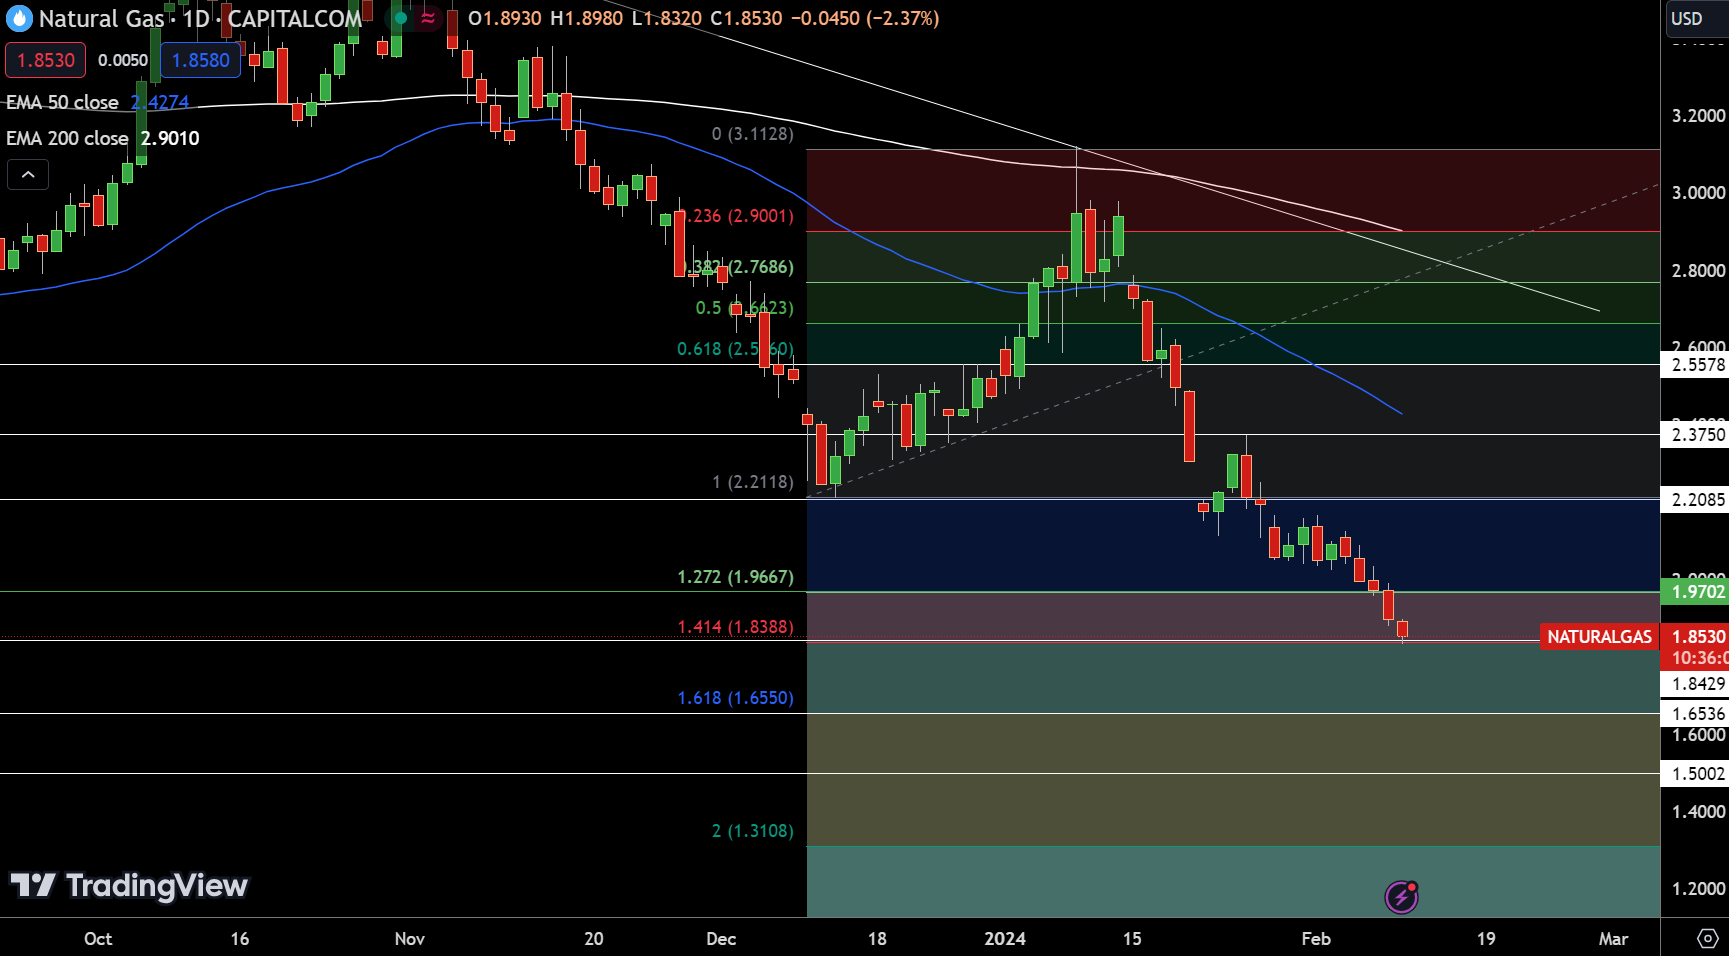
Natural Gas (NG) on February 9, 2024, reflects a significant downtrend, with the price decreasing by 3.16% to $1.8380. This movement underscores a bearish market sentiment as prices dip well below the pivot point of $1.9702.
The resistance levels are set at $2.2085, $2.3750, and $2.5578, marking the thresholds for potential upward movements. Conversely, immediate support levels are identified at $1.8429, with further supports at $1.6536 and $1.5002, indicating the areas where price declines may find a floor.
The 50-Day and 200-Day Exponential Moving Averages, positioned at $2.4274 and $2.9010 respectively, further accentuate the bearish trend, as the current price remains substantially below these averages.
This technical landscape suggests a continued bearish outlook for Natural Gas unless it surpasses the pivotal $1.9702 mark.
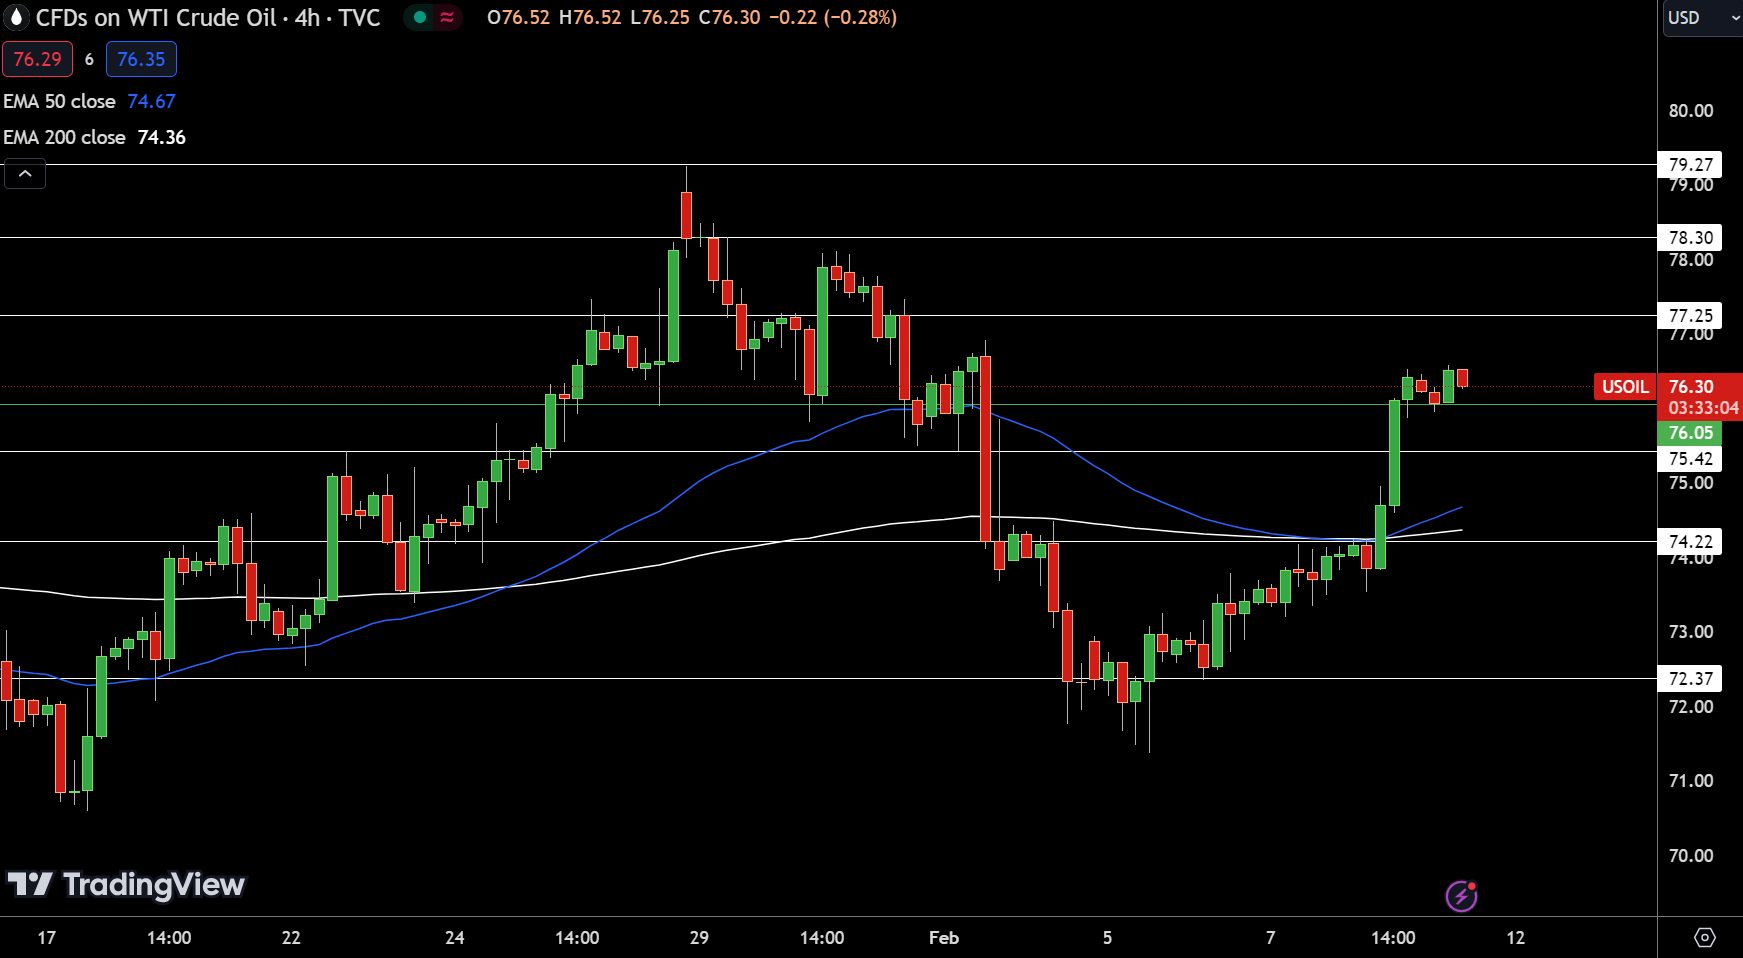
USOIL’s technical analysis for February 9, 2024, reveals a modest uptick, with prices rising by 0.19% to reach $76.25. Positioned just above the pivot point of $76.05, USOIL hints at a bullish inclination in the immediate term.
The resistance levels are identified at $77.25, $78.30, and $79.27, each representing potential obstacles for upward price movement. On the downside, support levels at $75.42, $74.22, and $72.37 provide layers of protection against declines.
Both the 50-Day and 200-Day Exponential Moving Averages, at $74.67 and $74.36 respectively, reinforce a bullish outlook, given that the price maintains its stance above these averages.
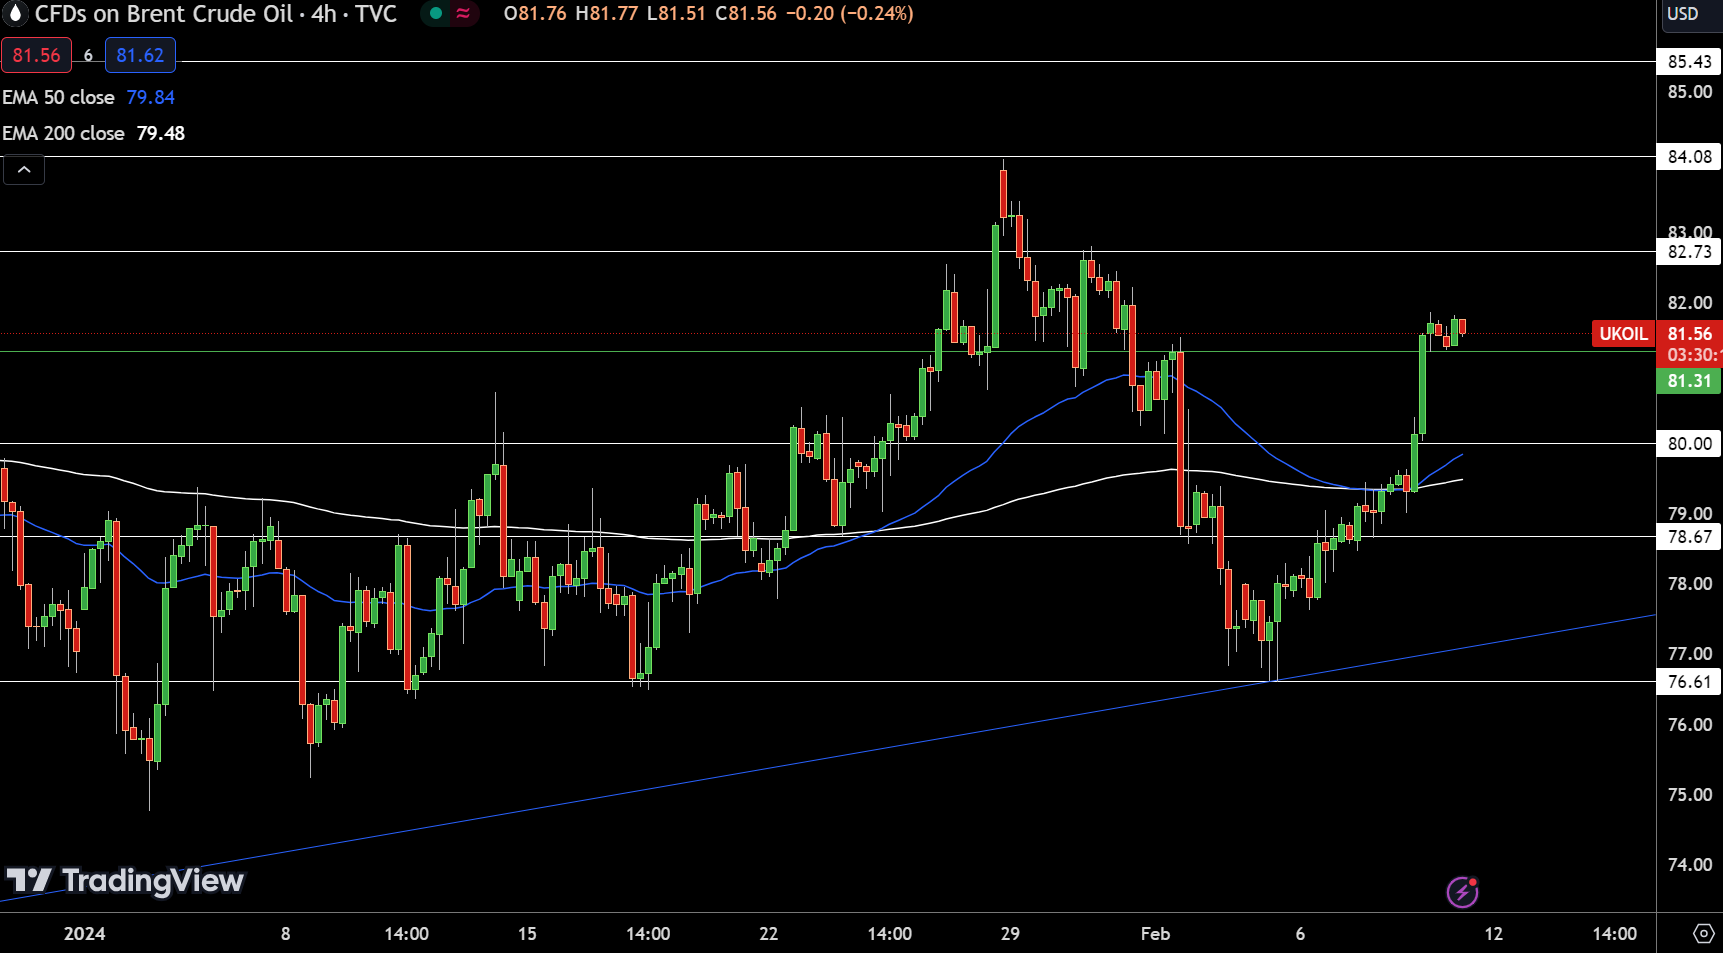
UKOIL’s technical landscape on February 9, 2024, mirrors a slight downward adjustment, marking a 0.21% decrease to settle at $81.55. This movement places it intriguingly above the pivot point of $81.31, suggesting a possible bullish sentiment in the short term.
Resistance levels are mapped out at $82.73, $84.08, and $85.43, potentially capping upward moves. Conversely, support figures are established at $80.00, $78.67, and $76.61, which could provide floors to bearish dips.
The 50-Day and 200-Day Exponential Moving Averages, at $79.84 and $79.48 respectively, underscore a bullish trend as long as prices hover above these markers.



