



Key Insights

- Oil Prices Rise Amid Middle East Tensions: Oil prices see gains with Brent crude at $78.03/barrel and WTI at $72.76/barrel, as geopolitical tensions in the Middle East escalate.
- USOIL and UKOIL Await Key Data: Both USOIL and UKOIL trends are influenced by upcoming U.S. labor data and Euro zone inflation, impacting market dynamics.
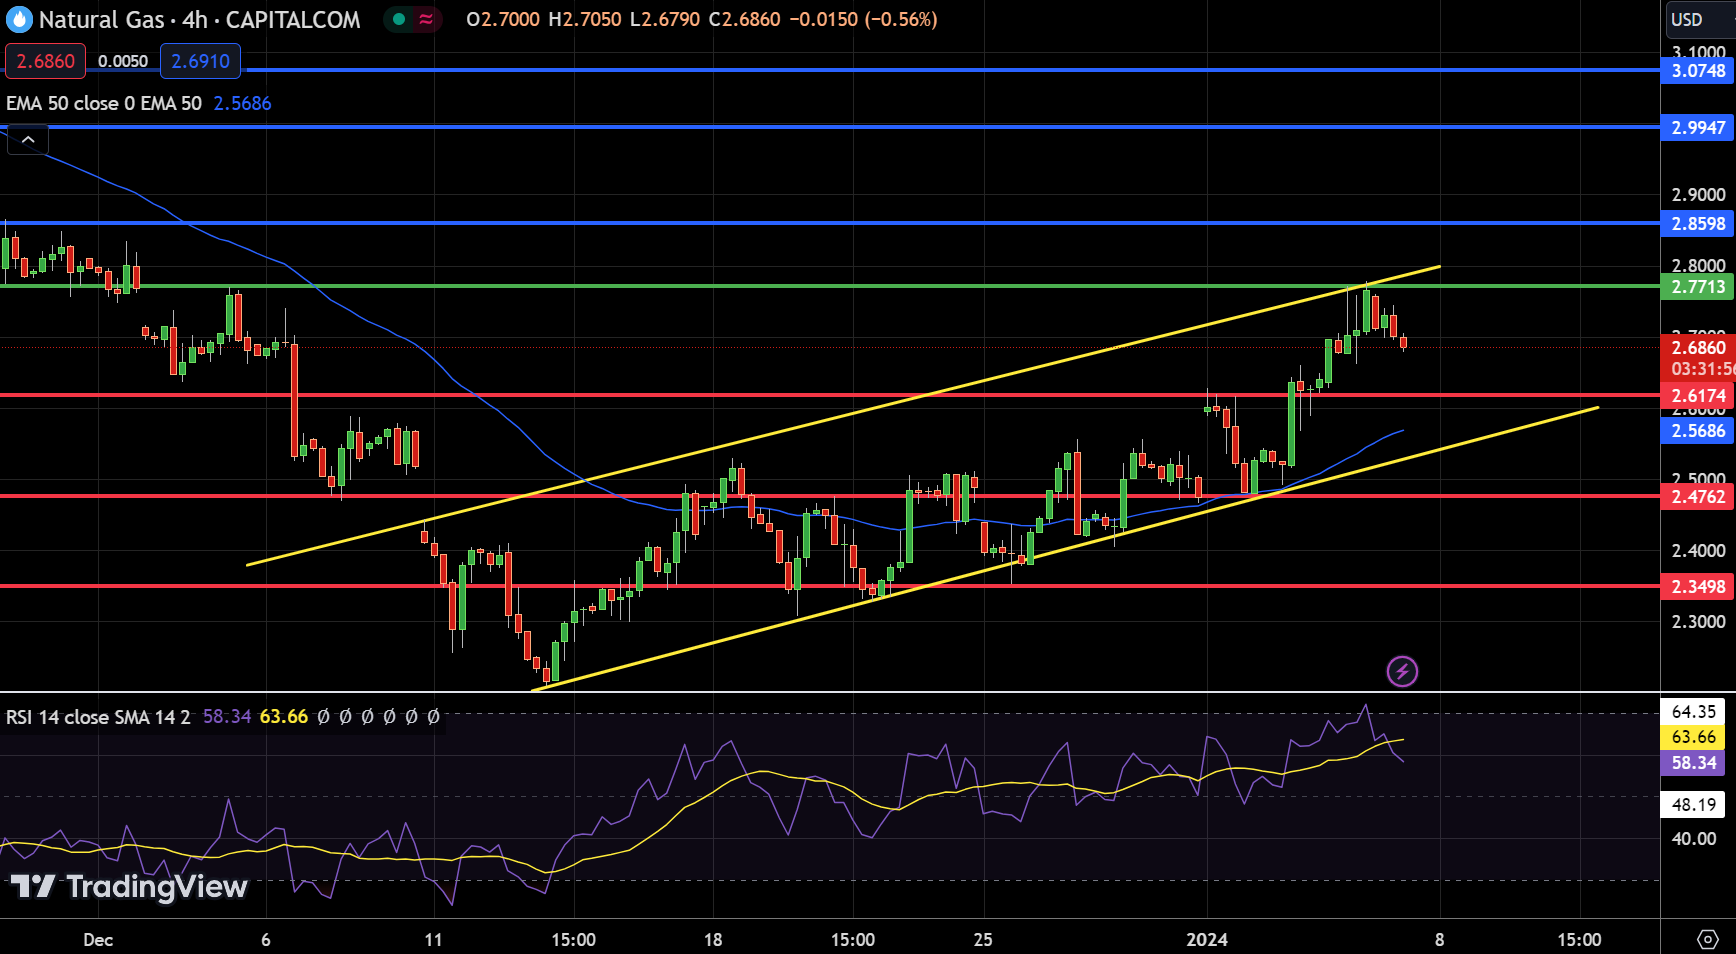
- Natural Gas Faces Downward Pressure: Natural Gas trades at $2.69, down by 2.71%, with a bearish sentiment below the $2.77 pivot point.
Quick Fundamental Outlook
WTI Oil Price Forecast
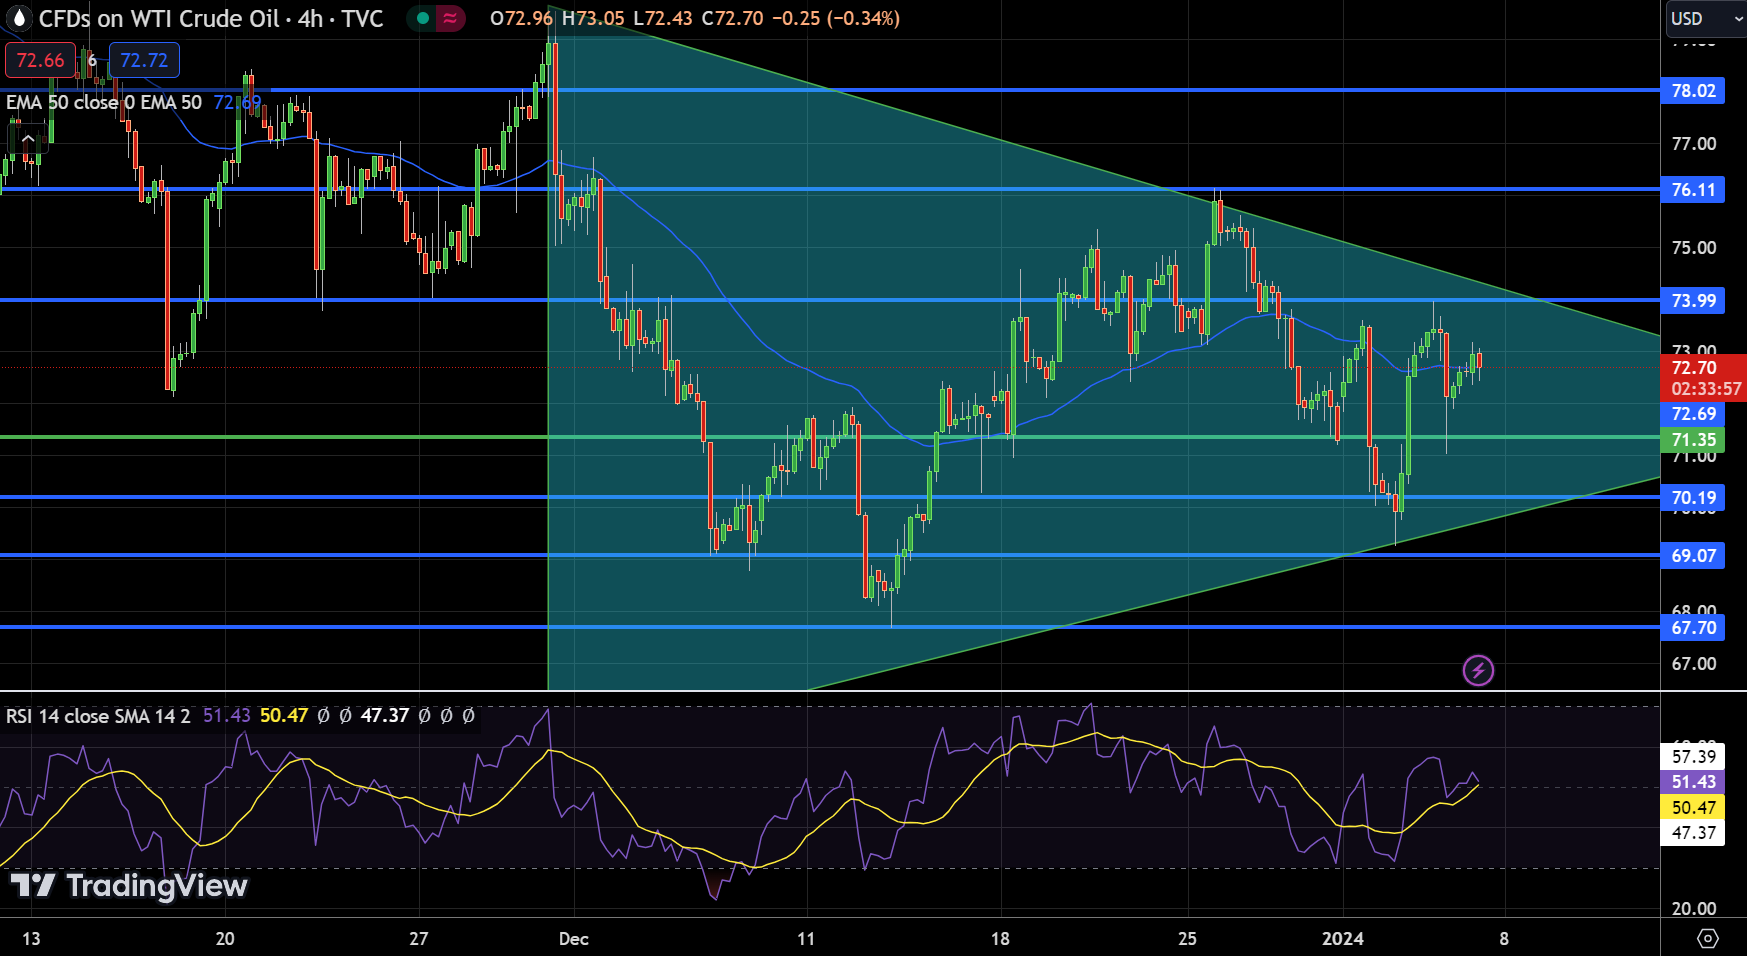
US Oil (USOIL) currently displays a modest rise in its market dynamics, trading at $72.58 with a 0.34% increase. The technical landscape of USOIL is framed by several key levels: a pivotal point at $71.35 and immediate resistance levels at $73.99, $76.11, and $78.02.
Meanwhile, support levels are set at $70.19, $69.07, and $67.70. The Relative Strength Index (RSI) stands at 51.00, indicating a neutral to slightly bullish sentiment. The 50-Day Exponential Moving Average (EMA) at $72.710 suggests a narrow bullish trend. A significant chart pattern is the symmetrical triangle, indicating consolidation within a narrow range.
The current technical outlook for USOIL is neutral to bearish, especially if it falls below the $73 mark. Investors and market analysts will be closely watching these technical indicators for future direction cues.
Brent Oil Price Forecast
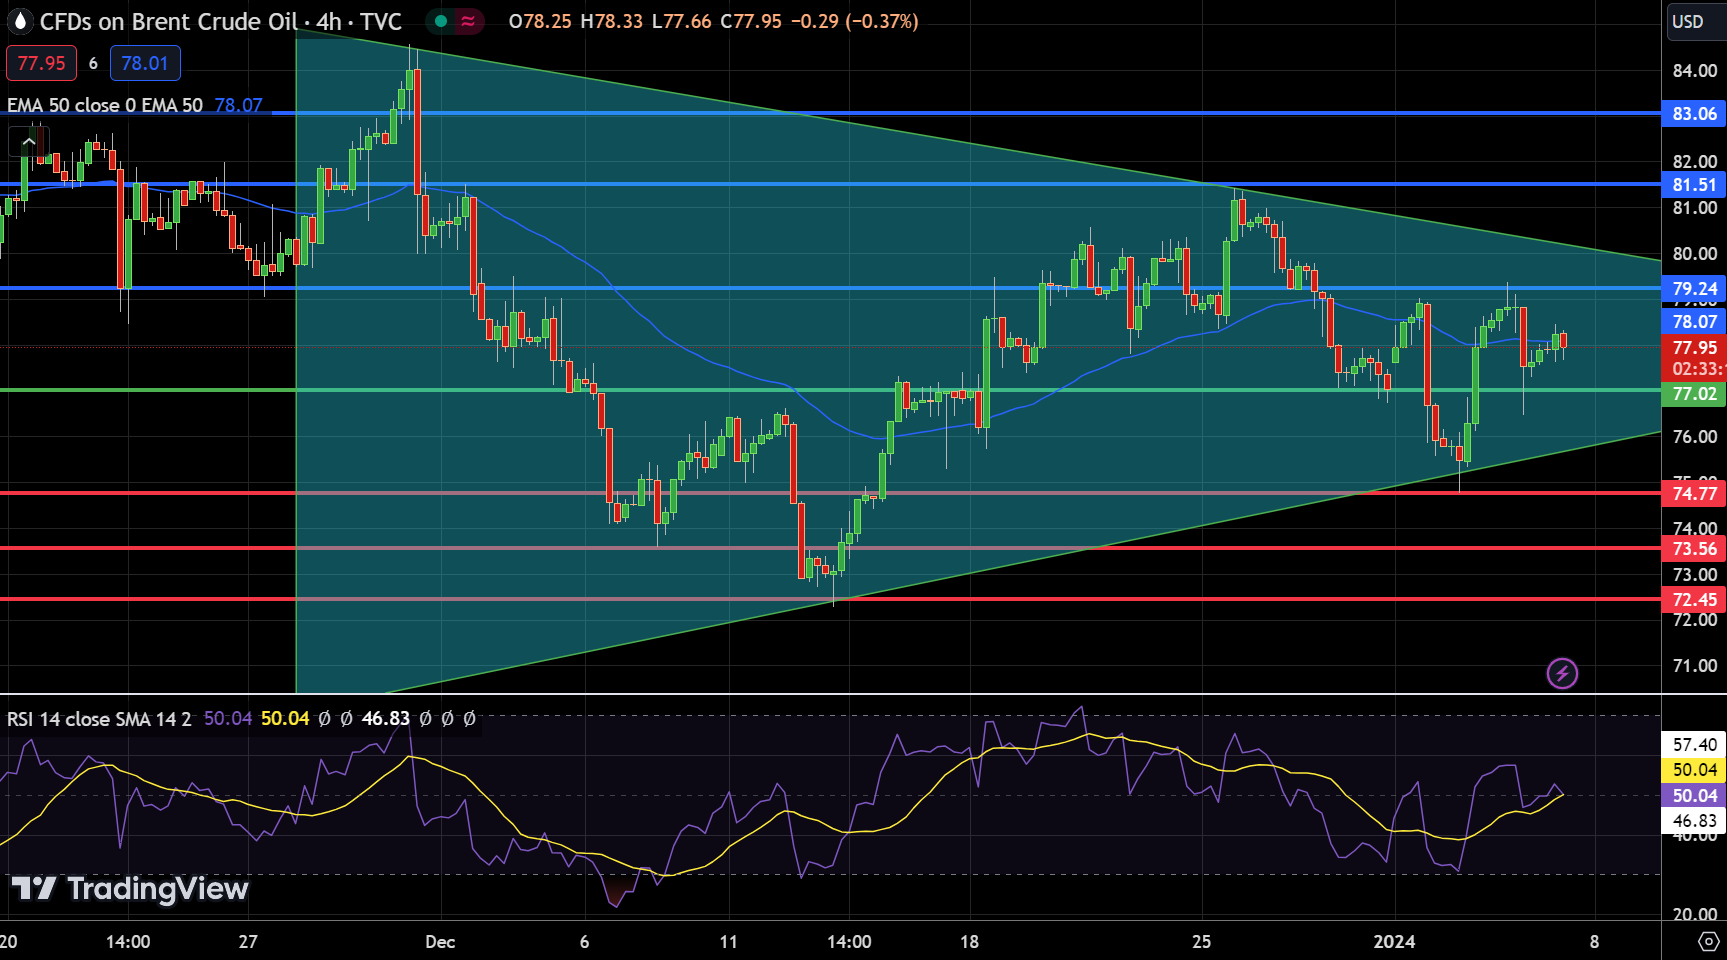
UK Oil (UKOIL) exhibits a subtle increase in its market position, trading at $77.79, a rise of 0.23%. The technical analysis presents a pivot point at $77.02, with key resistance levels identified at $79.24, $81.51, and $83.06. Support for UKOIL lies at $74.77, $73.56, and $72.45.
The Relative Strength Index (RSI) sits at a neutral 50.00, indicating an equilibrium between bullish and bearish sentiments. The 50-Day Exponential Moving Average (EMA) at $78.07 suggests a slight bearish trend. Currently, a symmetrical triangle pattern is observed, indicating a consolidation phase.
The overall trend for UKOIL leans towards bearish, particularly if it remains below the $80 threshold. This near-term outlook suggests potential downward movements unless key resistance levels are surpassed.


