



Key Insights

- WTI and Brent crude oil face downward trends amid mixed global signals and regional conflicts.
- Natural Gas plunges, influenced by domestic and international economic factors, indicating bearish short-term sentiment.
- Oil prices await direction from central bank decisions and economic data amidst fluctuating demand forecasts.
Quick Fundamental Outlook
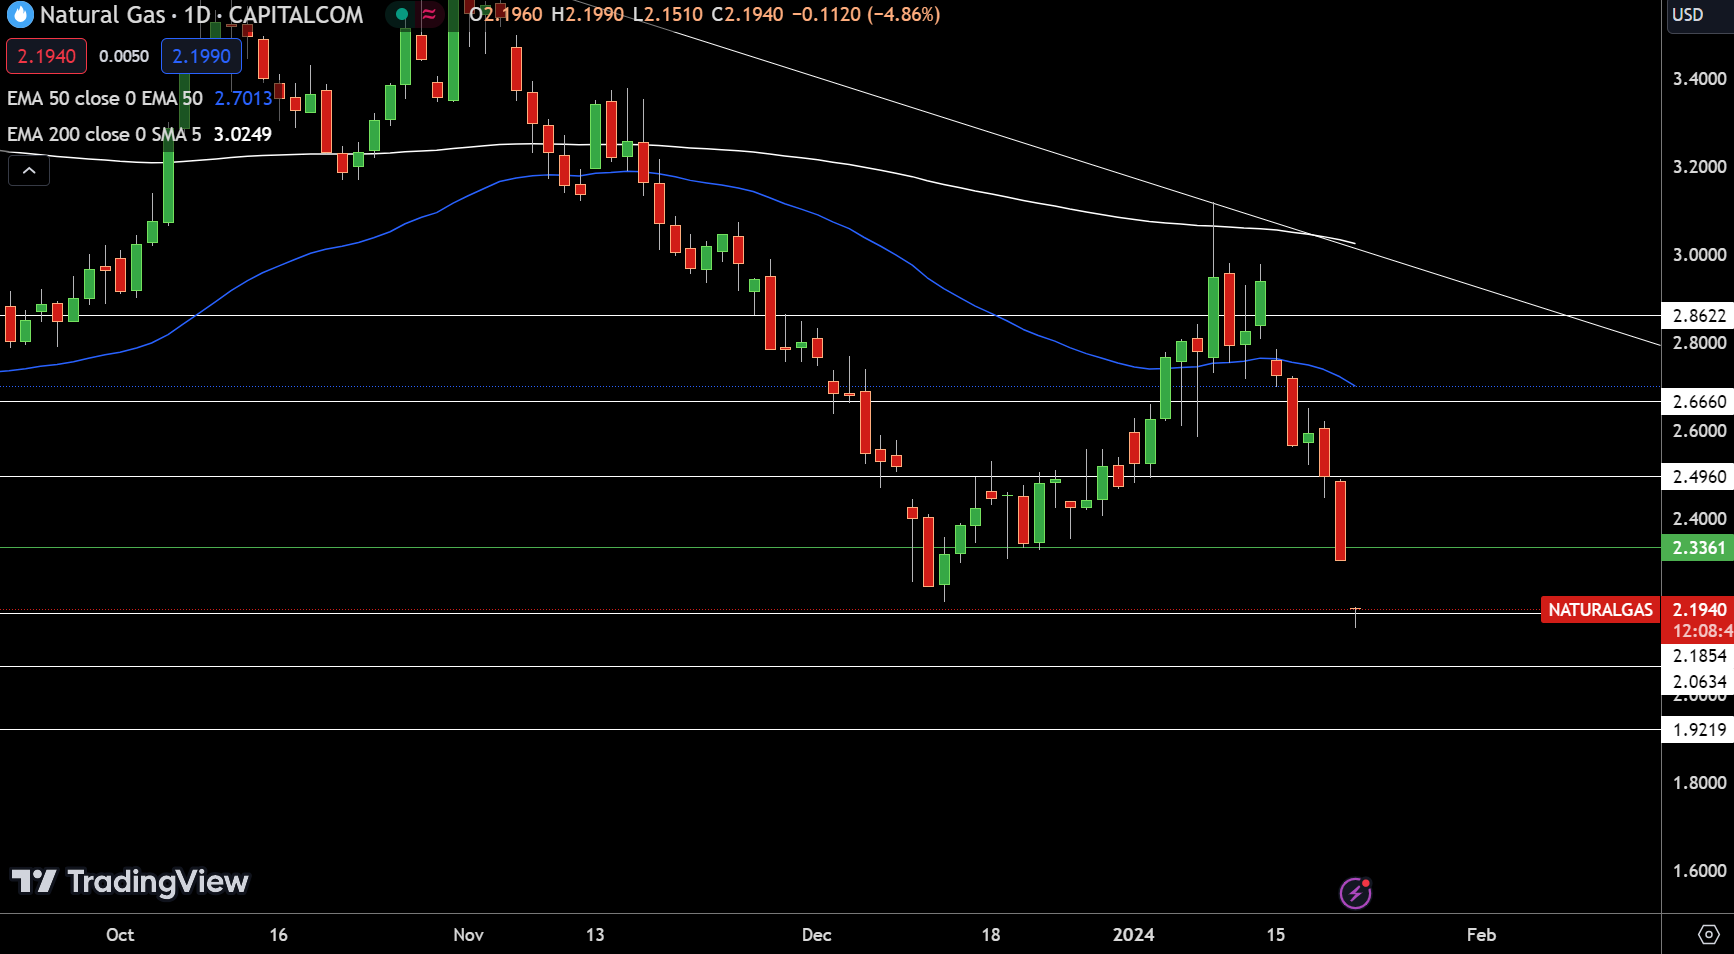
Natural Gas (NG) is witnessing a significant decline, currently trading down 4.77% at $2.194. On its 4-hour chart, a critical pivot point is identified at $2.3361, pivotal for short-term market direction. If NG breaks below this level, support may be found at $2.1854, $2.0634, and $1.9219.
Conversely, resistance levels in case of an upward trend are at $2.4960, $2.6660, and $2.8622. The 50-day and 200-day EMAs, at $2.7013 and $3.0249 respectively, demonstrate a notable decline from the average prices, reinforcing a bearish sentiment.
WTI Oil Price Forecast
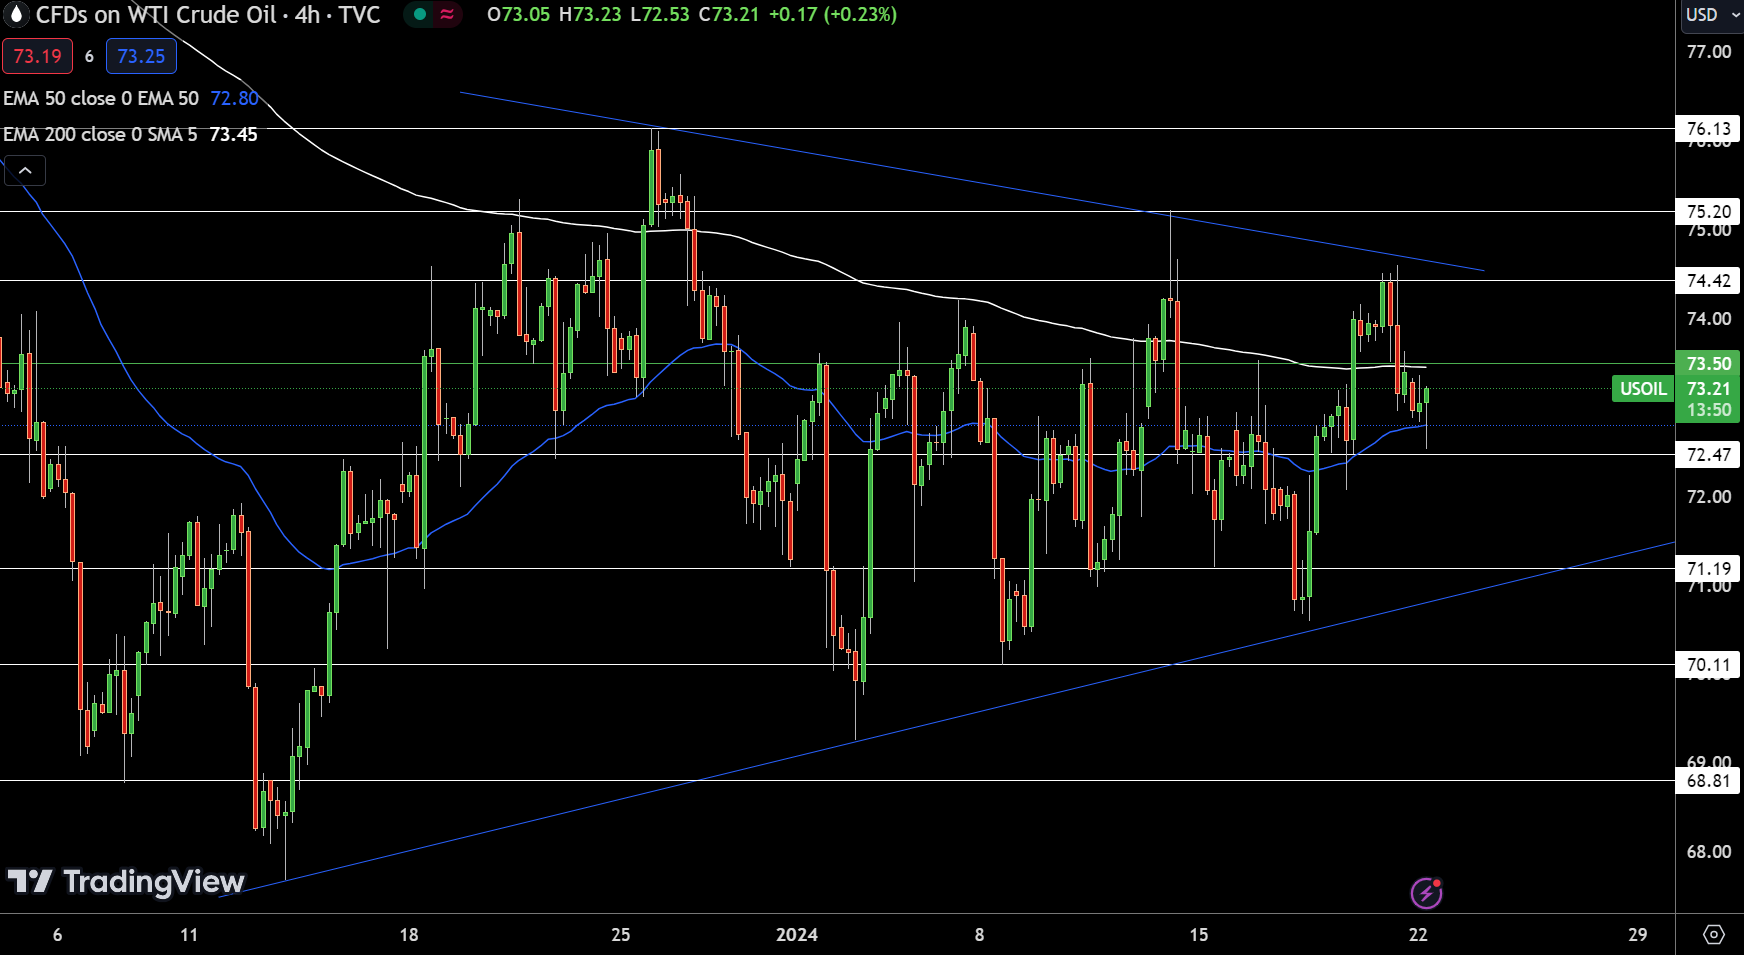
West Texas Intermediate (WTI) crude oil is trading at $73.21, a 0.24% decrease. Its 4-hour chart shows a pivotal point at $73.50. Resistance lies at $74.42, $75.20, and $76.13. If the price drops, support exists at $72.47, $71.19, and $70.11.
The 50-day EMA is at $72.80 and the 200-day EMA at $73.45, indicating a market in consolidation. A double top resistance pattern at $74.42 suggests potential selling pressure.
The overall market is balanced, with resistance at $74.45 and support near $71.20. WTI crude oil’s trend is bearish below the $73.50 pivot, suggesting a likelihood of further declines in the short term.
Brent Oil Price Forecast
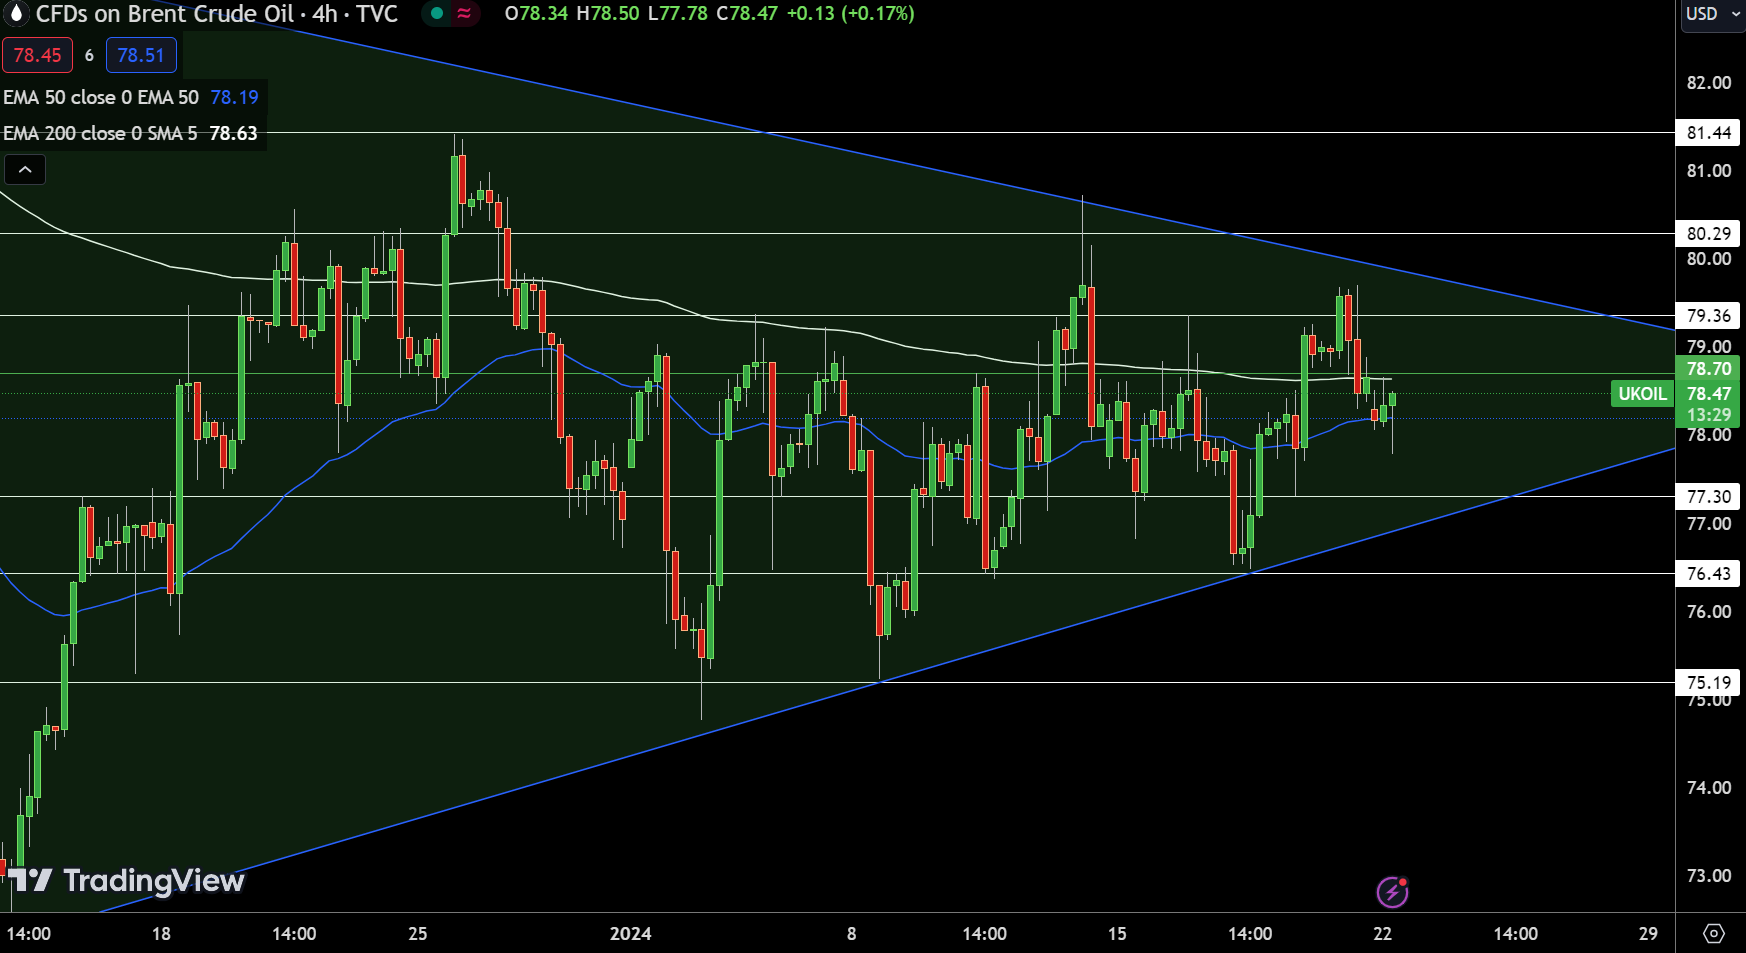
UK Oil (Brent crude) trades at $78.47, down 0.20%, with the 4-hour chart showing a pivot point at $78.70. Resistance is noted at $79.36, $80.29, and $81.44, while support is at $77.30, $76.43, and $75.19. The 50-day and 200-day EMAs are at $78.19 and $78.63, respectively, suggesting stability.
A consolidation phase is indicated by a double top resistance near $80. The current market pattern shows Brent crude oscillating within a range, hinting at bearish sentiment below the pivot point of $78.70.
This indicates a cautious market, waiting for a decisive move for the next trend direction.


