



Oil Faces Diplomacy Test as Natural Gas Recovery Meets Ample Storage
December WTI trades near $89.88 per barrel, January Brent near $96.81 per barrel and December natural gas near $3.032 per MMBtu. Oil traders are watching the Iran talks for signs that tankers can move more reliably through the Strait of Hormuz. For natural gas, above-average storage provides a cushion as traders assess whether changing weather will strengthen heating demand.
WTI and Brent: Talks Have Yet to Resolve Shipping Risks
President Donald Trump said further attacks on Iran were highly unlikely if negotiations progressed, Reuters reported Sunday. Both countries also reported incidents involving vessels in or near the Strait of Hormuz. Reuters could not independently confirm the reported strikes. No comprehensive agreement has been announced, so a softer diplomatic tone still needs to be followed by reliable tanker movements before it establishes a sustained recovery in physical supply.
Seven OPEC+ producers agreed on November 1 to maintain September 2026 required production levels for December, according to the OPEC statement. The next meeting is scheduled for November 29. Those are production targets; they do not establish how much oil can reach buyers while shipping remains disrupted. Actual output and exports remain central to the oil supply outlook.
Natural Gas: Storage Cushion Meets an Uneven Weather Outlook
The EIA’s November 5 storage report showed a 77bn-cubic-foot injection, meaning gas added to underground storage. Inventories reached 3.801tn cubic feet for the week ended October 30, 1.4% above the five-year average but below year-earlier levels. That surplus gives the market some protection against a seasonal increase in demand.
NOAA’s November 8 outlook favors above-normal temperatures across much of the central US during November 14 to 18, but near- to below-normal conditions in the East. Heating demand could therefore strengthen unevenly across regions. The next EIA report is scheduled for November 13, delayed from the usual Thursday release by the Veterans Day holiday. The key test is whether stronger consumption begins to reduce the storage surplus.
Natural Gas Price Forecast
Every new Natural Gas analysis as it publishes, today's technical signal and key levels, live price — on one page.
See all Natural Gas forecastsNatural Gas Technical Analysis: $3.001 Break Supports Recovery Toward $3.124
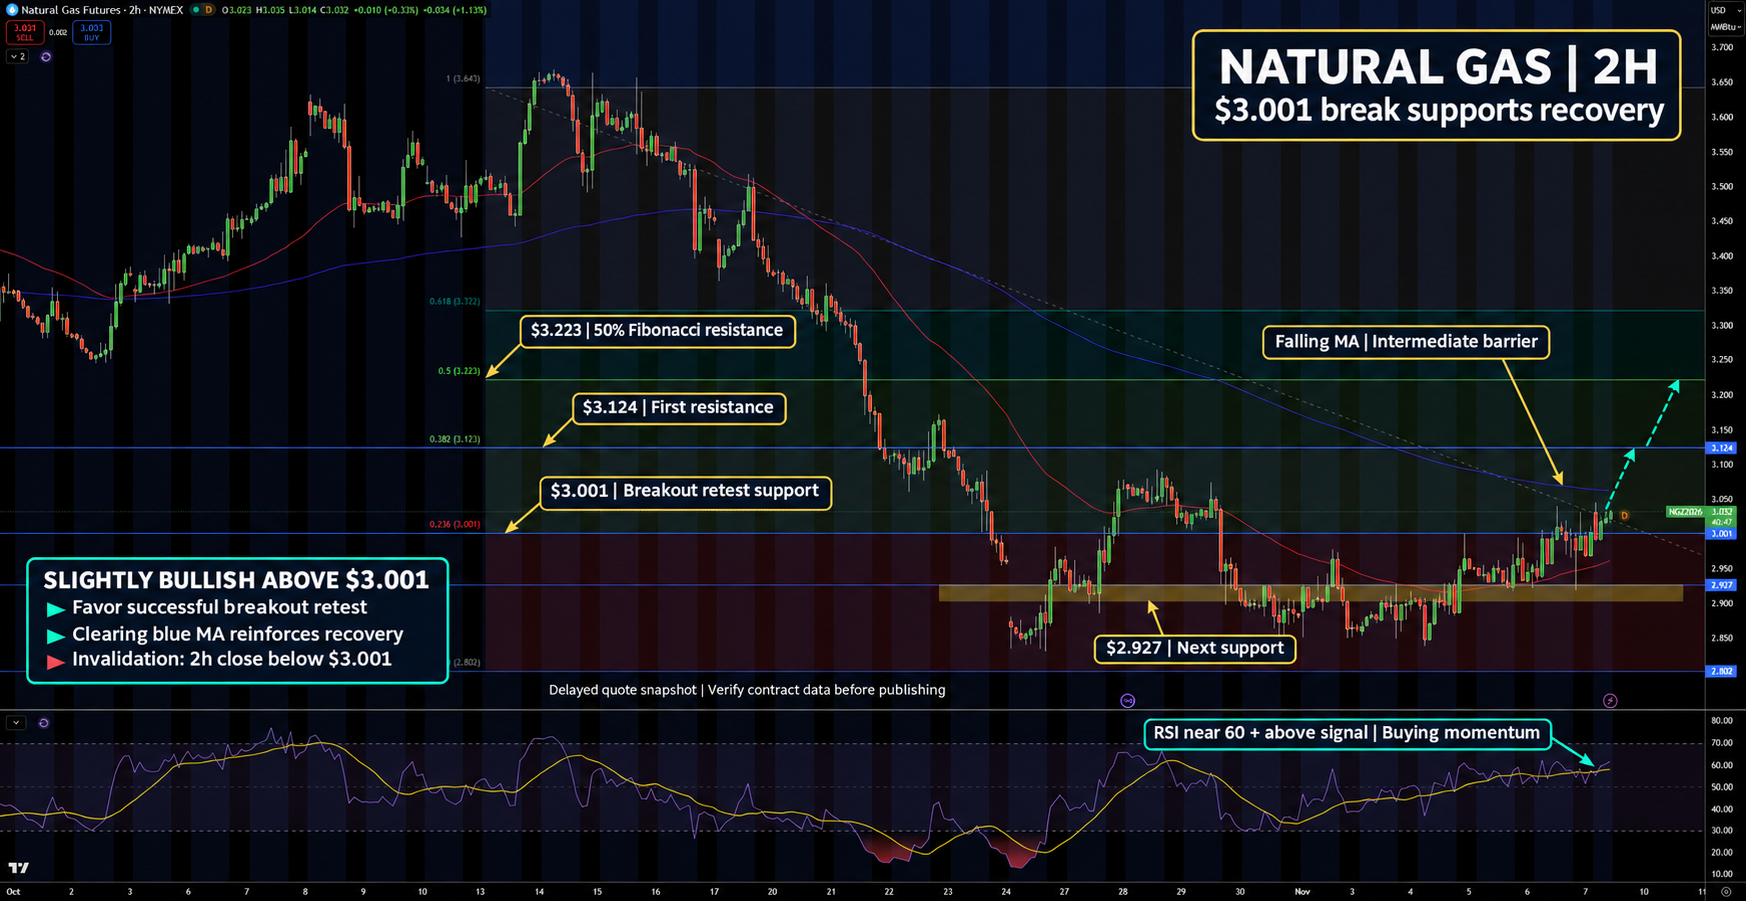
December natural gas futures trade near $3.032/MMBtu, or per million British thermal units, on the two-hour NYMEX chart. Price has pushed above $3.001 and the rising red moving average, which tracks average prices over time. The falling blue moving average remains overhead, so the recovery still has a nearby barrier to clear.
The next marked resistance, where sellers may return, is $3.124, followed by the 50% Fibonacci level at $3.223, halfway back through the marked decline. Support, where buyers may step in, stands at $3.001, then $2.927. RSI, a 0 to 100 gauge of buying and selling strength, is near 60 and above its signal line, a slower average of RSI. I lean slightly bullish, favoring a successful retest of $3.001. Clearing the blue moving average would strengthen that view; a two-hour close below $3.001 would invalidate the immediate breakout setup.
WTI Crude Oil Technical Analysis: Recovery Stalls Beneath $93.33
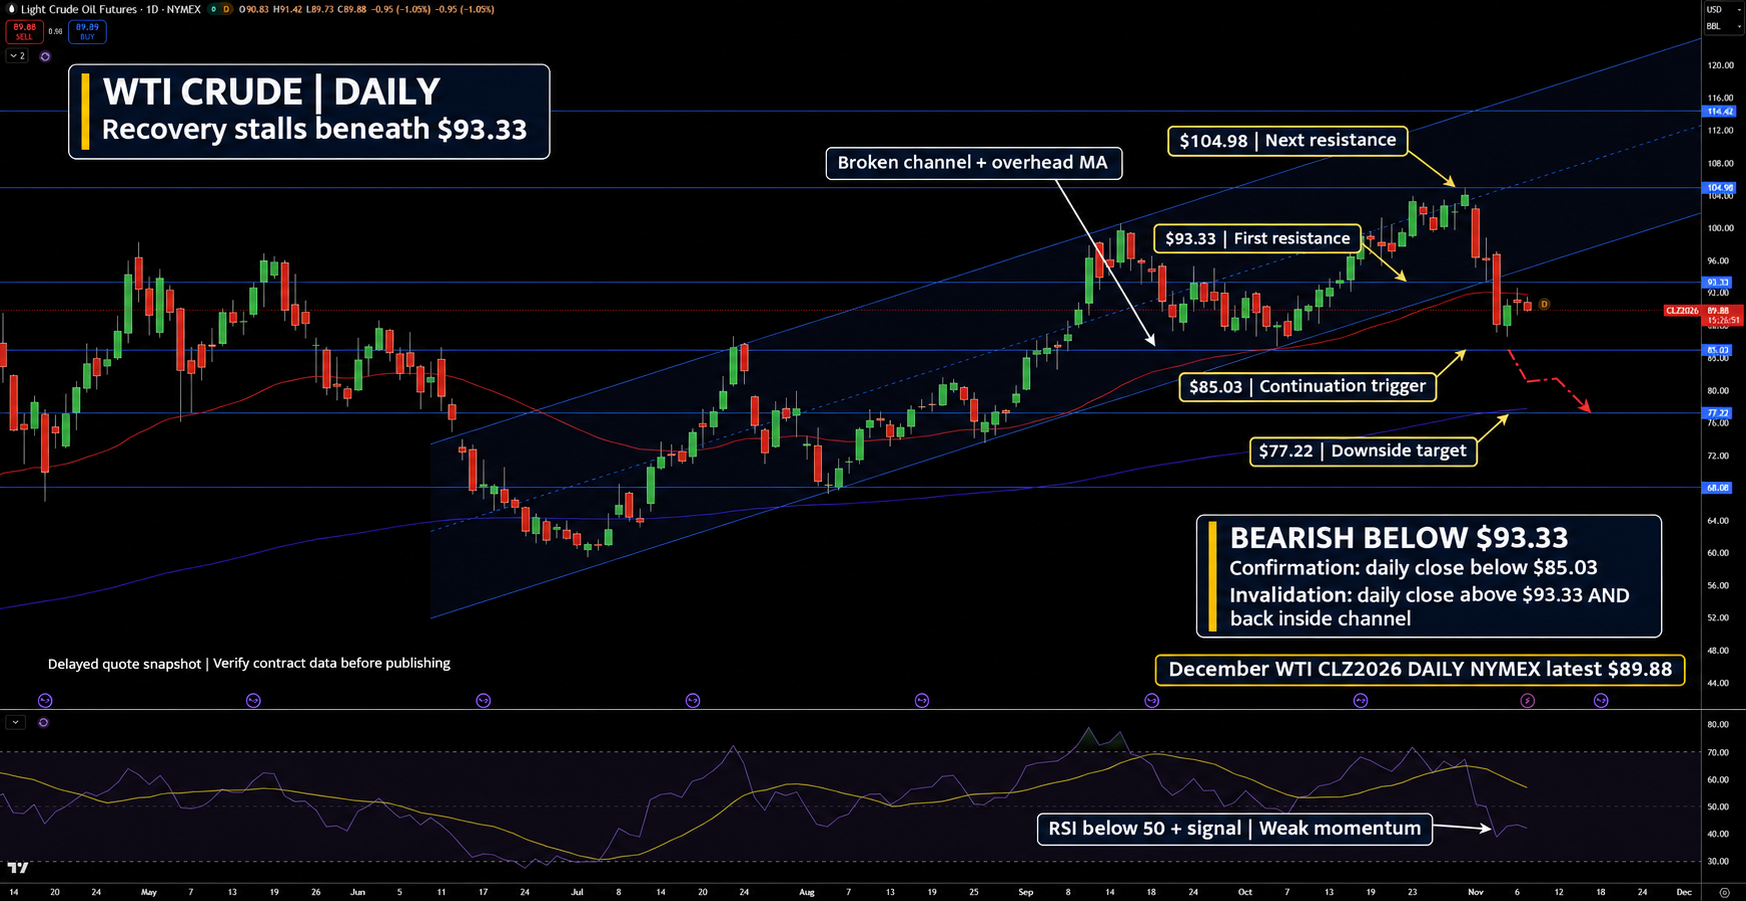
December WTI futures trade near $89.88 per barrel on the daily NYMEX chart. The rebound has stalled below the red moving average and broken rising channel, the parallel lines that previously guided prices higher. That leaves the recent breakdown intact despite the bounce.
Resistance stands at $93.33, followed by $104.98. Support is marked at $85.03; a daily close below it would expose $77.22 near the blue moving average. RSI remains below 50 and its signal line, showing weak momentum. My bias stays bearish, favoring failed rebounds below $93.33. A daily close below $85.03 would confirm further weakness. A daily close above $93.33 and back inside the channel would invalidate the immediate bearish view.
Brent Crude Oil Technical Analysis: Rebound Fades Below $104.16
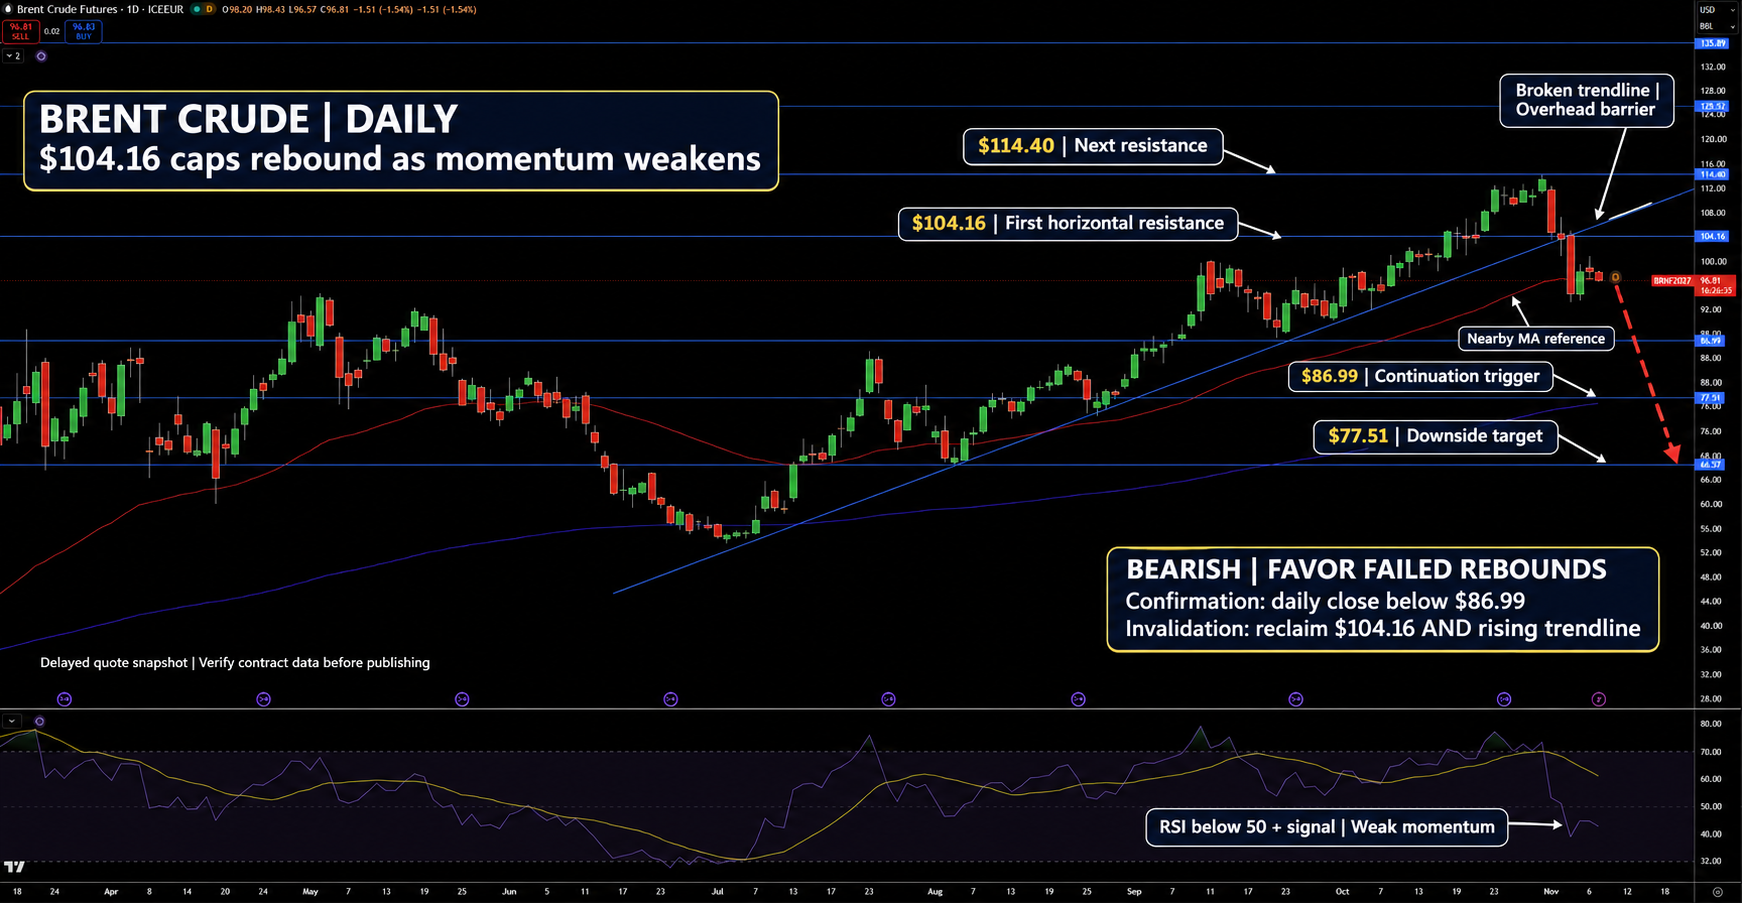
January 2027 Brent futures trade near $96.81 per barrel on the daily ICEEUR chart. The rebound has faded near the red moving average, with price still below the broken rising trendline, a line connecting earlier higher lows. The moving average is the nearer recovery test; its exact value is not labelled.
The first marked horizontal resistance is $104.16, followed by $114.40. Support stands at $86.99, then $77.51. RSI is below 50 and its signal line, supporting the bearish structure. I favor failed rebounds while the broken trendline remains overhead. A daily close below $86.99 would confirm further weakness; reclaiming $104.16 and the rising trendline would invalidate the immediate bearish view.