



Although there are still expectations for increased refinery output over the summer, China’s push for electric vehicles and low travel demand have made this situation worse. Additionally, ongoing high interest rates could further suppress demand, although any future rate cuts or extended production cuts by OPEC+ might stabilize prices.
Natural Gas Price Forecast
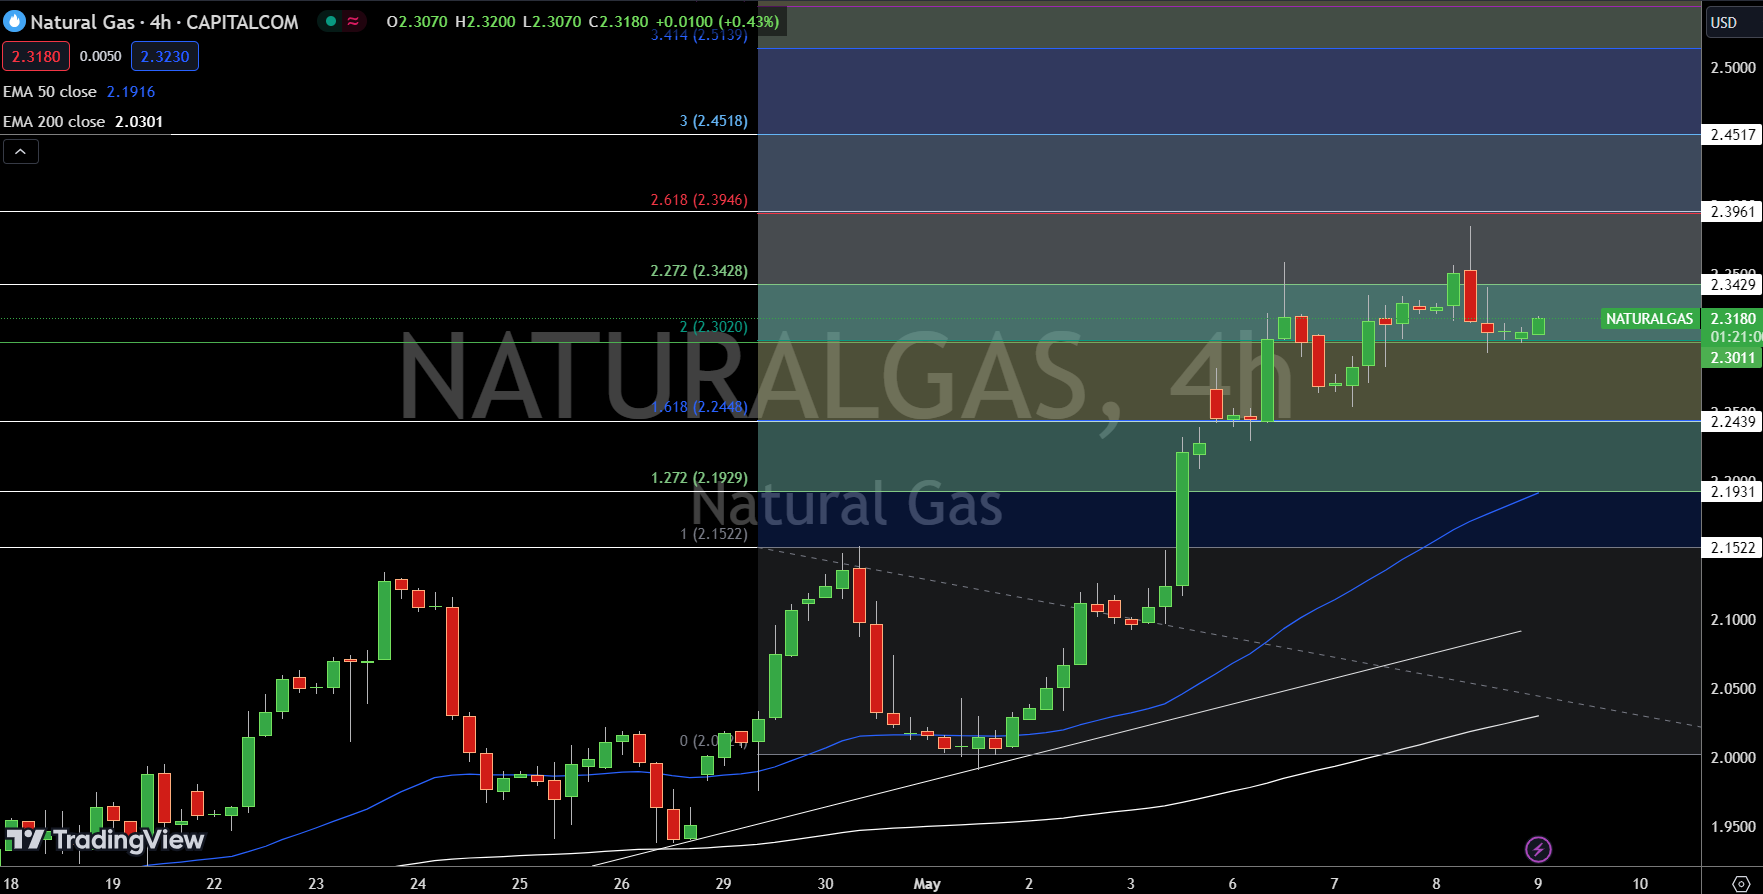
Natural Gas (NG) is trading at $2.318 today, marking a 0.30% increase. The technical framework highlights a pivot point at $2.30, with resistance levels identified at $2.34, $2.40, and $2.45. These thresholds could cap upward movements if approached. Conversely, support levels are established at $2.24, $2.19, and $2.15, which could provide a cushion if prices decline.
The 50-day Exponential Moving Average (EMA) at $2.19 and the 200-day EMA at $2.03 align with the lower end of NG’s recent trading range, suggesting a foundational support zone. Market outlook is bullish above $2.30; a break below may trigger a sharp selling trend due to ongoing volatility in the tight trading range between $2.30 and $2.40.
WTI Oil Price Forecast
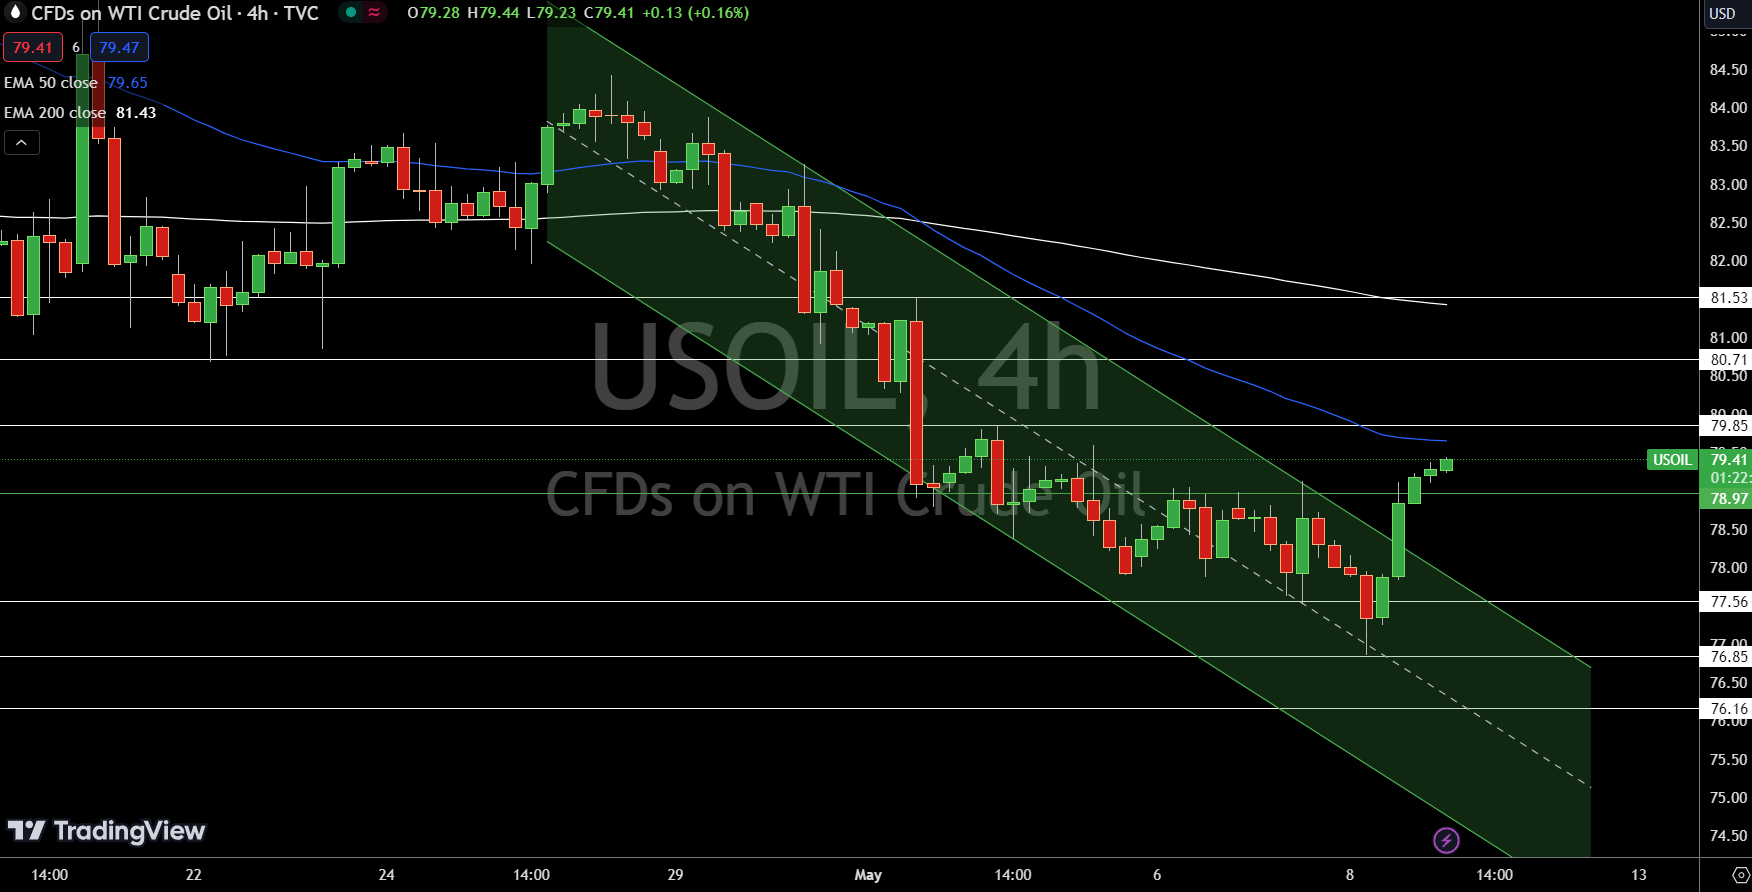
Today, USOIL trades at $79.41, marking a slight increase of 0.27%. The commodity’s key technical levels reveal a current pivot point at $78.97. Resistance levels are poised at $79.85, $80.71, and $81.53, suggesting potential targets for bullish momentum. Conversely, support levels are established at $77.56, $76.85, and $76.16, indicating where buyers might re-emerge if declines occur.
Technical analysis shows the 50-day Exponential Moving Average (EMA) at $79.65, closely aligning with current prices, while the 200-day EMA stands at $81.43, underscoring a strong resistance area. The technical stance remains bullish above $78.97, but a break below this threshold could trigger a significant sell-off.
Brent Oil Price Forecast
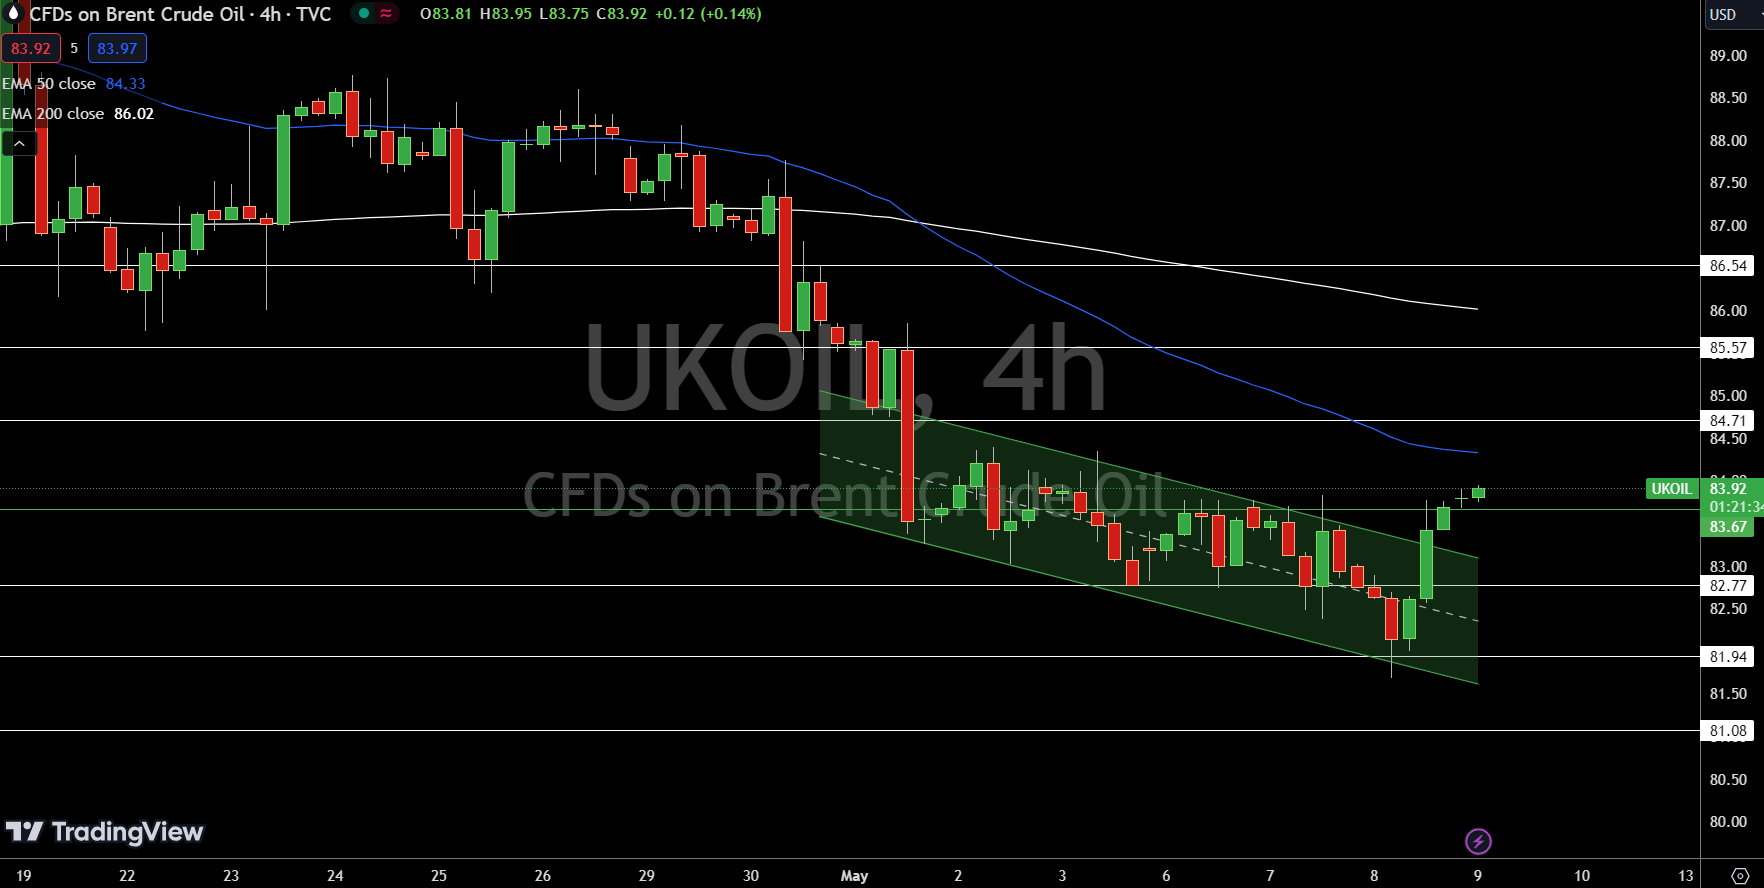
Technical indicators such as the 50-day Exponential Moving Average (EMA) at $84.33 and the 200-day EMA at $86.02 suggest a bullish stance if prices remain above the pivot. However, dipping below $83.67 could prompt a significant downward trend.
For a look at all of today’s economic events, check out our economic calendar.


