



Oil and Natural Gas: Tanker Attacks Complicate Supply Outlook as US Storage Builds
WTI trades near $91.44 per barrel, Brent near $99.66 per barrel and natural gas near $2.961/MMBtu. WTI and Brent remain sensitive to whether diplomatic efforts can restore dependable oil shipments from the Middle East. Tanker attacks are keeping that question open. US natural gas has more supply available in storage than usual for this time of year, giving the market some room to absorb lower production as heating demand builds.
WTI Inventory Draw Raises Focus on Winter Fuels
According to Reuters’ inventory report, commercial US crude stocks fell 865,000 barrels to 409.8 million barrels in the week ended October 30. Distillate stocks, which include diesel and heating oil, fell 3.6 million barrels. Refinery utilisation rose to 94.5%, showing that refiners were processing more crude. That supports crude demand, but the decline in distillates also puts more attention on winter fuel availability.
Brent Supply Risks Persist Around Hormuz
As Reuters reported on November 6, Iran said three more tankers had been attacked on Thursday. ANZ strategist Daniel Hynes estimated flows through the Strait of Hormuz remained below 60% of capacity. I would look for dependable cargo movements before treating diplomatic progress as a sustained improvement in supply. Renewed attacks keep that recovery uncertain.
Gas Storage Cushions Lower Production
The EIA storage report released November 5 showed a 77-billion-cubic-foot injection for the week ended October 30, taking inventories to 3,801 Bcf, or approximately 1.4% above the five-year average. Bcf means billion cubic feet. Those reserves provide a cushion as temperatures fall and households use more gas for heating.
In Reuters’ gas report covering November 4 trading, early-November production was running below October’s level. Forecasts also pointed to seasonally cooler weather in mid-November, although temperatures were still expected to remain warmer than normal through November 19. Gas flowing to liquefied natural gas export plants had eased from October. The next move depends on how quickly heating demand rises and whether production recovers.
Natural Gas Price Forecast
Every new Natural Gas analysis as it publishes, today's technical signal and key levels, live price — on one page.
See all Natural Gas forecastsNatural Gas Technical Analysis: $3.001 Rejection Tests Recovery Above $2.927
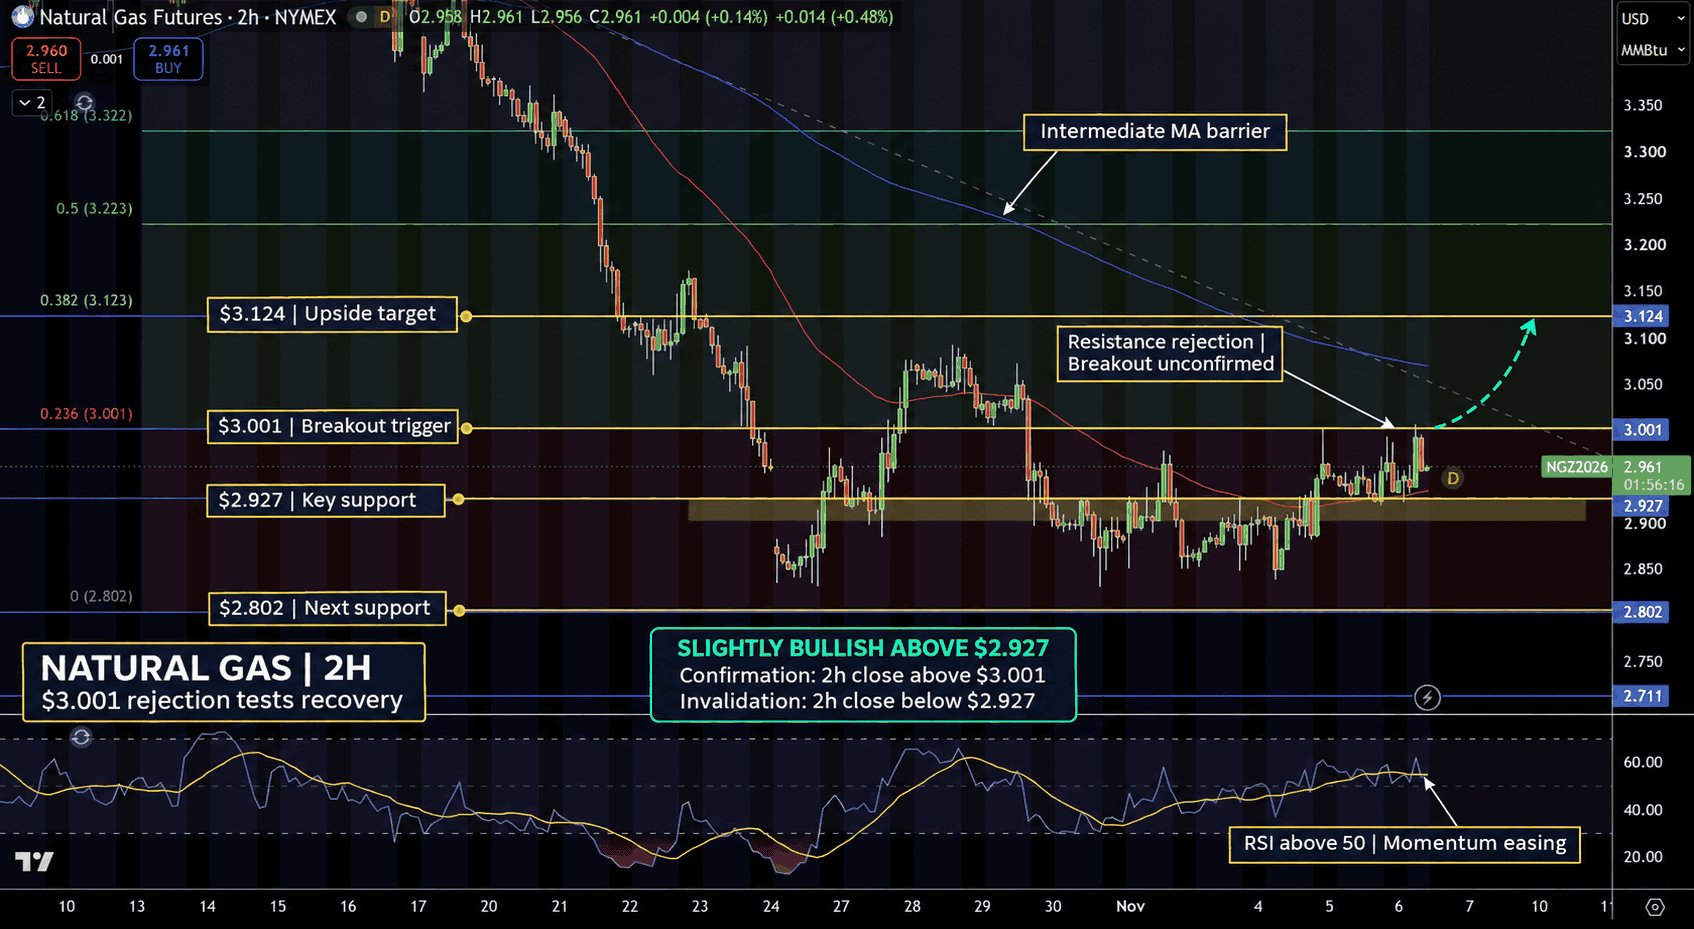
December natural gas futures trade near $2.961/MMBtu, or dollars per million British thermal units, on the two-hour chart. Price is holding above the red moving average and $2.927, but the rejection near $3.001 shows buyers still need to clear that resistance.
A two-hour close above $3.001 would strengthen the recovery towards $3.124. The falling blue moving average sits in between and could slow that move. Initial support is $2.927, followed by $2.802.
The Relative Strength Index, or RSI, remains above 50 but has eased from its recent peak, suggesting buying momentum has softened. I have a slight bullish lean above $2.927 and favour a successful support retest. A two-hour close below that level would invalidate the immediate recovery setup.
WTI Crude Oil Technical Analysis: $91.44 Rebound Faces $93.33 Resistance
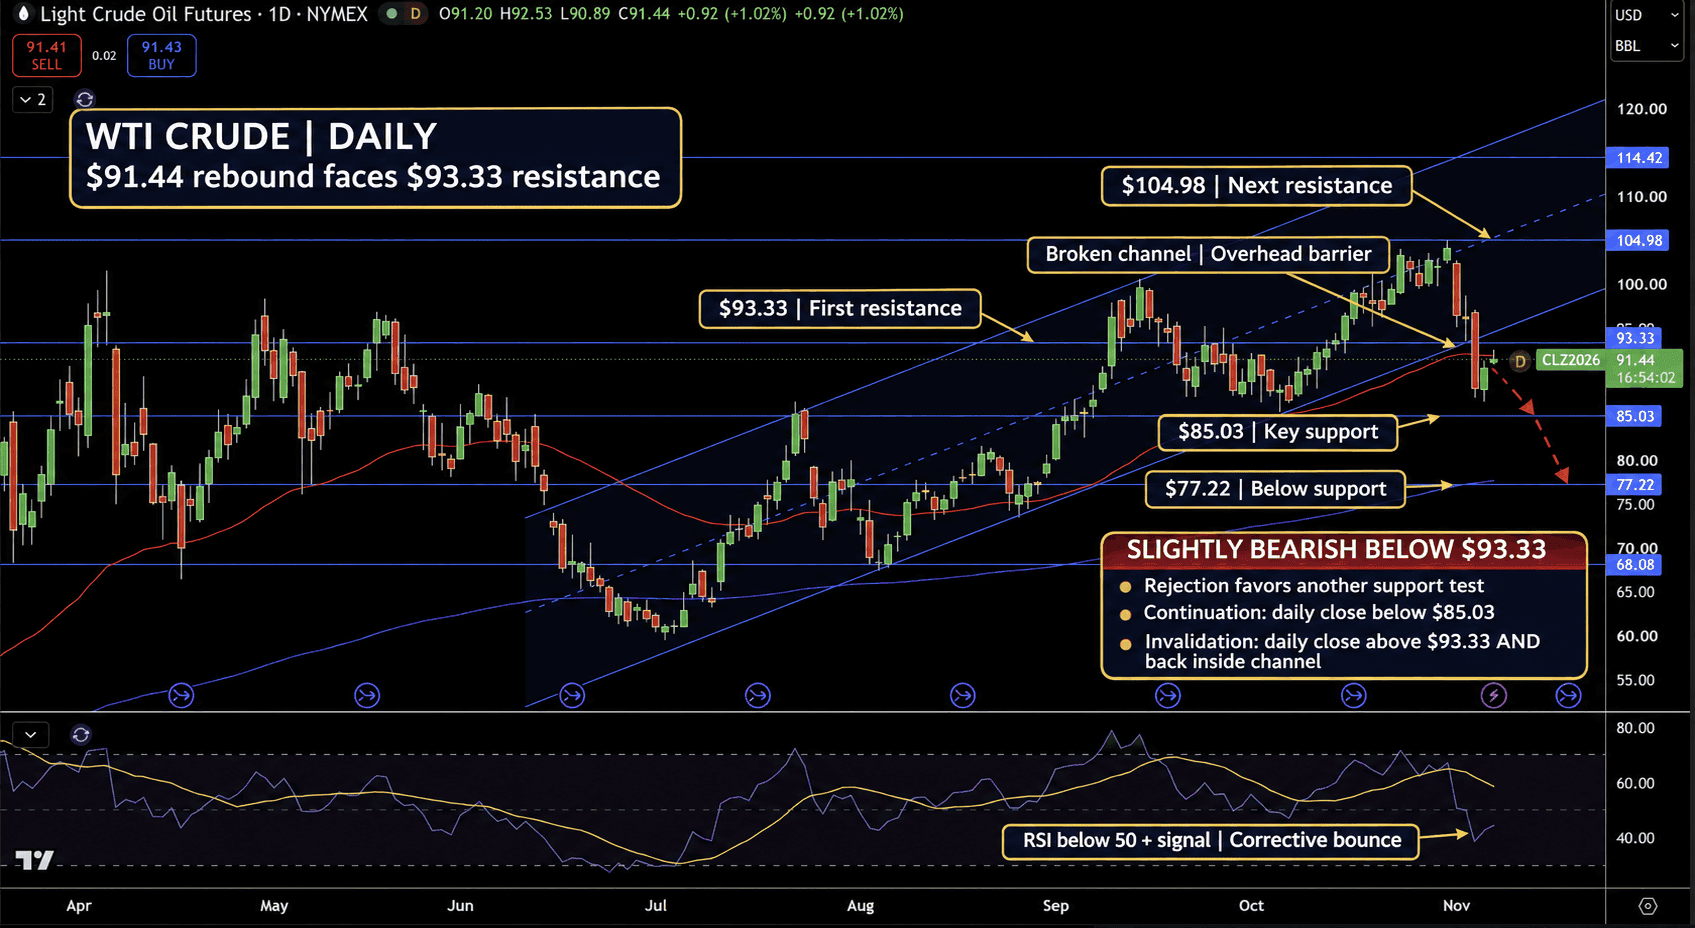
December WTI futures trade near $91.44 per barrel on the daily chart. Price has rebounded towards the red moving average but remains below the rising channel it broke earlier. Buyers need to reclaim that structure before the recovery looks convincing.
The first marked resistance is $93.33, followed by $104.98. Support sits at $85.03. A daily close below $85.03 would open the way towards $77.22.
RSI has recovered but remains below 50 and its signal line, leaving momentum weak. I lean slightly bearish while price stays below resistance. A rejection beneath $93.33 would favour another test of support. A daily close above $93.33 and back inside the channel would invalidate that view.
Brent Crude Oil Technical Analysis: Recovery Toward $104.16 Lacks Confirmation
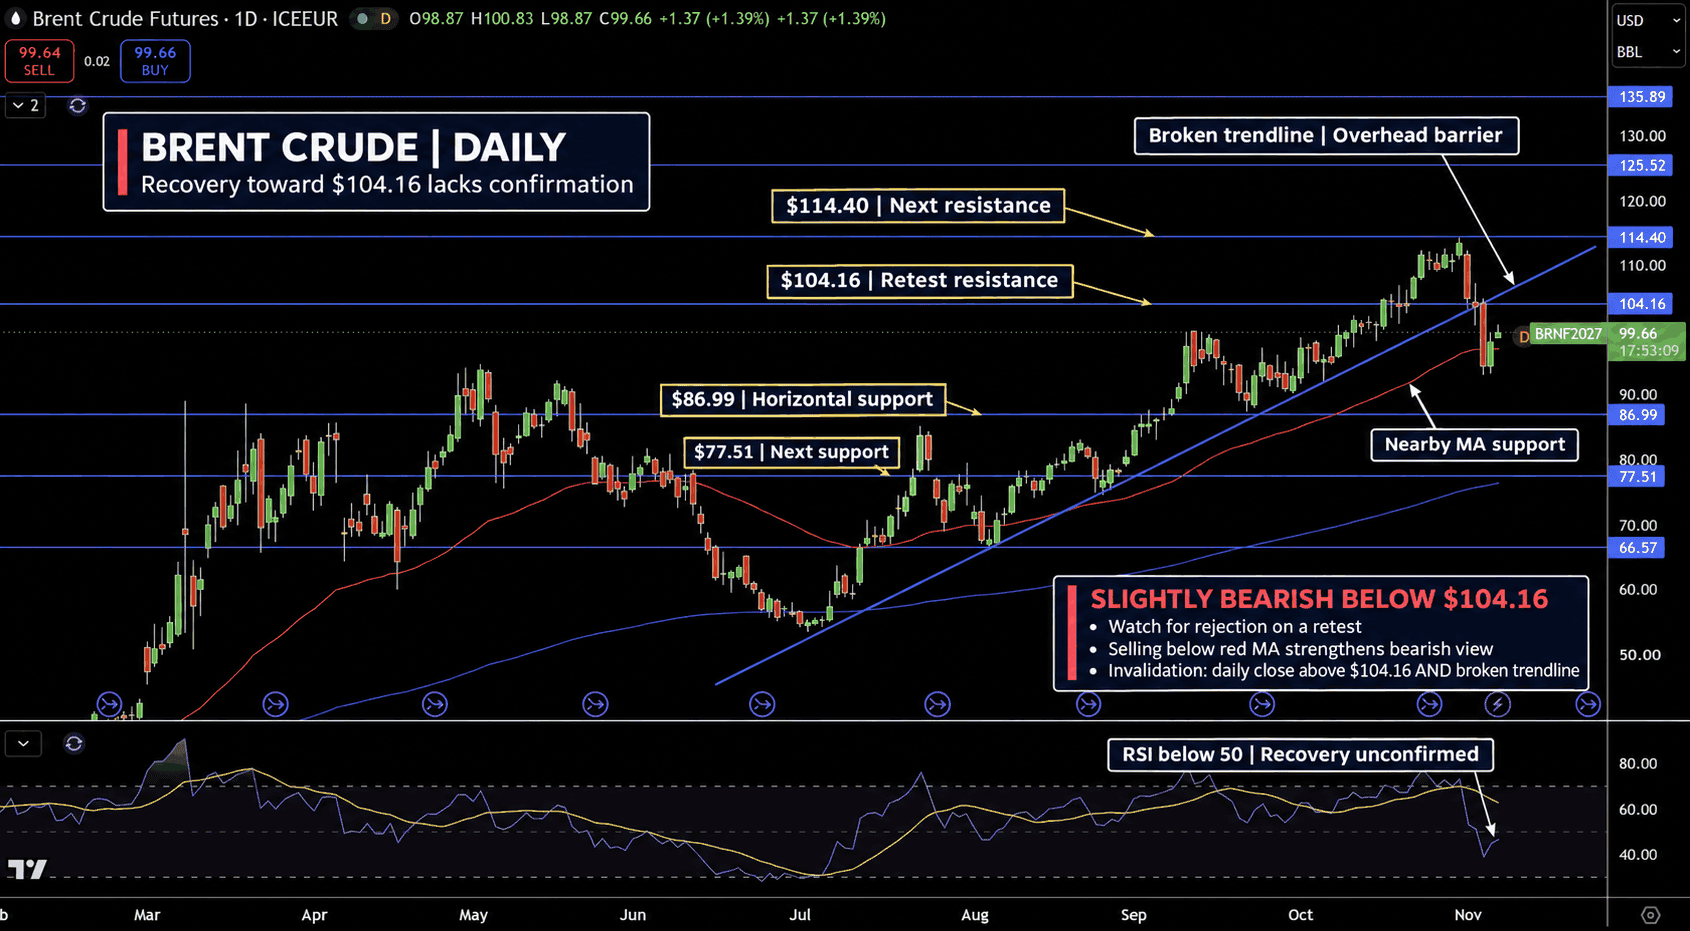
January Brent futures trade near $99.66 per barrel on the daily ICEEUR chart. Price has moved back above the red moving average, but the rising trendline it broke earlier remains overhead. That leaves the recovery facing a further test.
Resistance sits at $104.16, followed by $114.40. The red moving average provides a nearer support reference, although its value is not labelled. The next marked horizontal supports are $86.99 and $77.51.
RSI has rebounded but remains below 50, so momentum has yet to confirm a stronger recovery. My bias is slightly bearish beneath $104.16, with rejection on a retest favouring renewed selling. A move below the red moving average would strengthen that view. A daily close above $104.16 and the broken trendline would invalidate it.