



Oil Slips as IEA Flags First Surplus Since the Iran War Began
Crude fell on Monday on expectations of a supply surplus, with Middle East shipments through the Strait of Hormuz nearly restored to pre-war levels and signs of softer Chinese demand, Reuters reported. Brent was down 0.6% at $95.30 and WTI down 0.3% at $88.34 by 04:27 GMT.
Brent: The Balance Flips
The International Energy Agency said on Friday that global oil supply has surpassed demand for the first time since the war in Iran began. In its monthly Oil Market Report, it now expects fourth-quarter supply to average 105mn barrels per day (bpd), 1.7mn bpd above forecast demand, after previously forecasting a fourth-quarter deficit. Gulf producers are recovering exports partly through “dark crossings” of Hormuz, in which tankers switch off their tracking signals to evade attack.
The IEA sees world demand falling 2.7mn bpd this year, as high prices curb consumption, and a surplus of about 3.8mn bpd in 2027. It also said 71mn barrels from the record emergency release pledged in March, including 15mn barrels of diesel, would be made available by the end of February, Reuters reported. Separately, OPEC+ pumped 41.23mn bpd of crude in October, 97% of its pre-war volume, according to OPEC data cited by Reuters.
WTI: Demand Cracks and a Shipping Floor
China’s October refinery throughput fell 2% from September, and Reuters calculations based on government data imply a Chinese crude stock build of 492,000 bpd that month, which Reuters said indicates lower crude demand. In the US, President Trump extended the Jones Act waiver for another 90 days, a White House official said on Friday, which lets foreign-flagged ships carry oil and fuel between US ports.
Prices still have some support. “For the first time since the US-Iran conflict began, traders are actively contemplating the possibility of excess supply rather than persistent tightness,” said Tim Waterer, chief analyst at KCM Trade, though he noted that high shipping rates are putting a floor under prices because of tanker risks in the strait and vessels tied up in ship-to-ship transfers. Iran’s navy also said a tanker caught fire after hitting a mine east of Hormuz, which Reuters could not verify, yet WTI still eased.
Natural Gas Price Forecast
Every new Natural Gas analysis as it publishes, today's technical signal and key levels, live price — on one page.
See all Natural Gas forecastsNatural Gas: Surplus Widens
US natural gas storage rose by 61bn cubic feet (Bcf) in the week ended November 6, below the 66 Bcf analysts expected but well above the five-year average build of 40 Bcf, according to the EIA’s storage report. Inventories stood at 3,862 Bcf, 75 Bcf above the five-year average, and NGI said the above-average injection widened the storage surplus and failed to lift futures.
December natural gas futures fell about 3% to $3.24/MMBtu, or per million British thermal units, by midday on Friday, Reuters reported, though they were still on track for a third straight weekly gain. Ritterbusch and Associates pointed to higher production and softer export activity. In my view, the storage surplus is now the main obstacle for gas bulls until colder weather shows up in the forecasts.
WTI Crude Oil Technical Analysis: Oil Holds $85.22 Pivot but Stays Below $92.53
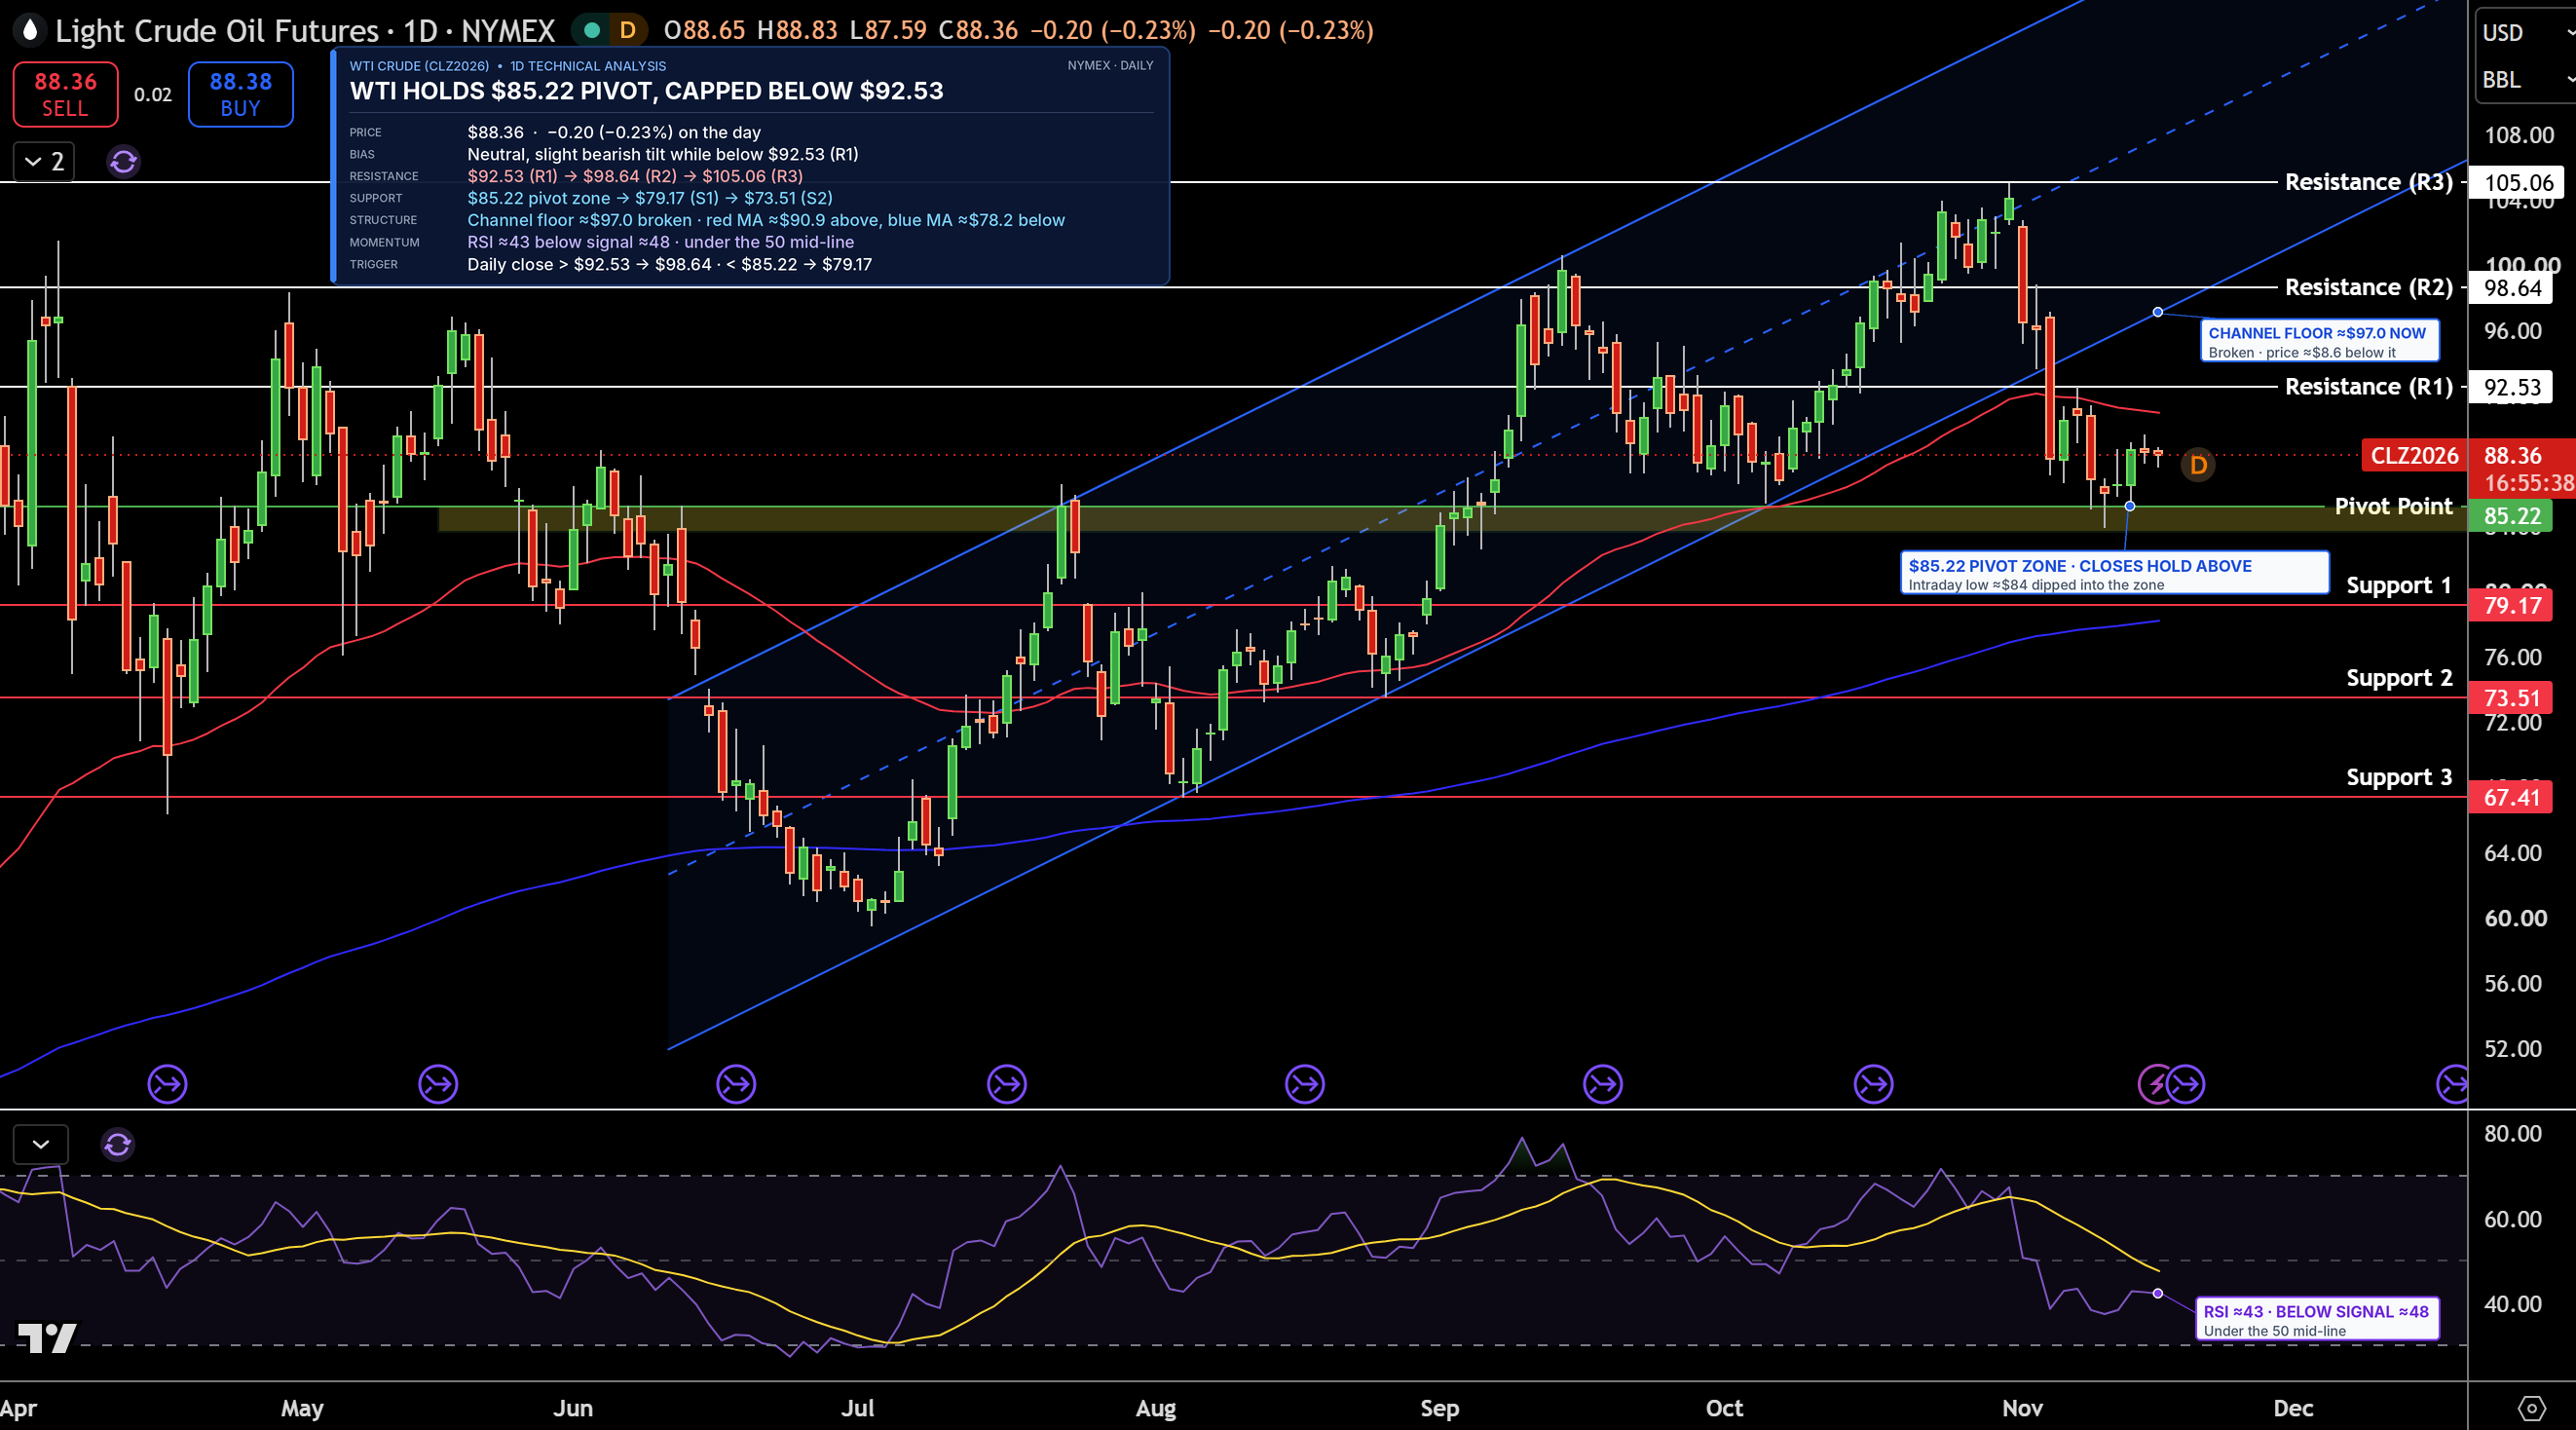
December WTI is trading near $88.36 on the daily chart, still holding above the $85.22 zone, the pivot point, a level calculated from the previous period’s high, low and close that traders use to judge direction. That zone has stopped two dips this month. WTI remains below its broken rising channel, though, and below the faster moving average, which tracks the recent average price.
Resistance, where sellers may return, is $92.53, then $98.64. Support, where buyers may step in, is $85.22, then $79.17. RSI, a 0 to 100 gauge of buying and selling strength, is near 43 and below its signal line, a slower average of RSI. I hold a slight bearish lean while WTI stays below $92.53. A close below $85.22 would open $79.17.
Brent Crude Oil Technical Analysis: Oil Rejected at $96.59 as Trendline Caps the Rebound
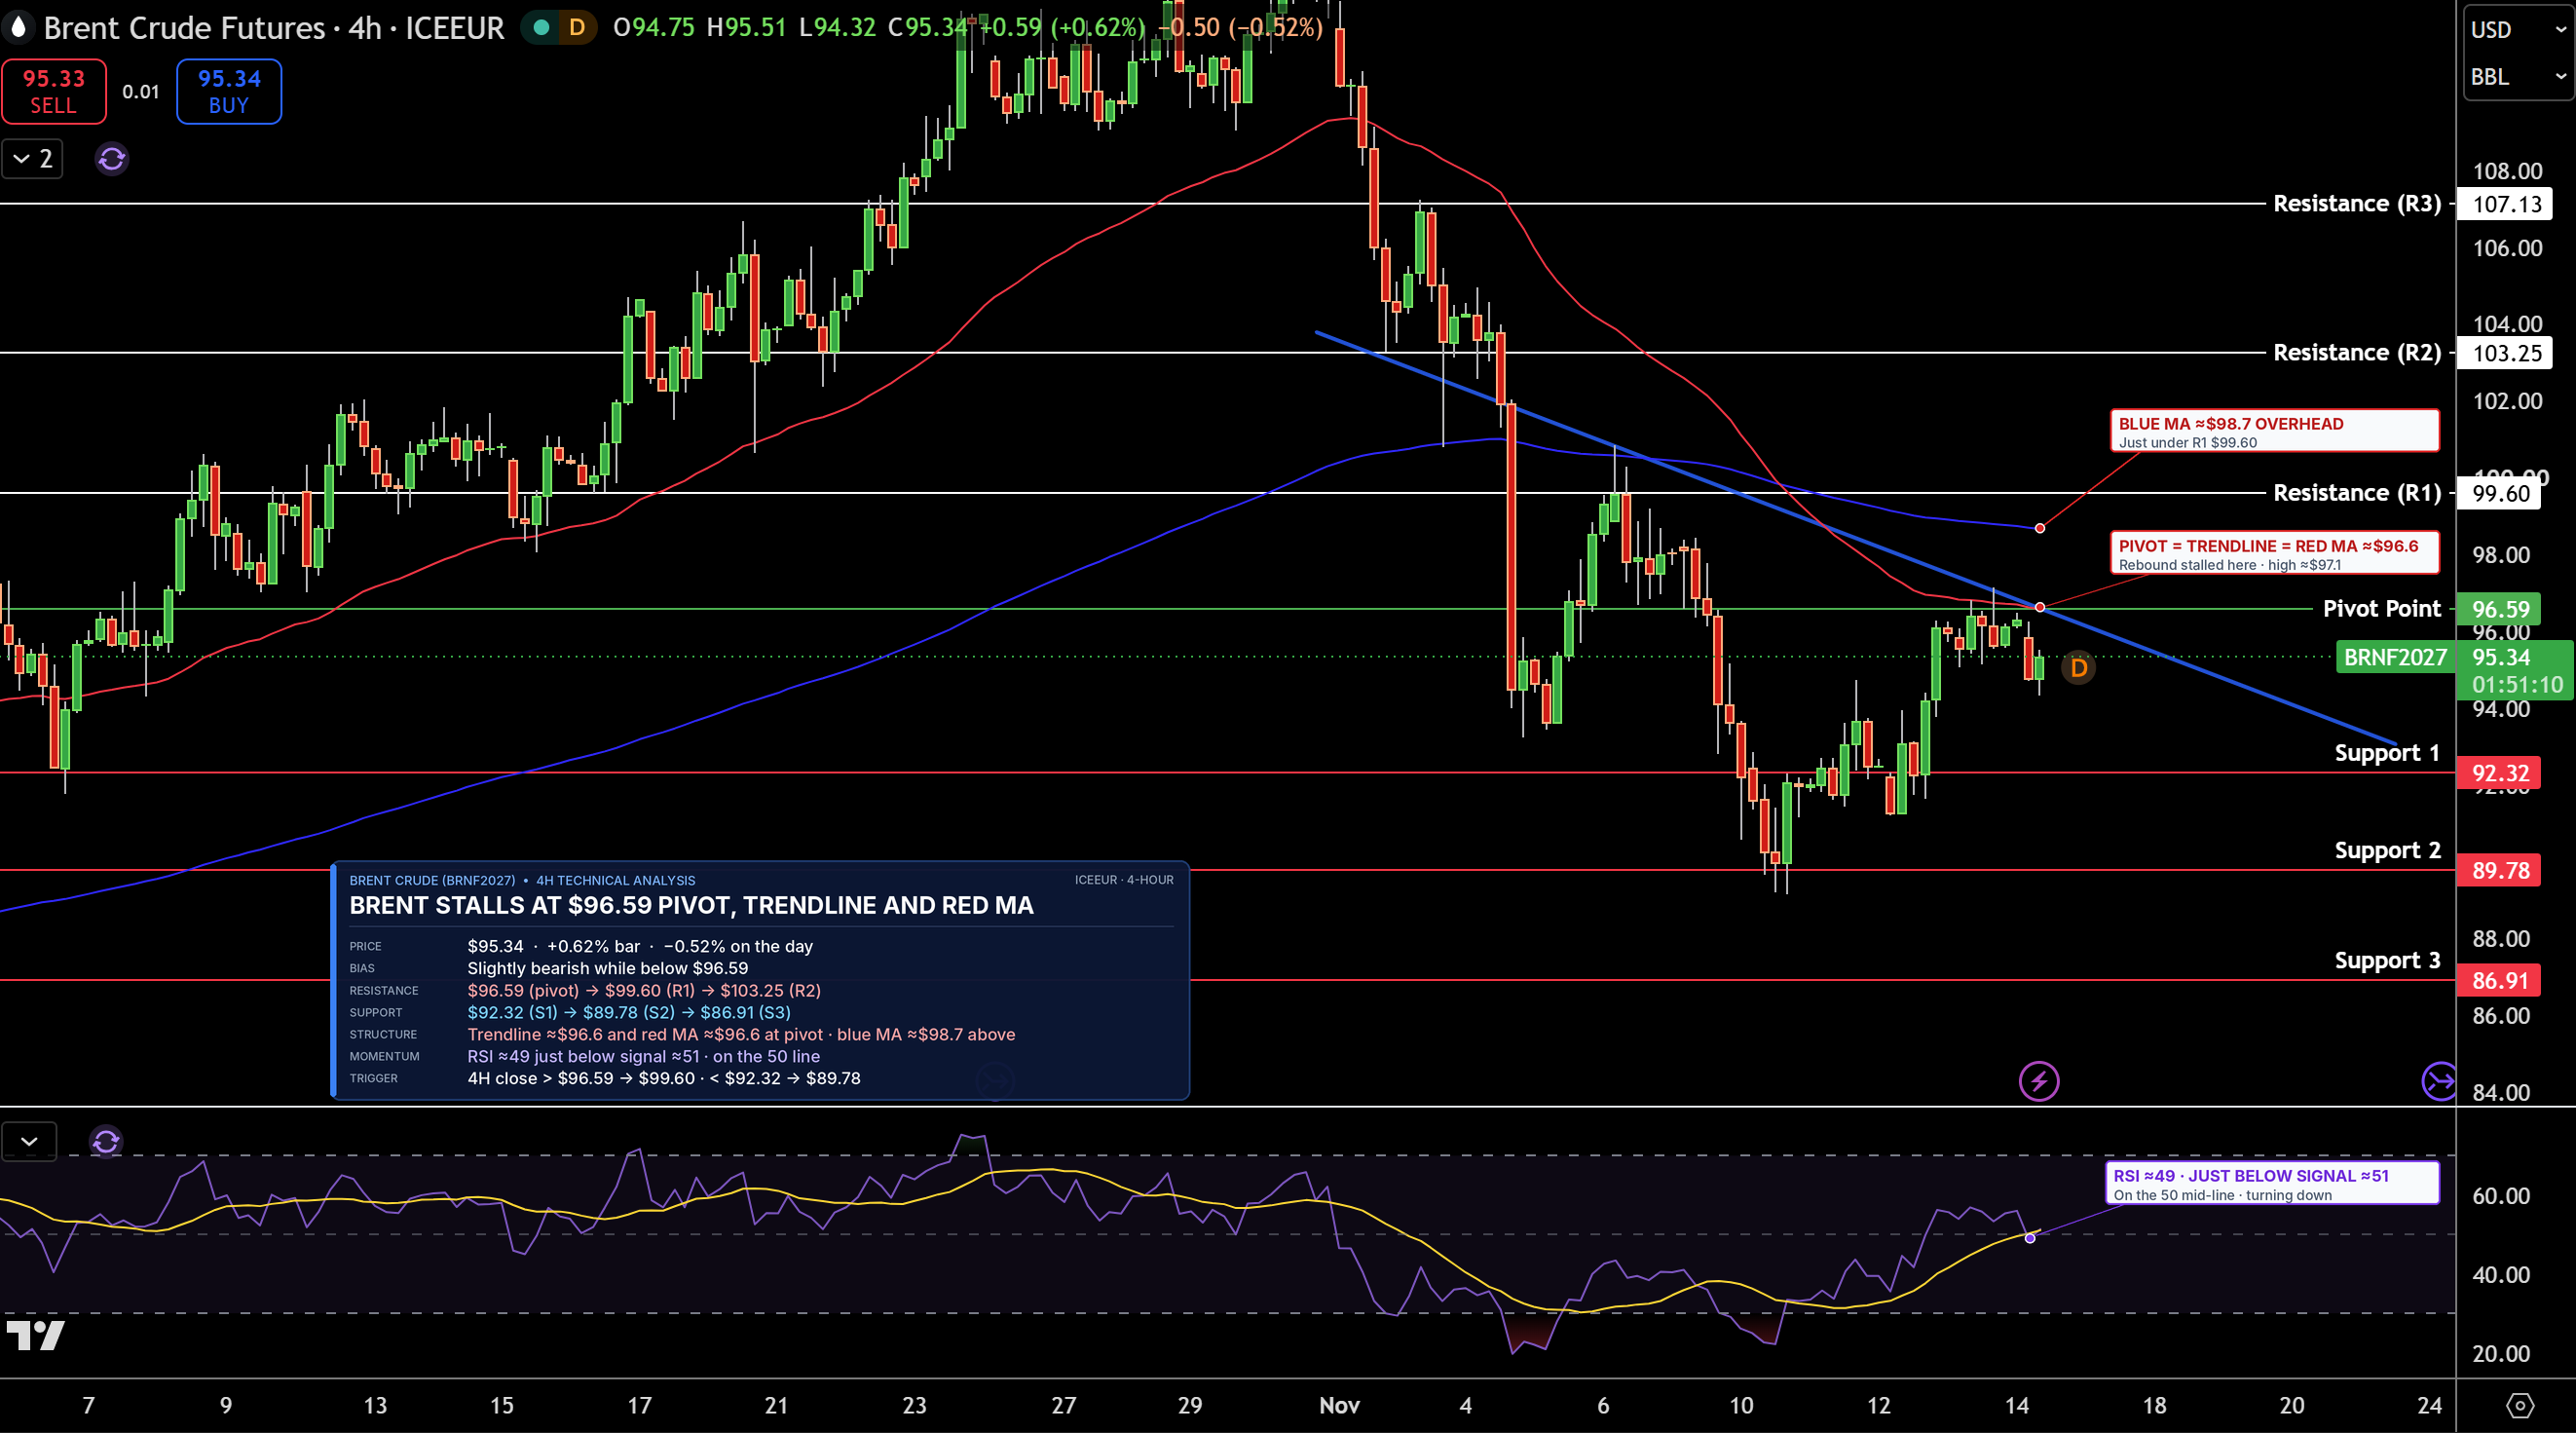
January Brent futures are trading near $95.34 on the 4-hour chart. The rebound from below $90 stalled at $96.59, the pivot point, which lines up with a falling trendline, a line connecting lower highs since early November, and the faster moving average.
Resistance is $96.59, then $99.60. Support is $92.32, then $89.78. RSI is near 50 and just slipped below its signal line. The bias is a slight bearish lean while Brent stays below $96.59. A close above it would open $99.60, while a drop below $92.32 would point to $89.78.
Natural Gas Technical Analysis: NG Slips Below $3.18 as Trendline Support Is Tested
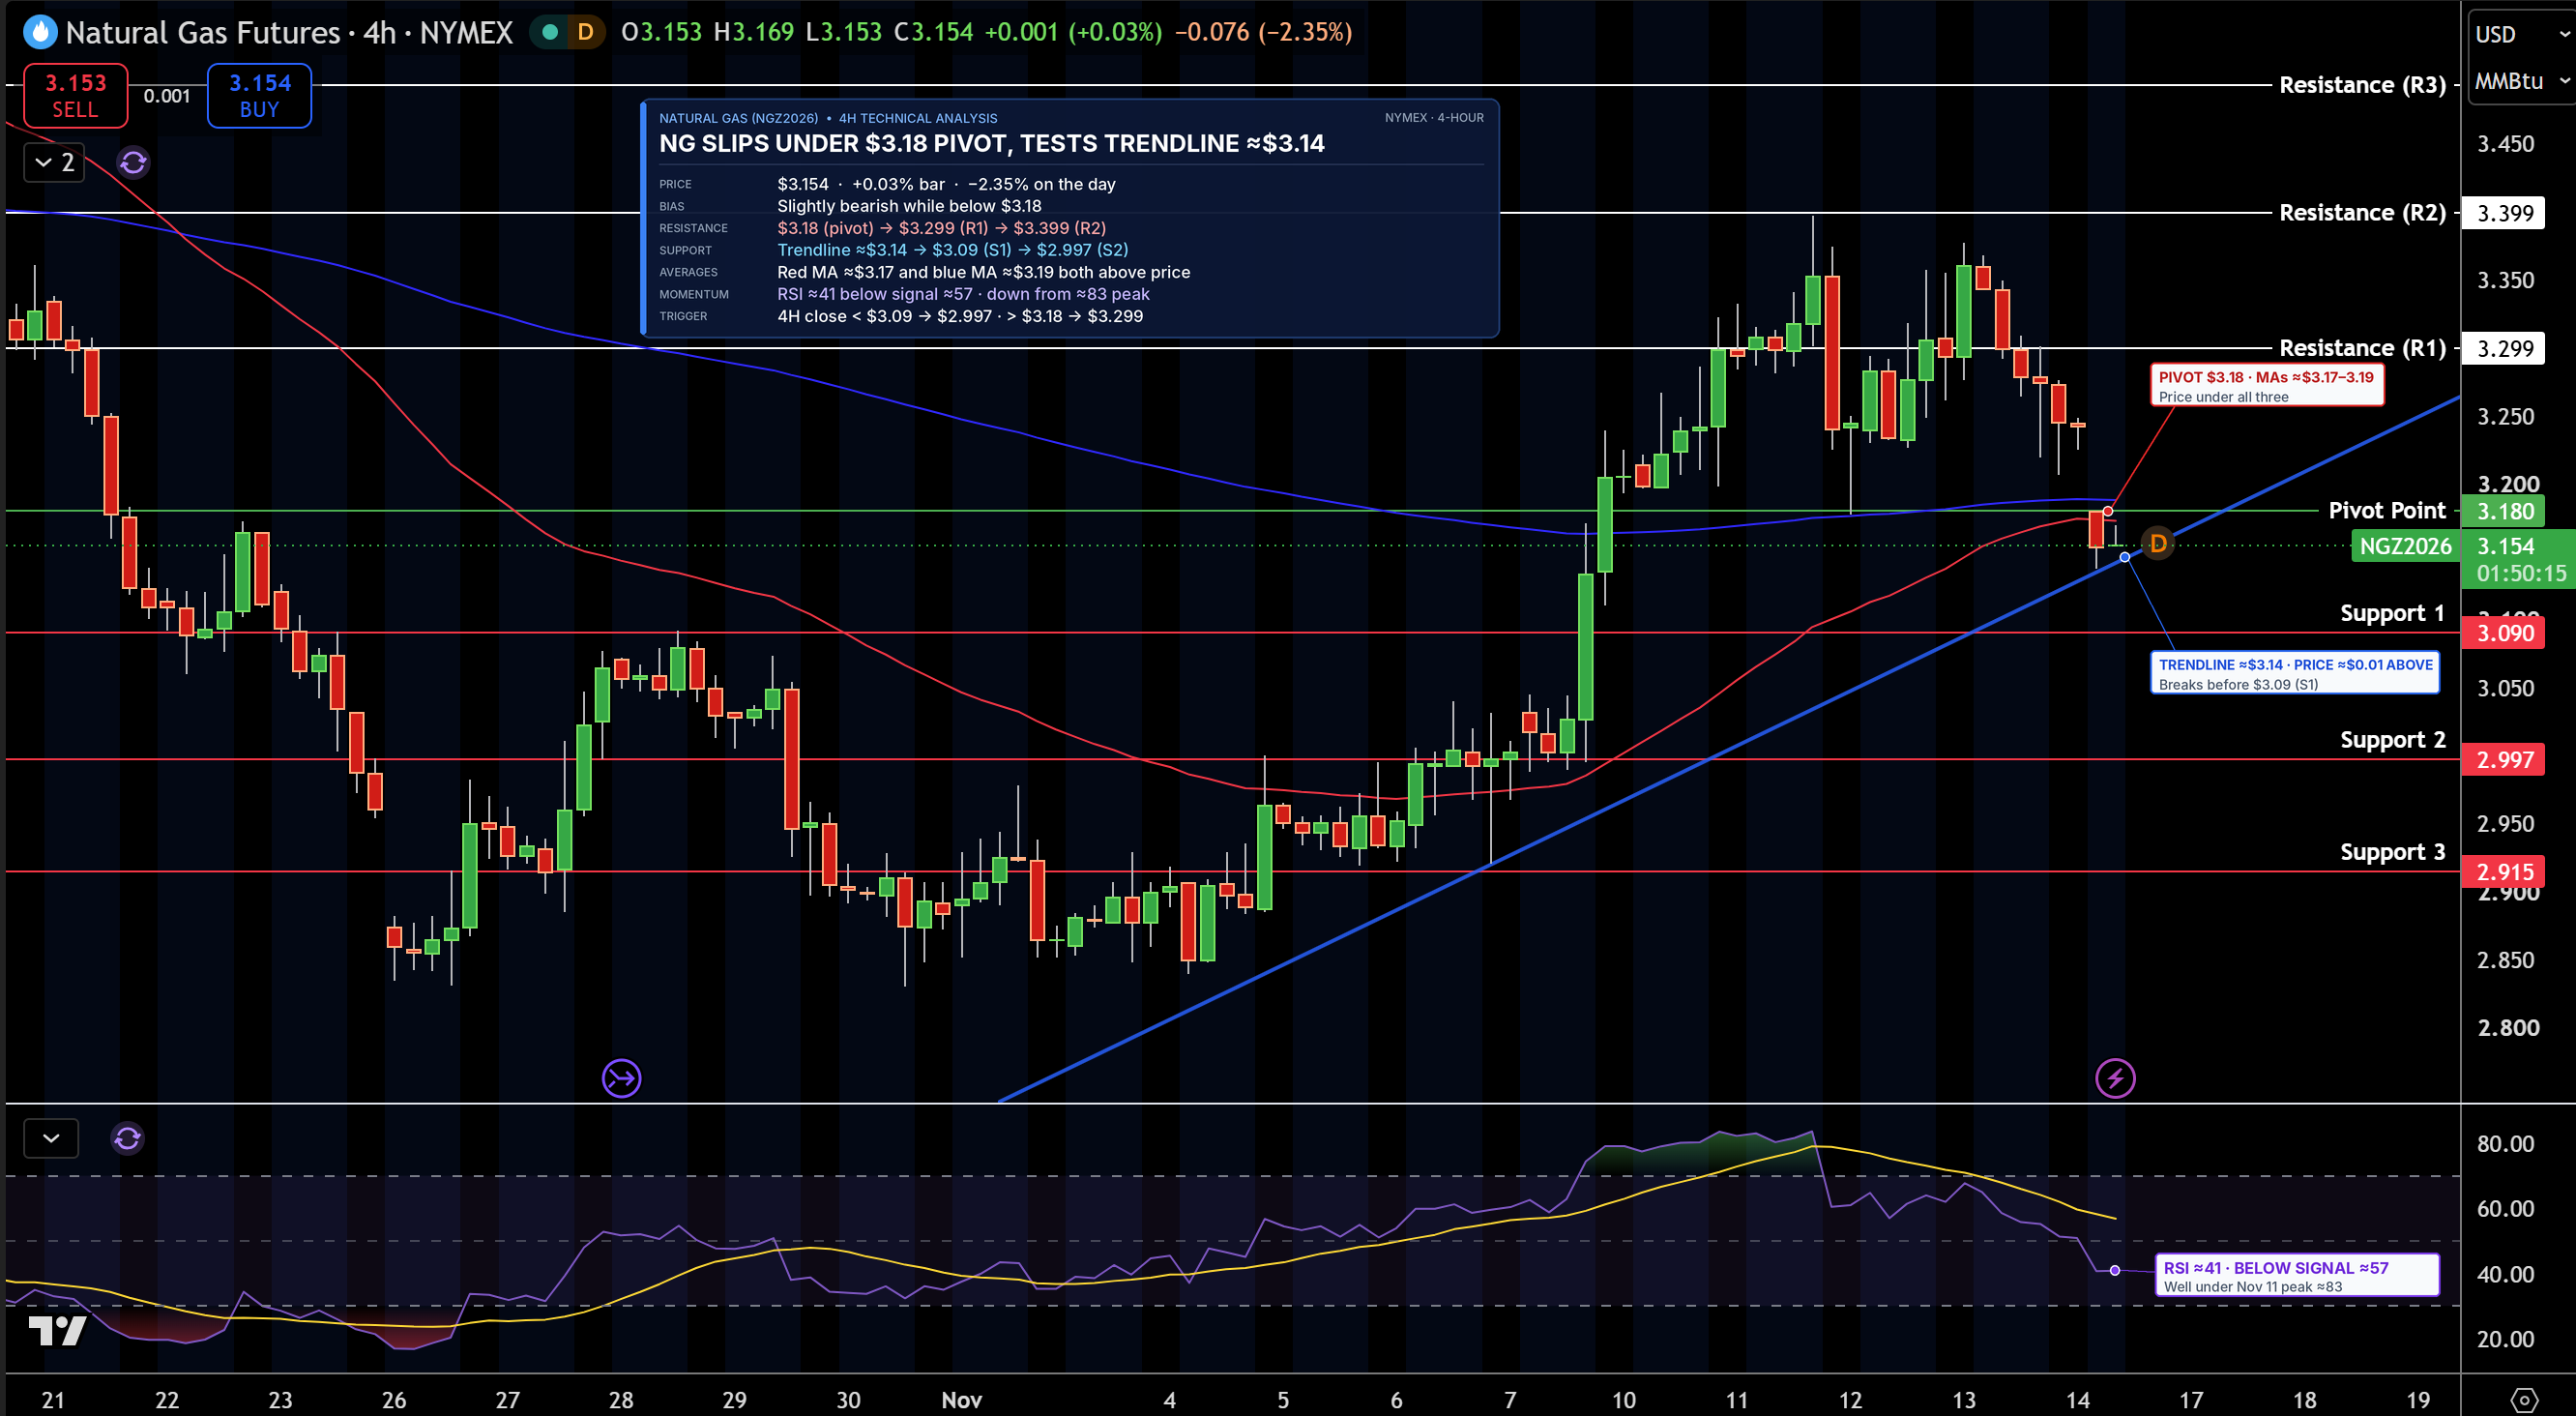
December natural gas is trading near $3.15/MMBtu on the 4-hour chart. Prices were turned back twice below $3.40 last week and have now slipped under the $3.18 pivot and both moving averages. Gas is testing a rising trendline from early November near $3.14.
Support is $3.09, then $3.00. Resistance is $3.18, then $3.30. RSI has dropped to about 41 and is below its signal line. Gas keeps a slight bearish lean while it stays below $3.18, and a close below $3.09 would open $3.00.