



Oil was steady on Thursday after falling the day before, as expectations of a supply surplus and higher US interest rates outweighed attacks on shipping in the Strait of Hormuz, Reuters reported. Brent traded near $92 at 0455 GMT, while the more active January WTI contract traded near $82.09. On Wednesday, WTI fell to its lowest since August 26.
WTI: Inventories Pile Up
US crude stocks rose by 3.4mn barrels to 417.8mn in the week ended November 13, the EIA’s Weekly Petroleum Status Report showed, far above the 58,000-barrel build analysts expected in a Reuters poll. Gasoline stocks jumped 5.2mn barrels, more than three times the 1.6mn-barrel forecast, while distillates, which include diesel and heating oil, rose 1.6mn barrels. Crude exports climbed by 1.03mn barrels per day to 4.49mn bpd. The December WTI contract expires on Friday.
Rate expectations are adding pressure. Minutes of the Fed’s October meeting, released on Wednesday, boosted expectations of a December hike, and higher rates could slow growth and oil demand while strengthening the dollar, which makes crude more expensive for non-US buyers, Reuters said. “The question is no longer simply whether the Fed will hike rates in December, but by how much,” PVM analysts wrote.
Brent: Diplomacy and Russian Refining
Traders are awaiting a summit of US, Chinese and Russian leaders for clues on a negotiated end to the US-Iran war and Russia’s invasion of Ukraine. Separately, Ukrainian drone attacks have cut Russian refineries’ combined crude processing by 45% since late October, Reuters reported, citing industry sources. In my view, less refining in Russia could leave more crude available for export, which adds to the supply side.
The risks have not disappeared. Iranian media reported on Wednesday that three oil tankers sailing east of the Strait of Hormuz were disabled by mines, and the Houthis fired missiles at Riyadh on Thursday. Even so, Brent barely moved. “Oil is caught between bearish fundamentals and bullish geopolitical risks,” said Priyanka Sachdeva, head of market insights at Phillip Nova.
Natural Gas Price Forecast
Every new Natural Gas analysis as it publishes, today's technical signal and key levels, live price — on one page.
See all Natural Gas forecastsNatural Gas: Output Dip Sparks Rebound
US natural gas futures rallied nearly 5% on Wednesday as a sharp pullback in Lower 48 production and a rebound in LNG feedgas demand offset mild weather, NGI reported. NGI expects the EIA’s storage report on Thursday to show a 24bn cubic feet (Bcf) injection for the week ended November 13, against a five-year average build of 15 Bcf.
In my view, a build above the five-year average would show supply still running ahead of demand, so Thursday’s EIA figure is the next test for gas. More coverage is on FXEmpire’s natural gas forecasts page.
Brent Crude Oil Technical Analysis: Oil Holds $90.61 Inside Narrowing Triangle
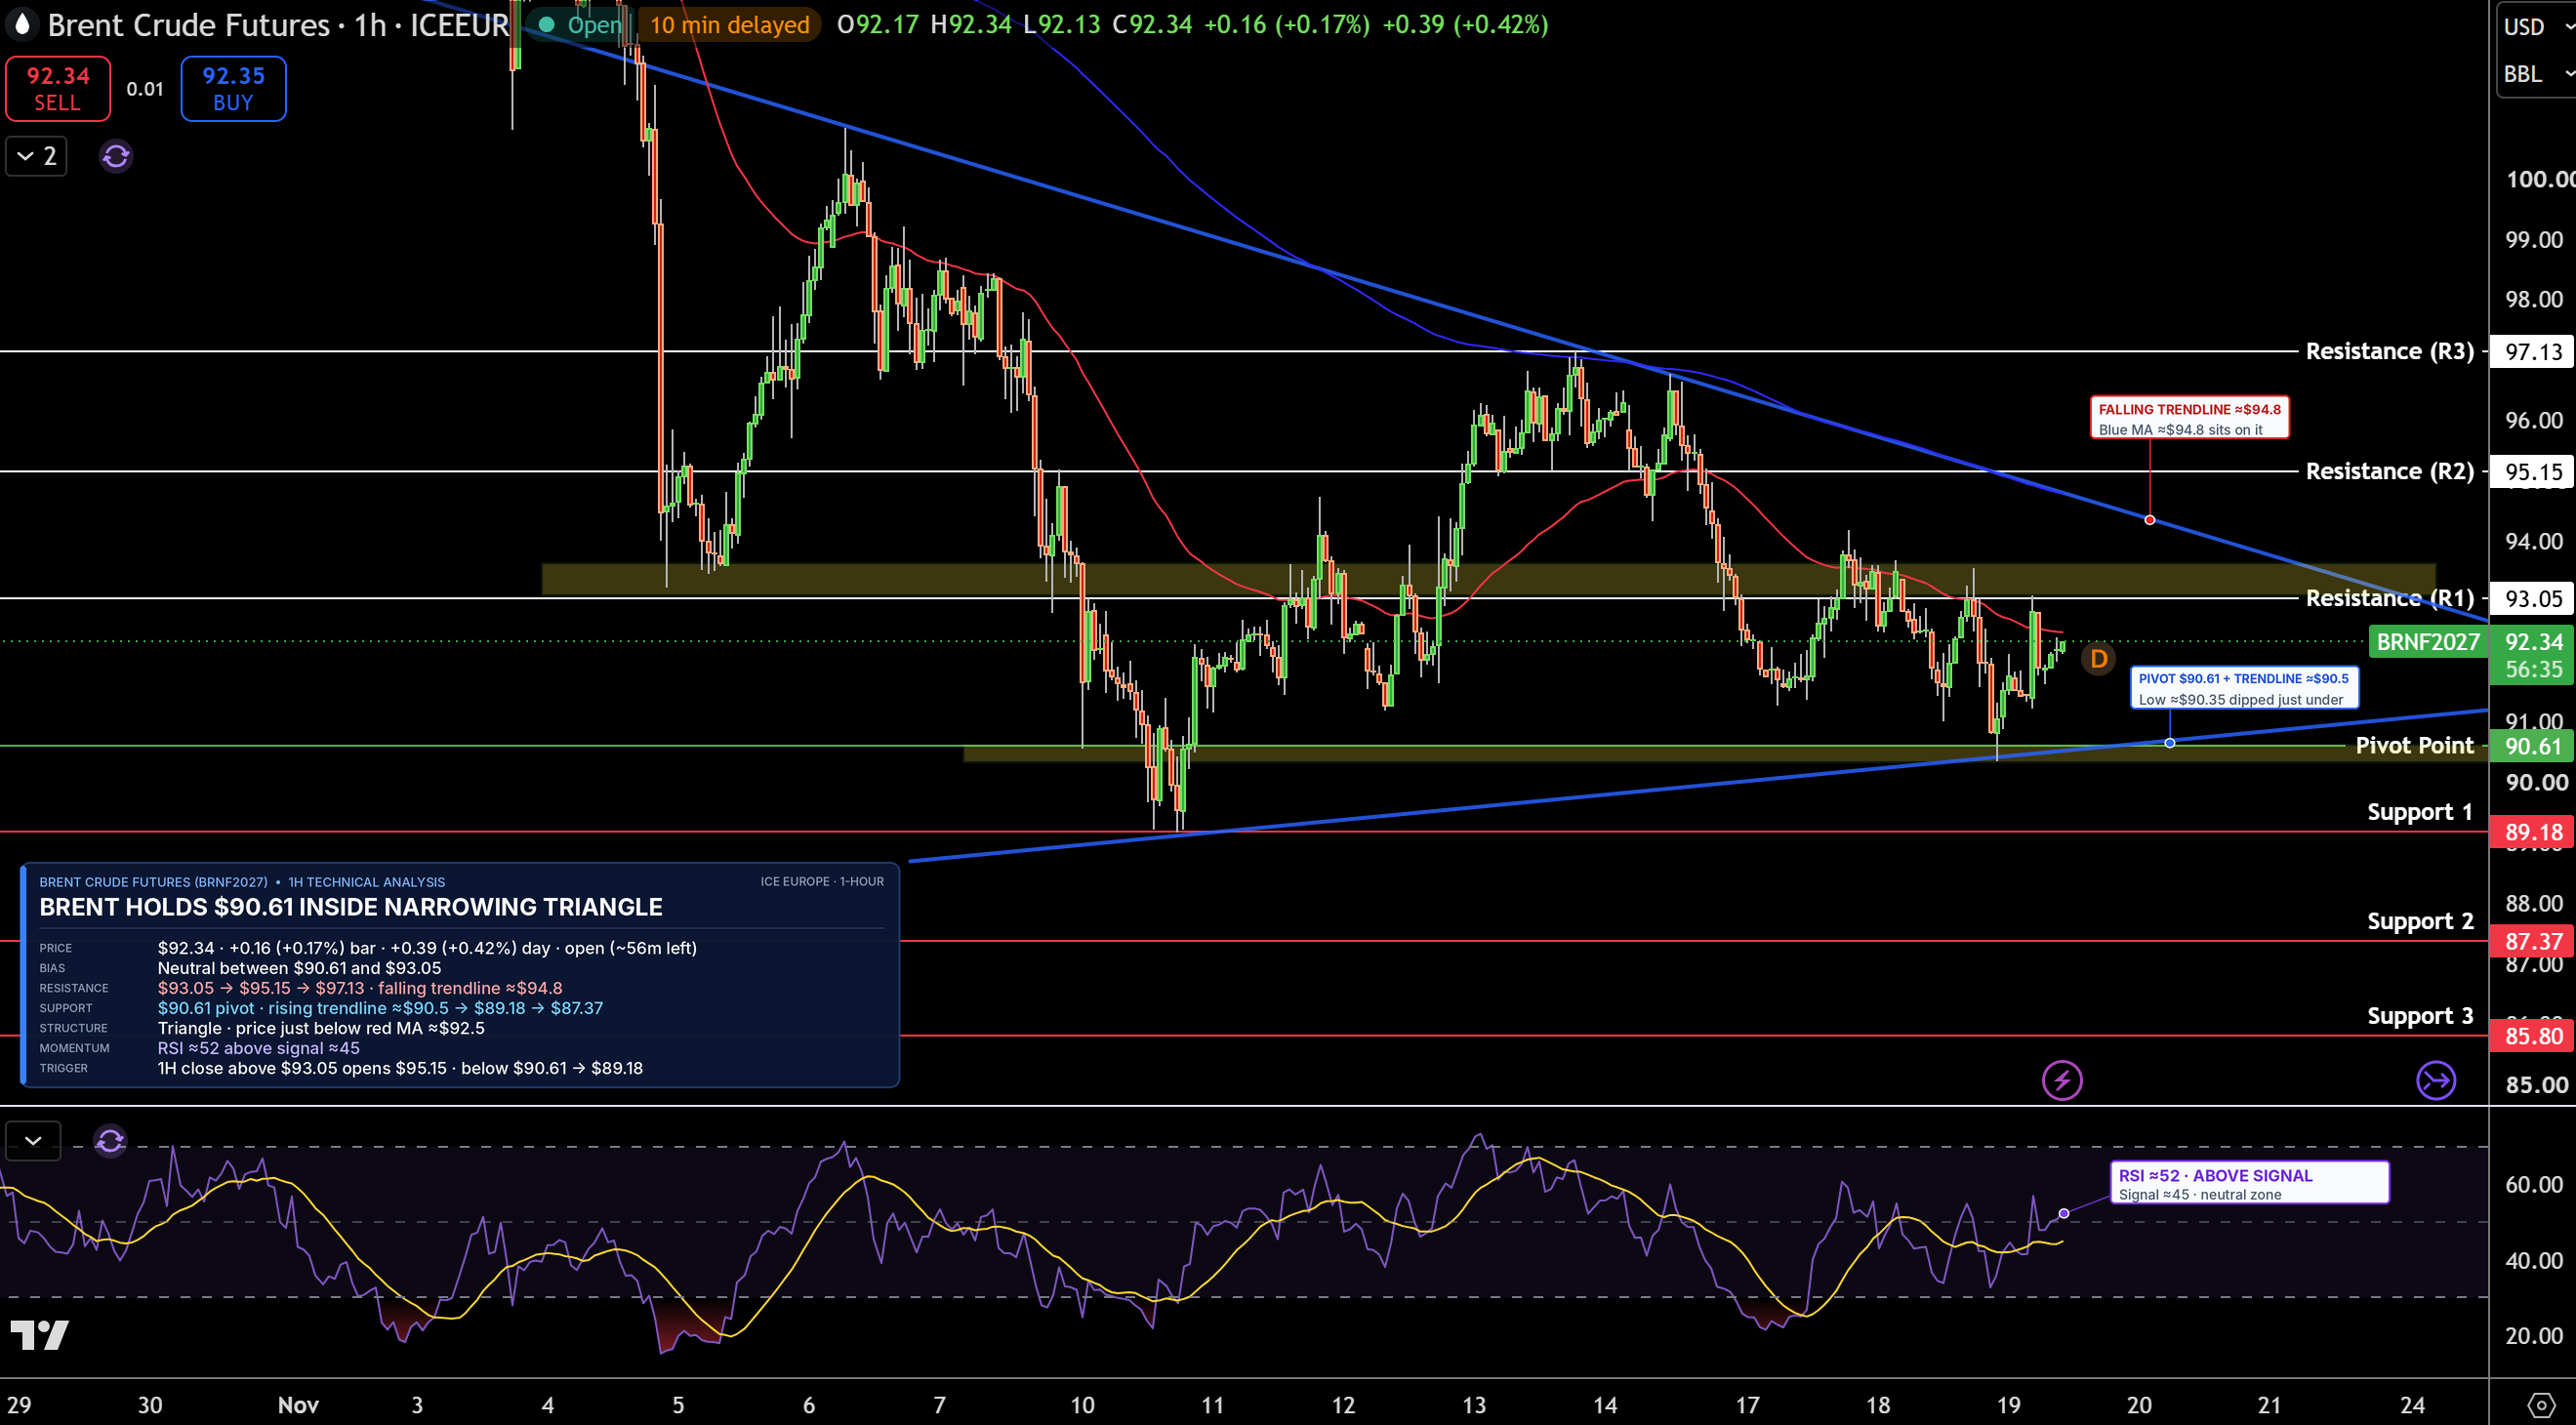
January Brent futures are trading near $92.34 on the 1-hour chart, inside a triangle, a pattern where price swings get smaller before a bigger move. A falling trendline caps it from above, and a rising one supports it from below. Buyers defended the $90.61 zone, the pivot point, a level calculated from the previous period’s high, low and close that traders use to judge direction, this week.
Resistance, where sellers may return, is the $93.05 zone, then $95.15. Support, where buyers may step in, is $90.61, then $89.18. RSI, a 0 to 100 gauge of buying and selling strength, is near 52 and above its signal line, a slower average of RSI, so momentum is improving. I stay neutral while Brent trades between $90.61 and $93.05. A close above $93.05 would open $95.15, while a drop below $90.61 would point to $89.18.
Natural Gas Technical Analysis: NG Jumps Above $3.29 as $3.42 Comes Into Focus
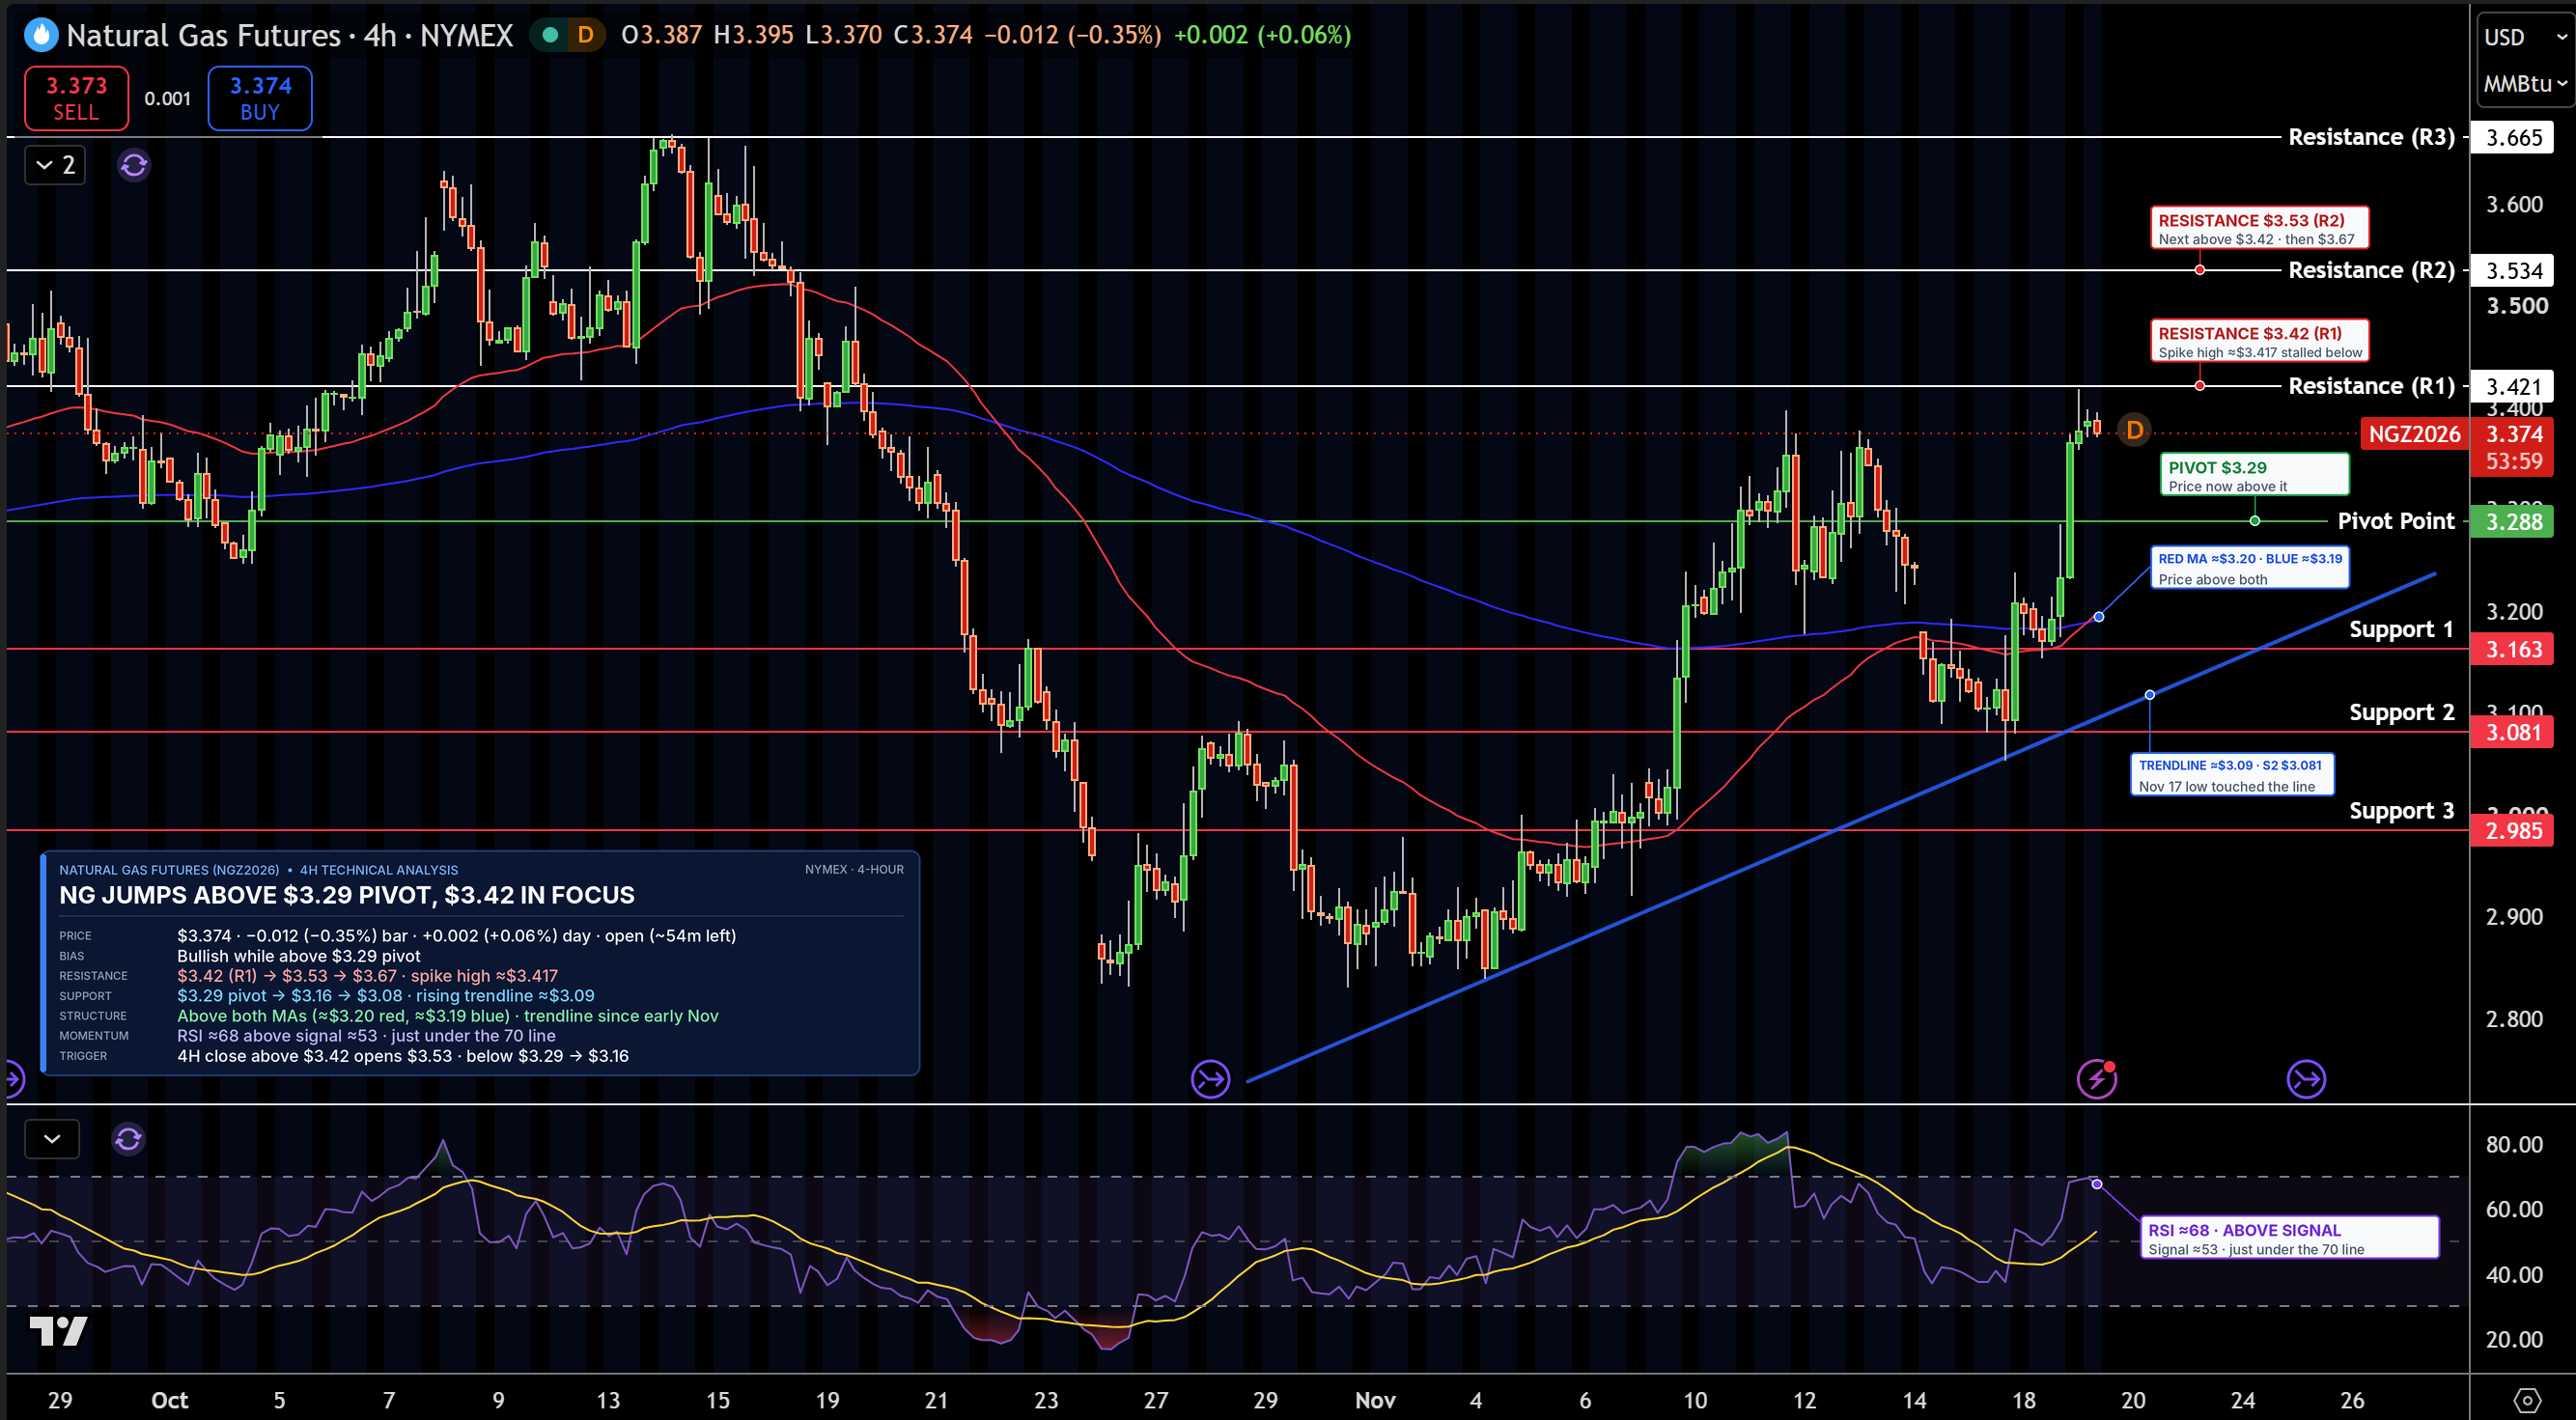
December natural gas futures are trading near $3.37/MMBtu, or per million British thermal units, on the 4-hour chart. Buyers stepped in near $3.08 at a rising trendline, a line connecting higher lows since early November, and prices then climbed above the $3.29 pivot. Gas is now above both moving averages, which track average prices over time.
Resistance is $3.42, then $3.53. Support is $3.29, then $3.16. RSI is near 68, close to overbought, meaning prices rose fast. The bias is bullish while gas holds $3.29, and a close above $3.42 would open $3.53.
WTI Crude Oil Technical Analysis: Oil Stays Below $83.13 as $81.13 Support Holds
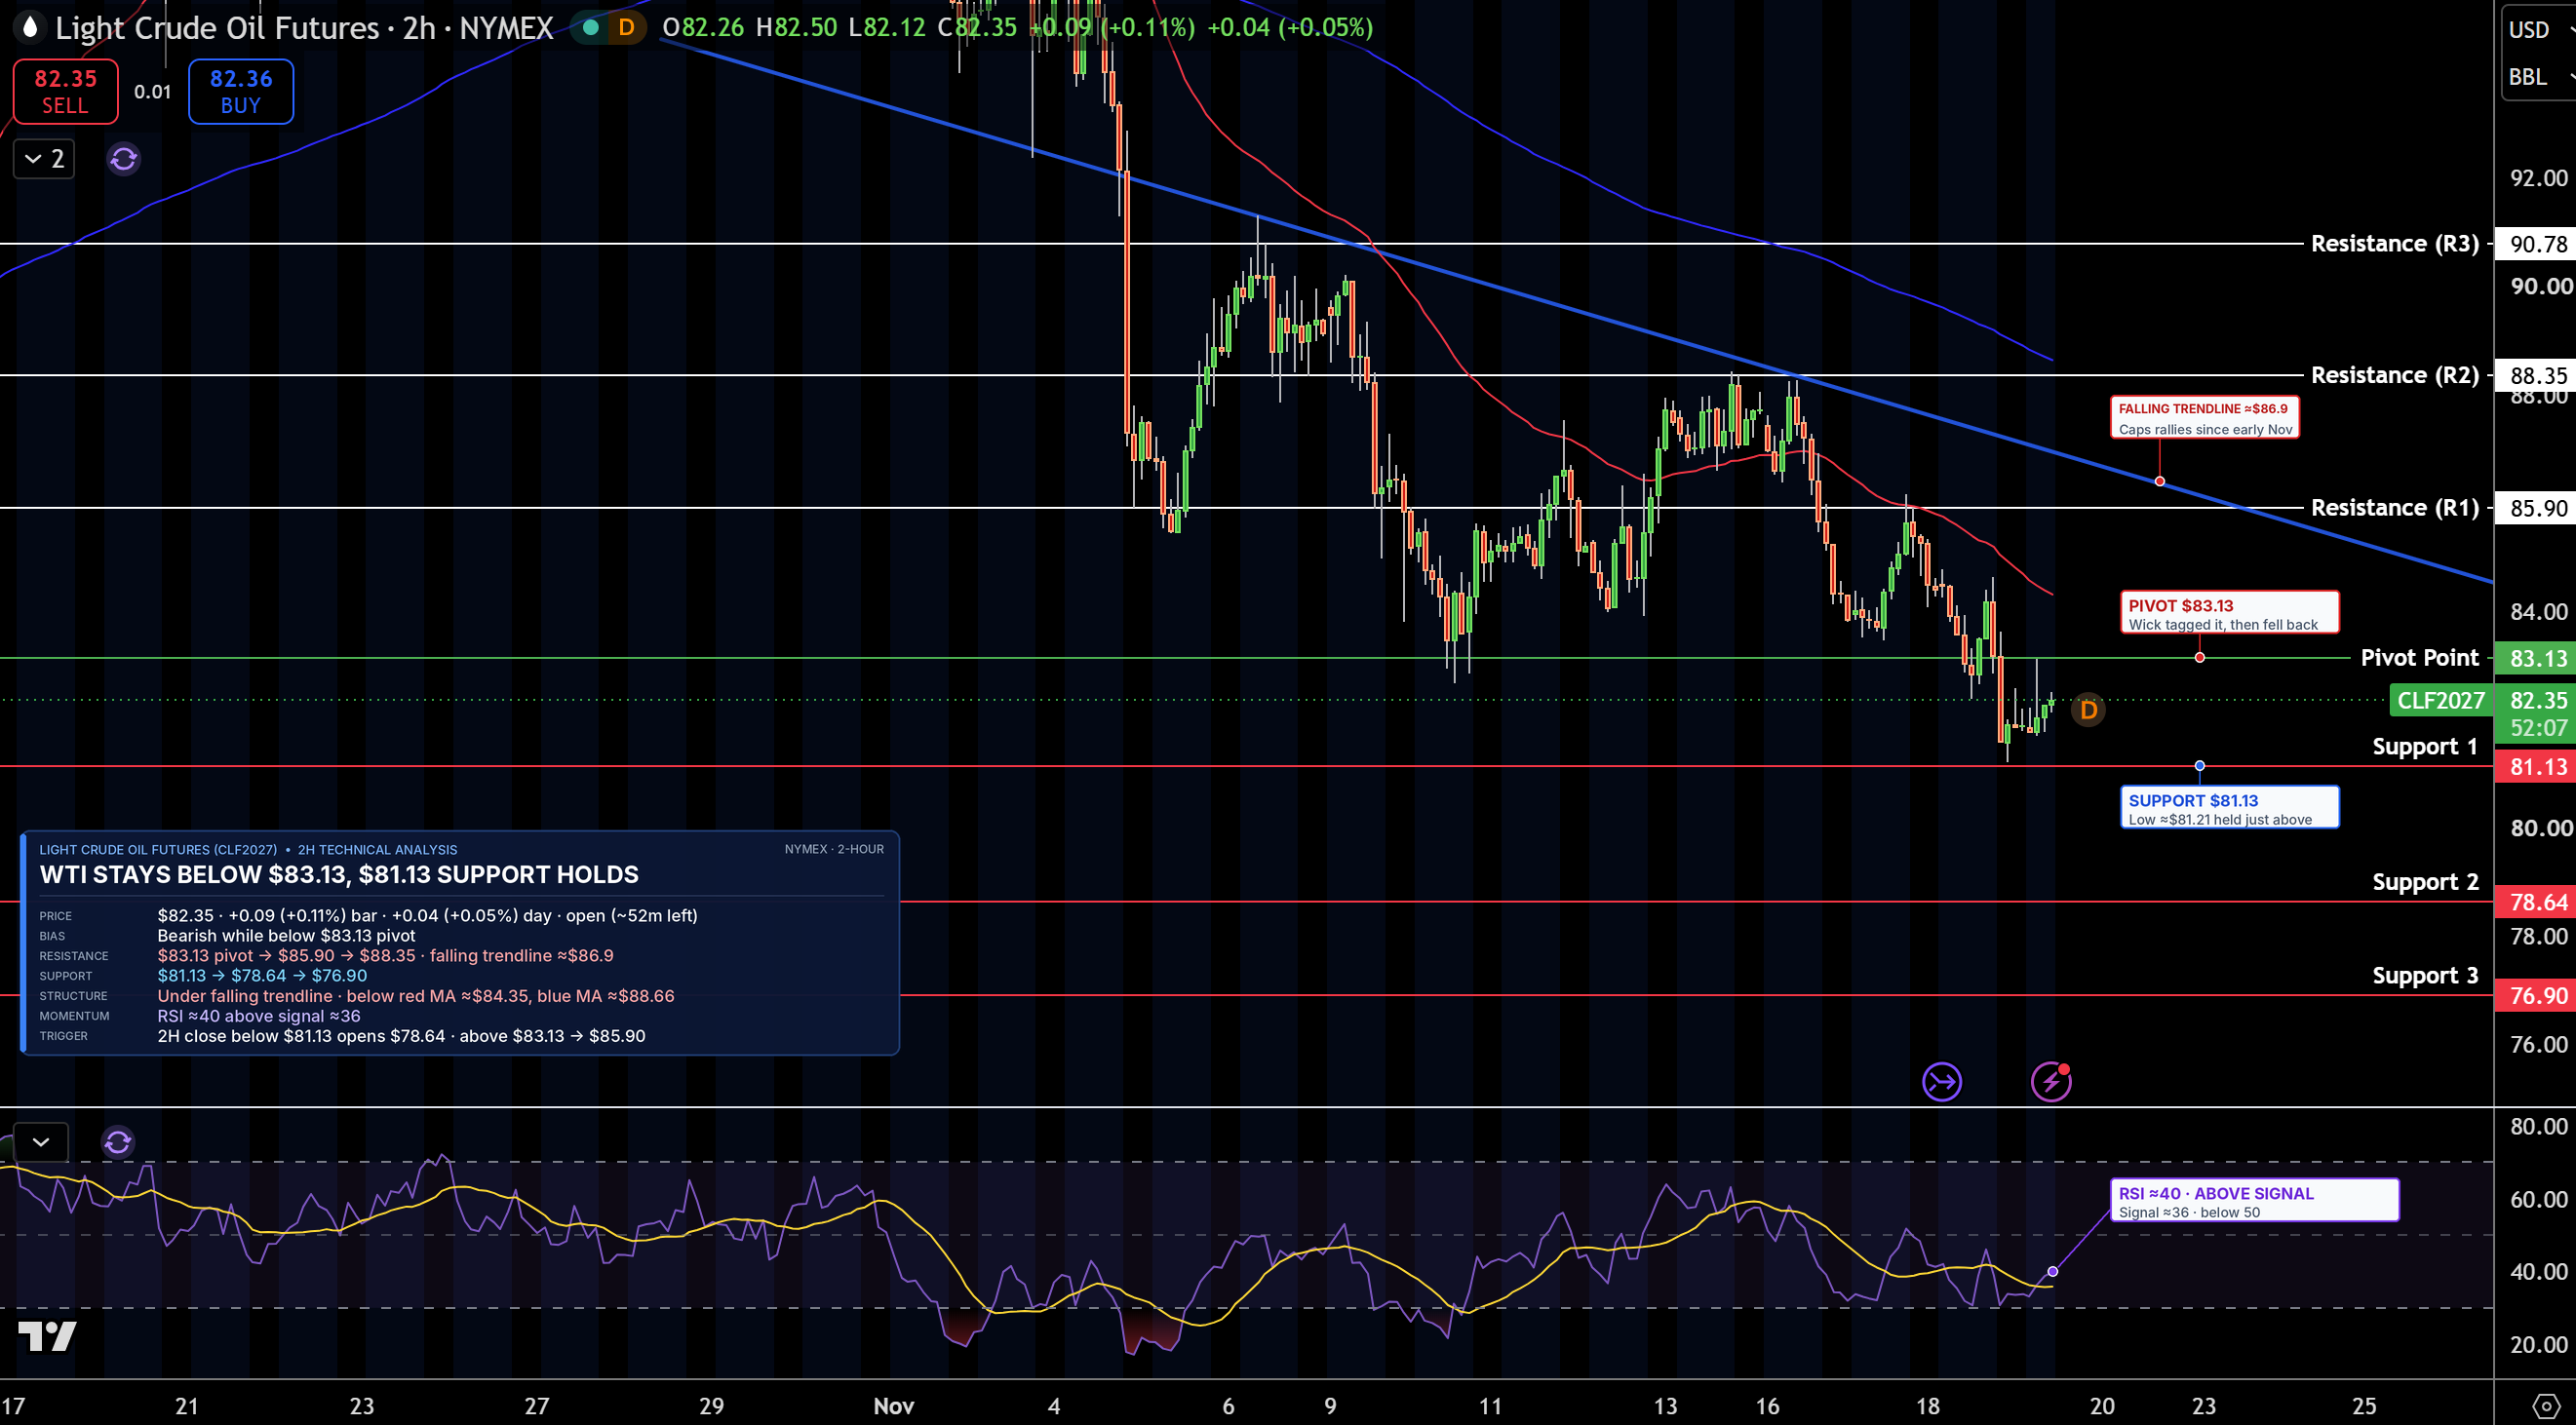
January WTI futures are trading near $82.35 on the 2-hour chart. Buyers stepped in just above $81.13, but prices remain below the $83.13 pivot, under a falling trendline from early November and below both moving averages.
Support is $81.13, then $78.64. Resistance is $83.13, then $85.90. RSI is near 40 and just above its signal line, so selling is easing slightly. WTI stays bearish while it holds below $83.13, and a close below $81.13 would open $78.64.