



Oil Steadies as Traders Weigh Iran Talks and Reported US Strike
WTI is trading near $97.05 a barrel and January Brent near $105.23. December natural gas is trading near $2.88/MMBtu. A reported US strike on Iranian territory put some risk premium, the extra price traders pay for the chance of a supply disruption, back into a market that had started pricing in diplomacy. Americans vote in the midterm elections today.
Brent: A Peace Signal, Then a Reported Strike
Iranian President Masoud Pezeshkian said Supreme Leader Ayatollah Mojtaba Khamenei had granted the government “certain authorities” for peace talks, Reuters reported. “The oil market is still reacting with extreme sensitivity to every headline out of the Middle East,” said UBS analyst Giovanni Staunovo. Over the weekend, after a third day of talks with Qatari mediators in Doha, Iran said it was ready for both “defence and diplomacy.”
Then the tone changed. The Wall Street Journal reported, citing US officials, that the US military struck Iran’s Qeshm Island in the Strait of Hormuz. Some officials described the attacks as defensive, aimed at stopping Iran from targeting commercial vessels. “The report added a degree of risk premium back into the oil price,” said Tim Waterer, chief market analyst at KCM Trade.
In my view, traders are still giving more weight to the talks than to the reported strike, at least for now.
WTI: Election Day Uncertainty
The vote matters for oil because President Trump said in October that the US would not attack Iran before the November 3 midterm elections. On Monday, he said Iran wants to make a deal and that an agreement “could happen,” Reuters reported. ING analysts expect the bigger signals on Wednesday, when markets will have guidance on what the midterms mean and the Treasury’s quarterly refunding announcement, its plan for how much debt it will sell.
Natural Gas Price Forecast
Every new Natural Gas analysis as it publishes, today's technical signal and key levels, live price — on one page.
See all Natural Gas forecastsNatural Gas: Cold Bets Return
US natural gas futures rose during Monday’s session as traders bought back short positions, which are bets on falling prices, and on talk of a polar vortex breakdown later in November, which can push Arctic air into the US, Pipeline & Gas Journal reported. LSEG expects Lower 48 demand, including exports, to rise from 109.1 Bcf/d, or billion cubic feet per day, this week to 116.7 Bcf/d next week.
Phil Flynn of Price Futures Group said short-term fundamentals remain bearish, but the cold talk is “putting the bears on notice that they better be careful.” The bigger picture is still relaxed. On Friday, the March-April 2027 spread, the extra price of March gas over April gas, fell to a record low of about 5 cents per MMBtu, a sign traders see little risk of a winter shortage.
WTI Technical Analysis: Oil Trades Above $95.17 Support
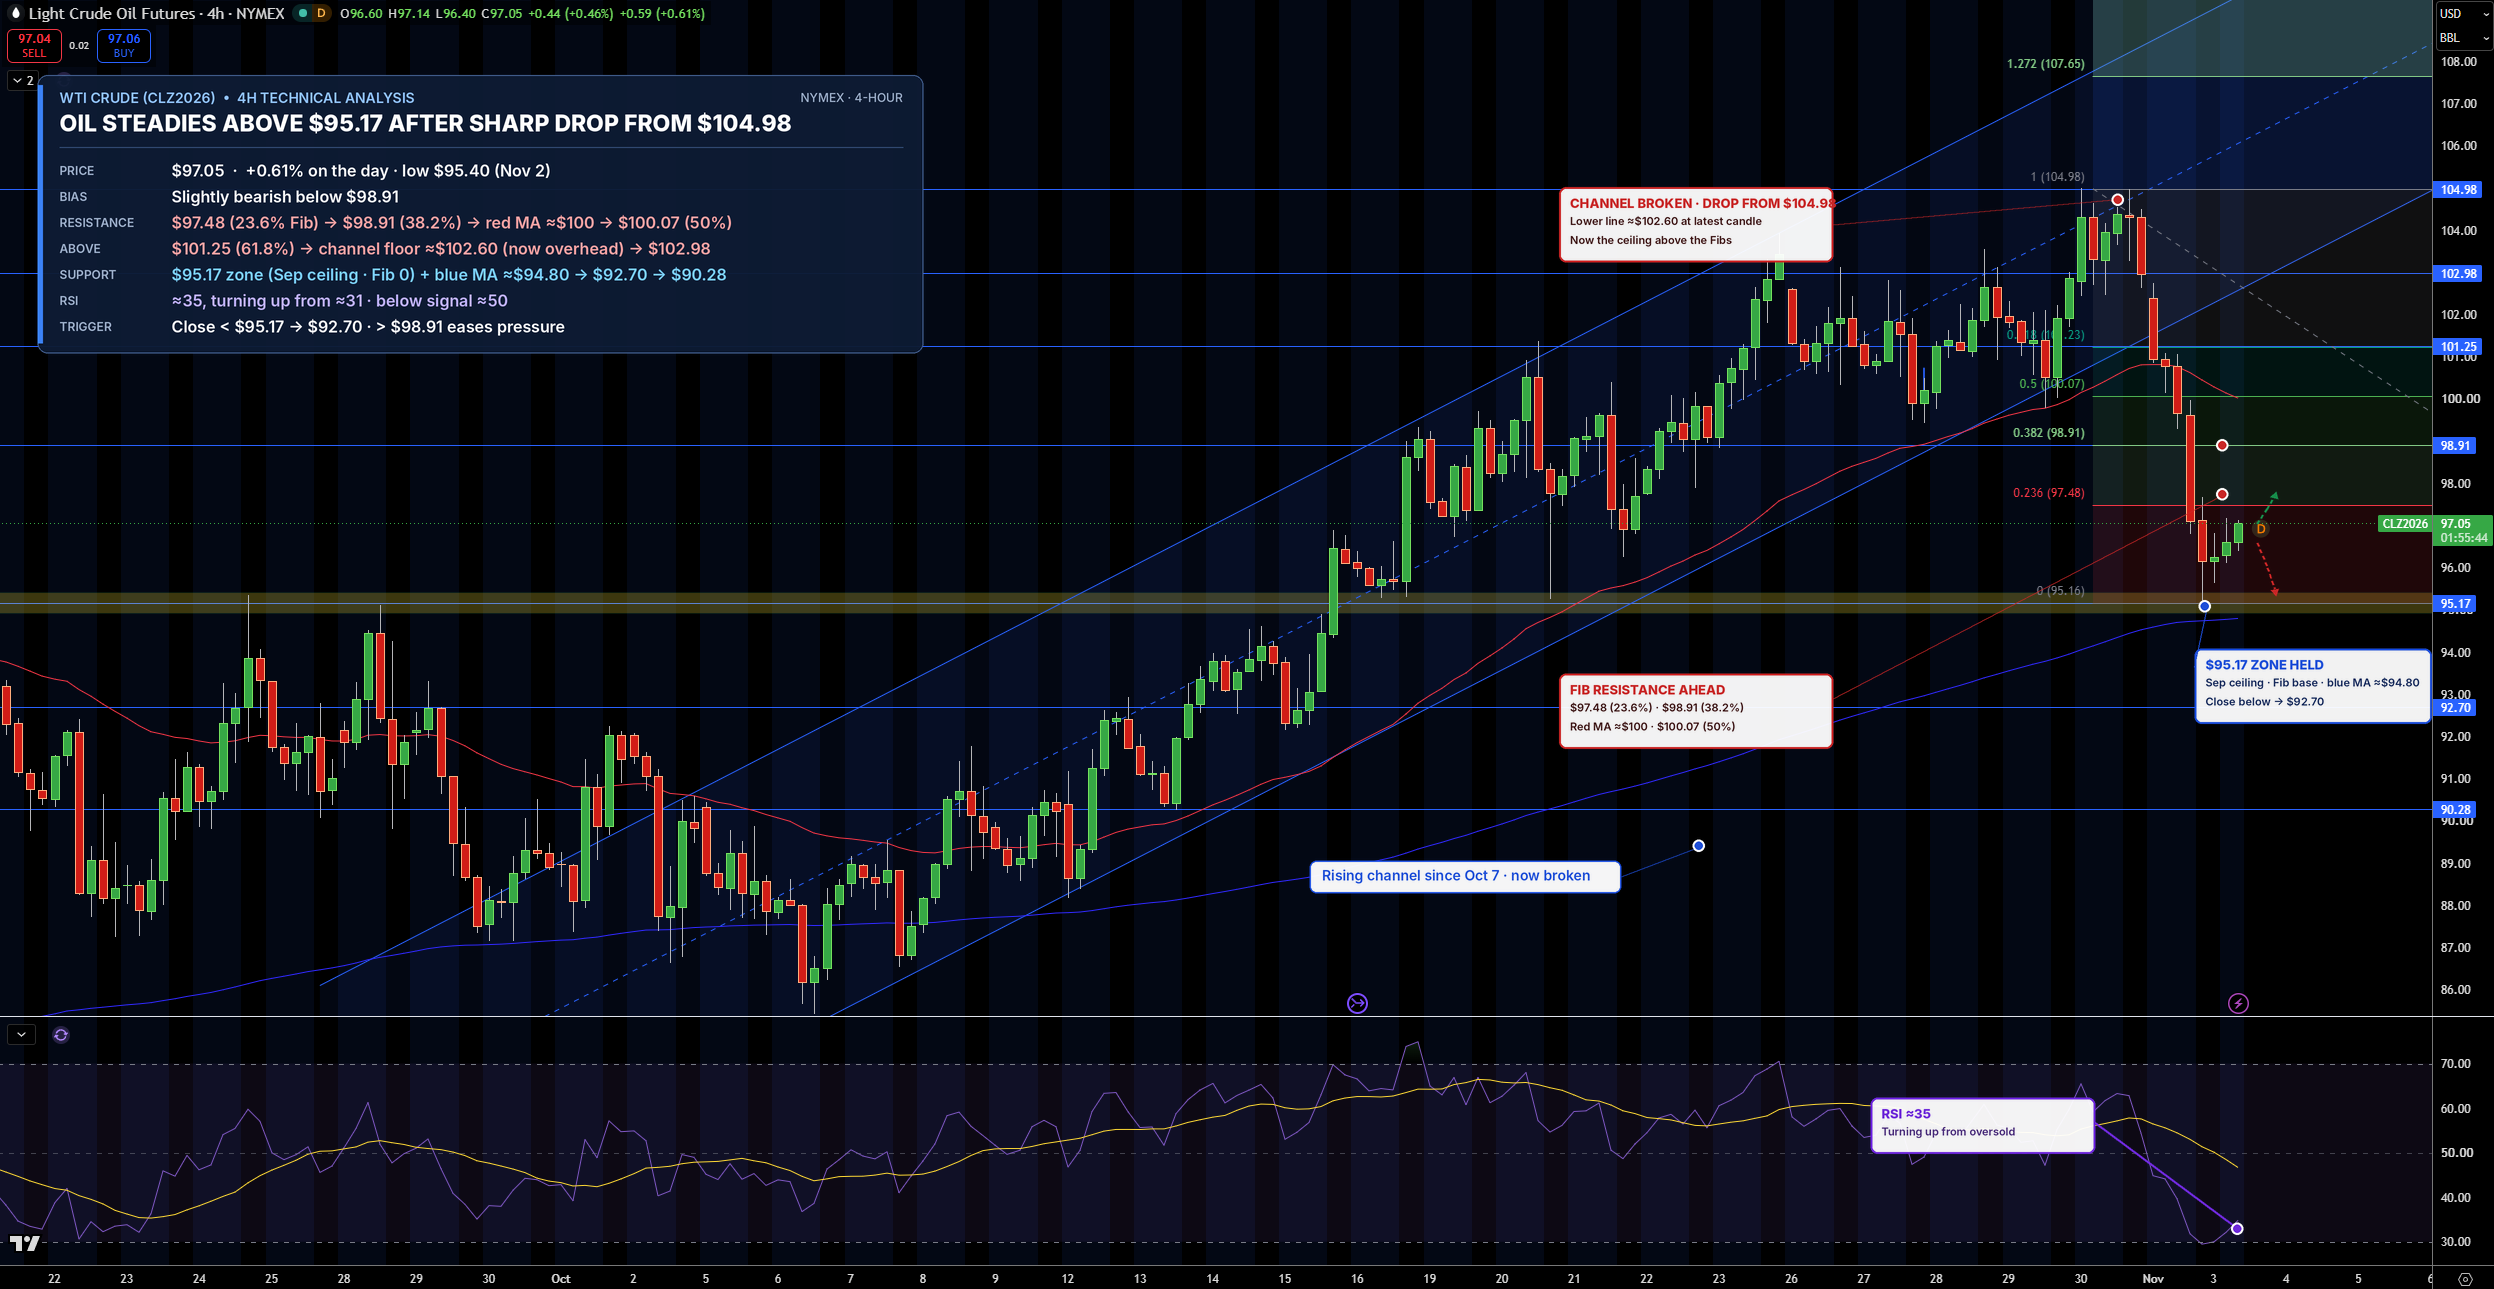
WTI is trading near $97.05 a barrel on the 4-hour chart. Price is below the rising channel, two parallel lines that had guided prices higher since early October. Monday’s low was $95.40, above $95.17, an old September ceiling that now acts as support.
Resistance, where sellers tend to step in, comes at $97.48 and then $98.91. Both are Fibonacci retracement levels, which show how much of the drop has been recovered. RSI, a 0 to 100 gauge of buying and selling strength, is near 35 and turning up from oversold, meaning prices fell very fast. I hold a slight bearish lean while WTI stays below $98.91. A close below $95.17 would open $92.70.
Brent Technical Analysis: Oil Holds Above $103.29 After Channel Breakdown
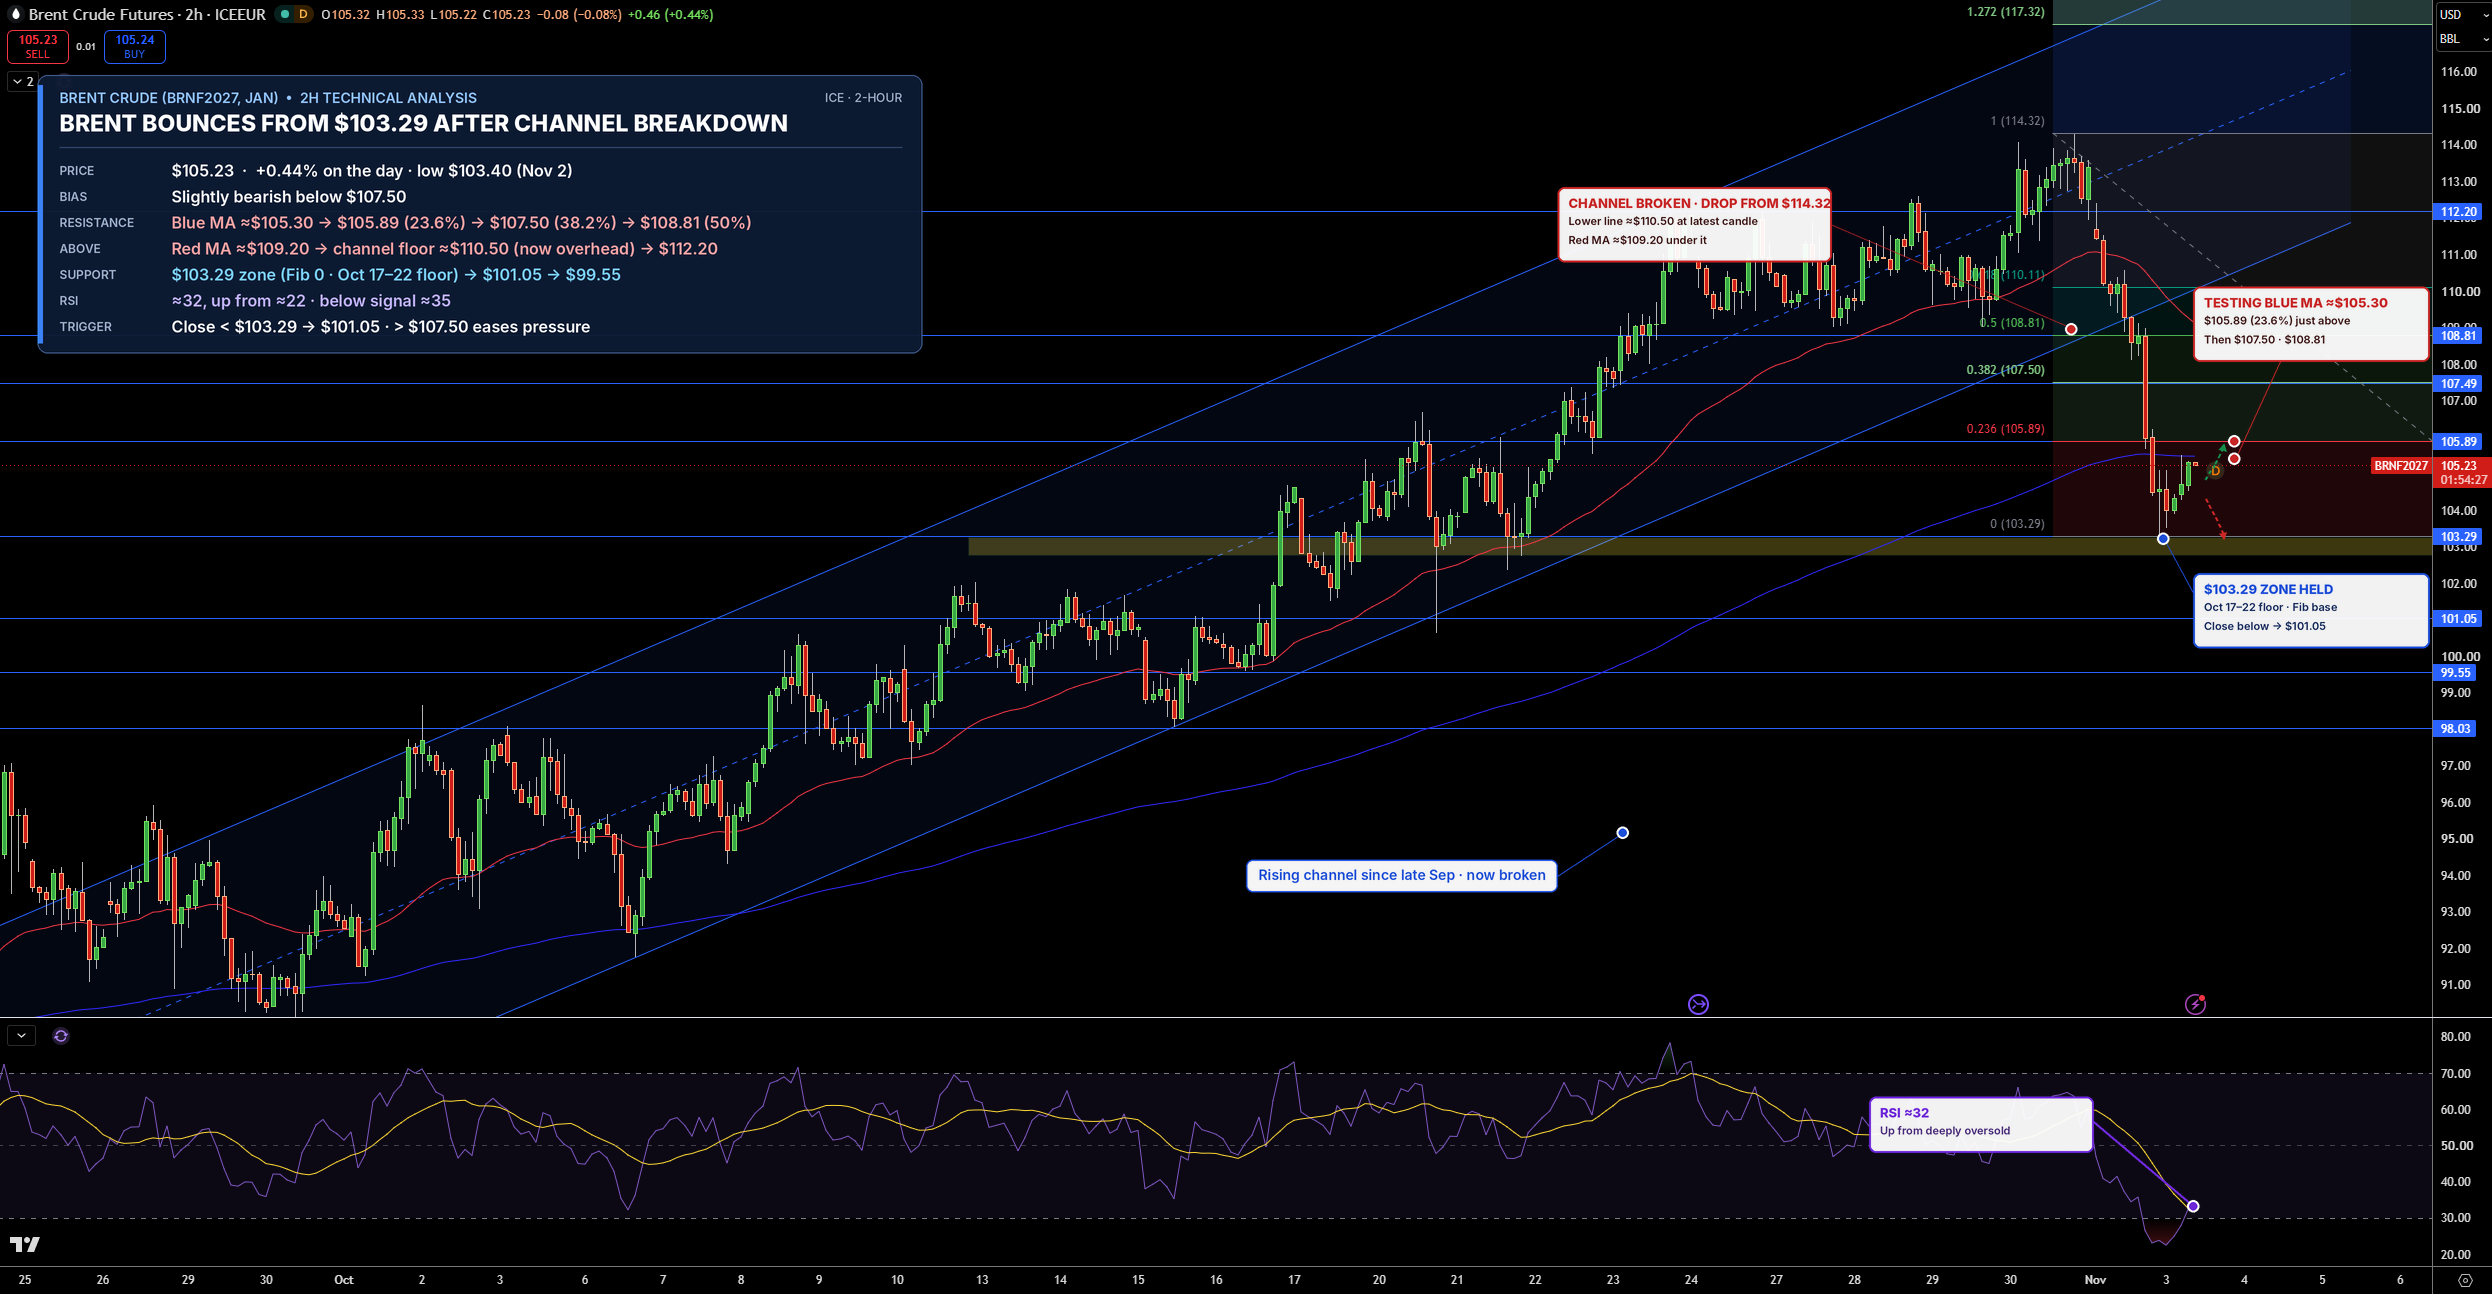
January Brent futures are trading near $105.23 a barrel on the 2-hour chart. Brent broke its rising channel from late September and is now testing the slower moving average, a line that tracks the longer-term average price.
The first resistance is $105.89, then $107.50, both Fibonacci levels. Monday’s low was $103.40. Support sits at $103.29, then $101.05. RSI has recovered to about 32 from deeply oversold, so the selling is easing, but buyers have not taken over. The bias is a slight bearish lean while Brent stays below $107.50, and a close below $103.29 would open $101.05.
Natural Gas Technical Analysis: NG Holds $2.80 Floor as Trendline Caps Rallies
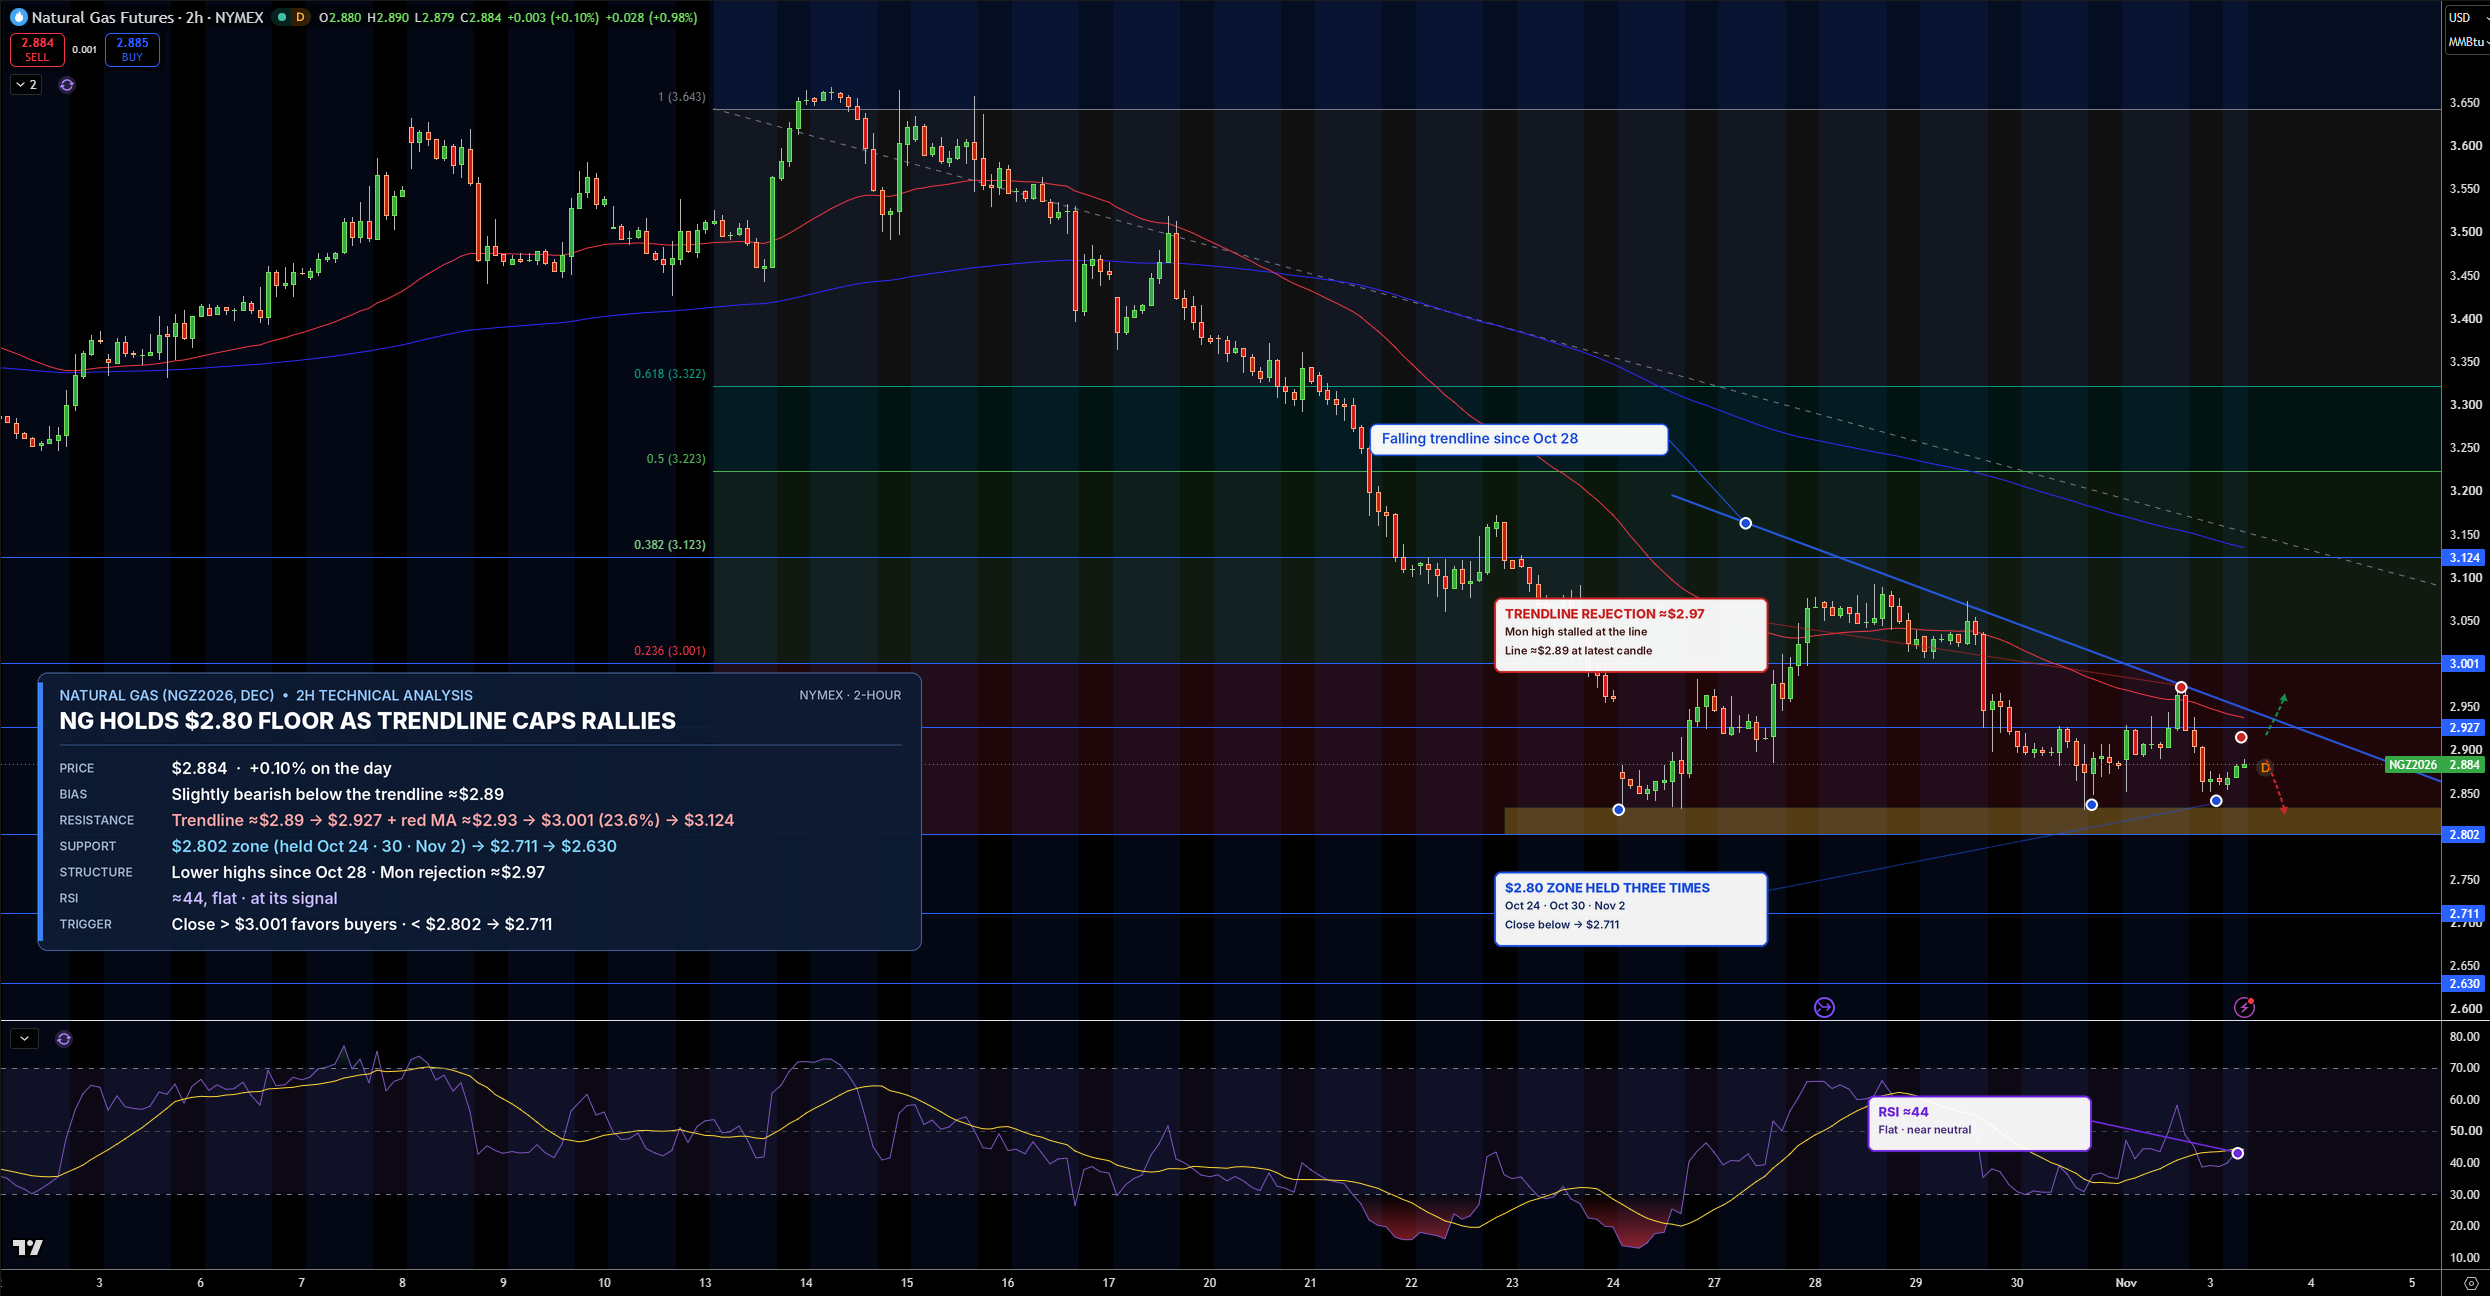
Natural gas is trading near $2.88/MMBtu on the 2-hour chart. On Monday, sellers turned prices back near $2.97 at a falling trendline, a line connecting the lower highs since late October. Buyers keep defending the $2.80 zone, which has held three times since October 24.
Resistance is $2.93, then $3.00. Support is $2.80, then $2.71. RSI is near 44 and flat, close to neutral. My view is a slight bearish lean while gas stays below the trendline. A close above $3.00 would favor buyers, while a drop below $2.80 would open $2.71.