Analysts noted that geopolitical tensions could support oil prices despite weaker U.S. retail sales and mixed Chinese economic data.
U.S. crude inventories increased by 2.264 million barrels, contrary to expectations of a 2.2 million barrel draw, potentially capping further oil price gains. Federal Reserve rate cut expectations, driven by mixed U.S. economic indicators, might spur economic activity and lift oil consumption, impacting both oil and natural gas forecasts.
Natural Gas Price Forecast
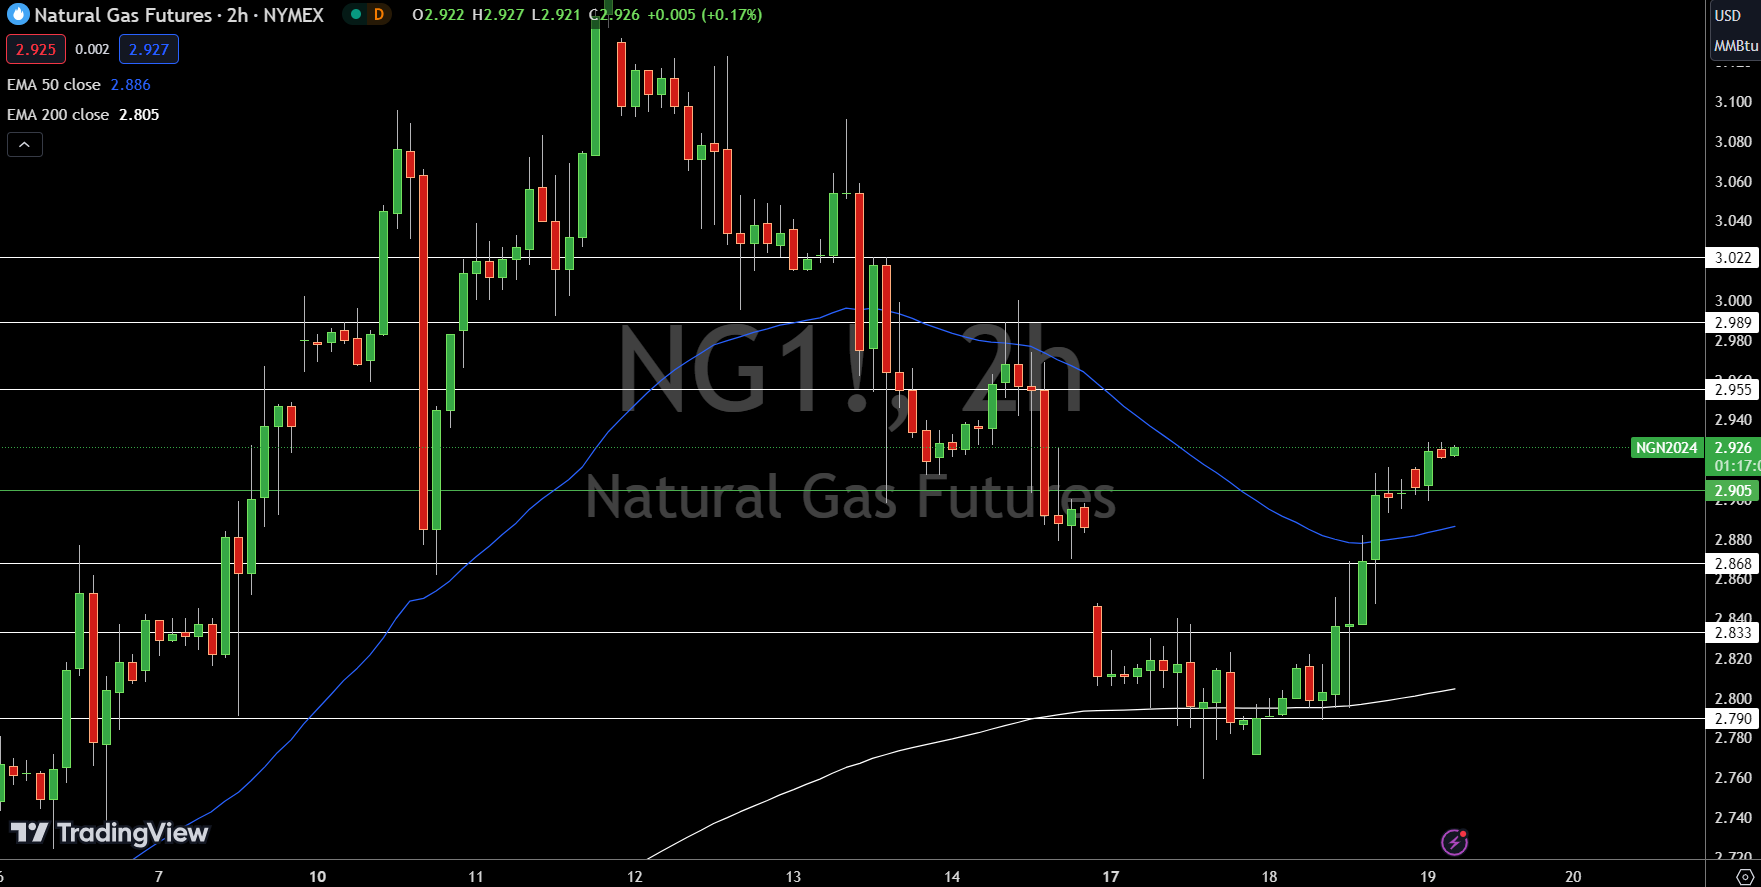
Natural Gas (NG) is currently trading at $2.9900, up 0.71%. The pivot point at $2.905 is crucial for determining the next move. Immediate resistance is noted at $2.955, followed by $2.989 and $3.022.
On the downside, immediate support is found at $2.868, with further support at $2.833 and $2.790. The 50-day Exponential Moving Average (EMA) stands at $2.886, while the 200-day EMA is at $2.805. The overall outlook remains bullish above $2.905, but a break below this level could trigger a sharp selling trend.
WTI Oil Price Forecast
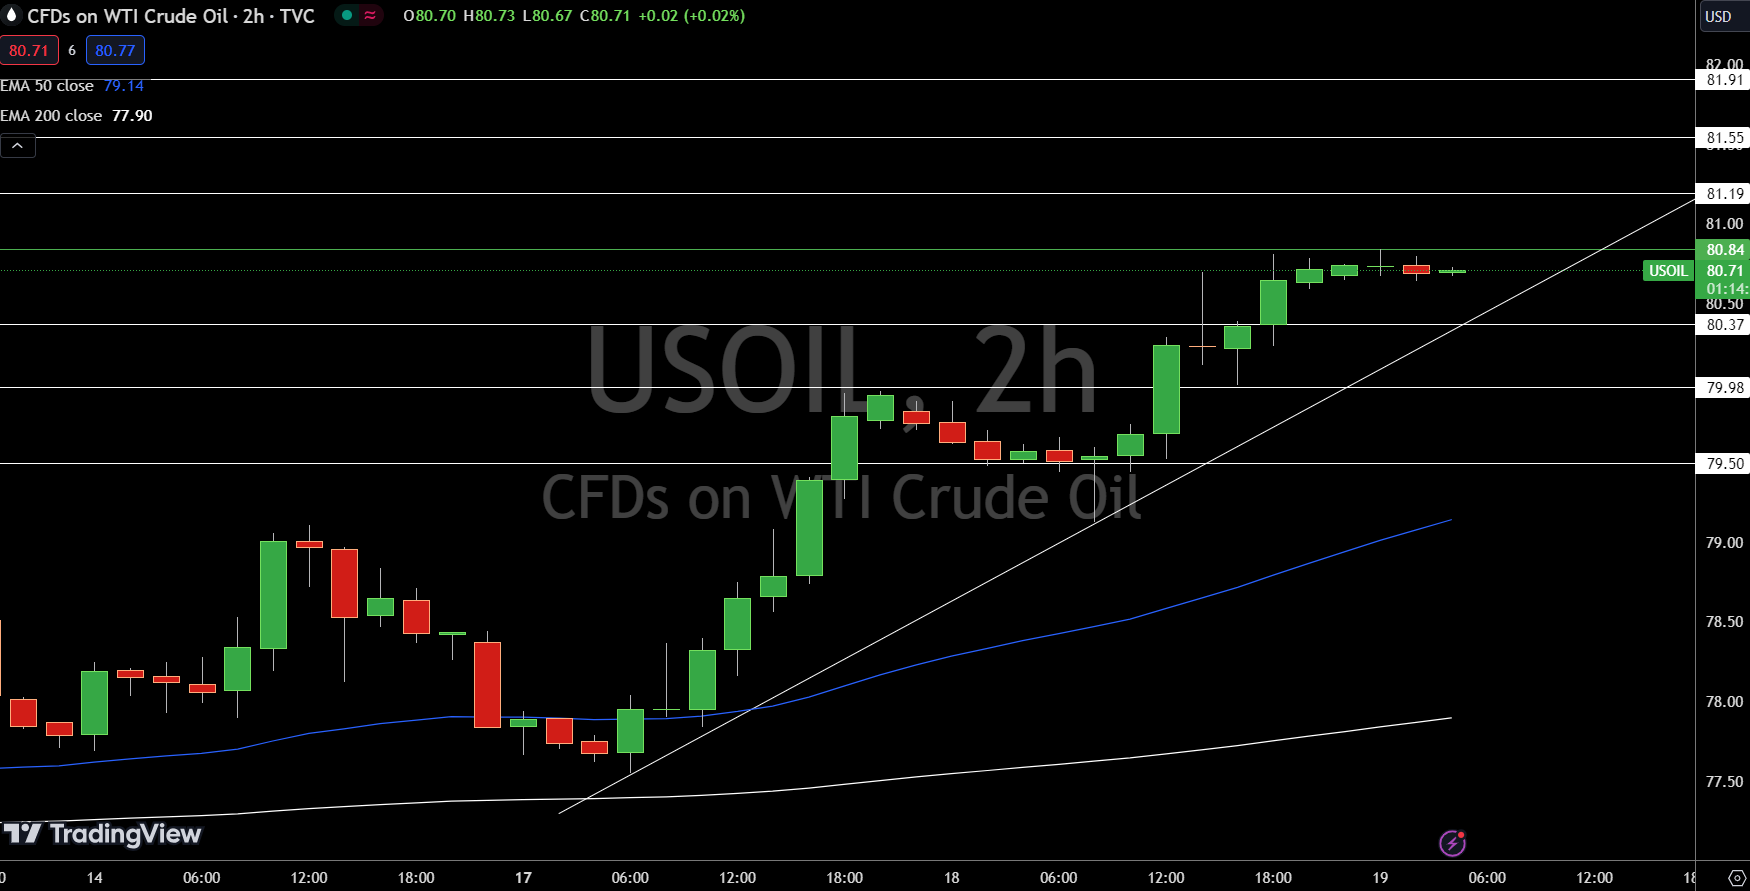
USOIL is currently trading at $80.72, showing a slight increase of 0.01%. The pivot point at $80.84 is crucial for determining the next move. Immediate resistance is seen at $81.19, followed by $81.55 and $81.91. On the downside, immediate support is found at $80.37, with further support at $79.98 and $79.50.
The 50-day Exponential Moving Average (EMA) is at $79.14, and the 200-day EMA is at $77.90. The outlook is bearish below $80.84, but a break above this level could enhance bullish momentum.
Brent Oil Price Forecast
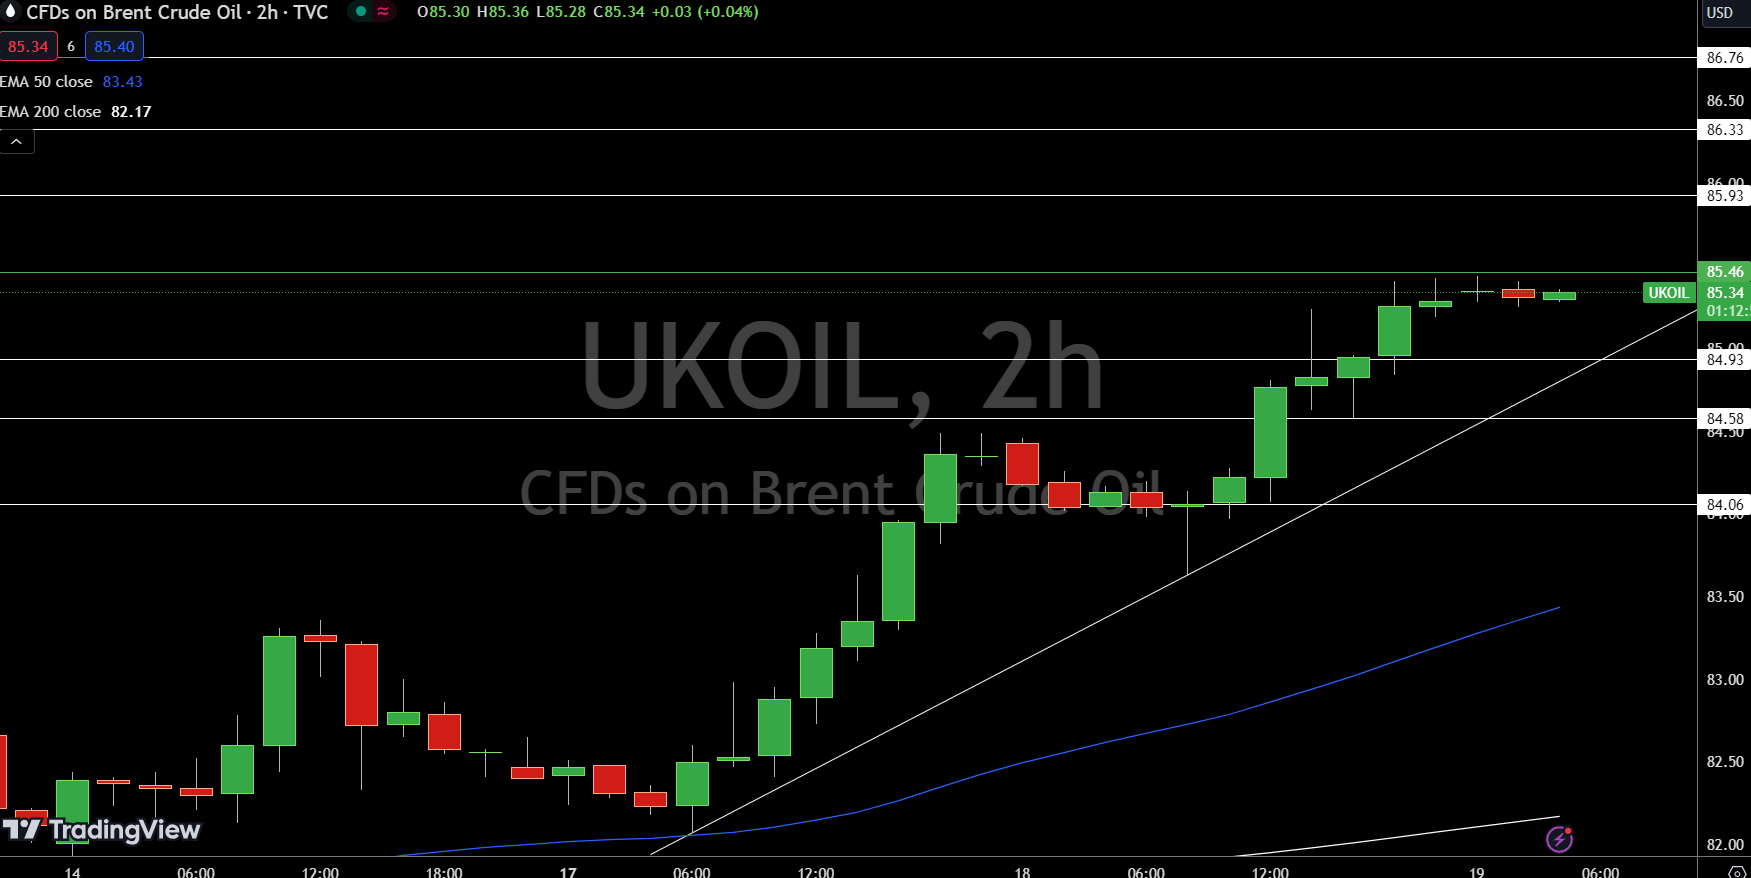
UKOIL is currently trading at $85.34, up 0.08%. The pivot point at $85.46 is critical for determining the next move. Immediate resistance is at $85.93, followed by $86.33 and $86.76.
On the downside, immediate support is found at $84.93, with further support at $84.58 and $84.06. The 50-day Exponential Moving Average (EMA) is at $83.43, while the 200-day EMA is at $82.17.
The outlook remains bearish below $85.46, but a break above this level could enhance bullish momentum.
For a look at all of today’s economic events, check out our economic calendar.