



Oil Slides as Peace Hopes Spread and Supply Returns
Crude fell more than $1 on Thursday as hopes for progress in peace talks over the Iran and Russia-Ukraine wars pressured the market, CNBC reported. Brent lost 1.2% to $91.62 by 01:41 GMT, and WTI fell 1.2% to $85.49. Rising OPEC+ output and a large US inventory build are also in focus.
Brent: Two Wars, One Direction
“Markets are falling on expectations that behind-the-scenes efforts are underway to secure a ceasefire” between Russia and Ukraine, said Hiroyuki Kikukawa, chief strategist at Nissan Securities Investment. Negotiators agreed to a major prisoner exchange at two days of talks in Abu Dhabi that ended on Wednesday, though US mediators said differences remain on other major issues, including territory. Kikukawa added that “it is unlikely the Iran war will escalate ahead of the US-China summit next week.”
Even so, the downside has limits. “However, given the uncertainty surrounding the Strait of Hormuz, the markets are unlikely to suffer a significant collapse,” Kikukawa said. In my view, that fits the price action: peace hopes and a large stock build hit oil on the same day, yet Brent has held above this week’s two-month low.
OPEC: Supply Rebounds Fast
OPEC+ crude output rose by about 2.04mn barrels per day (bpd) in October, led by Saudi Arabia, despite continued disruption to Hormuz shipments, Reuters reported, citing OPEC’s November Monthly Oil Market Report. Saudi Arabia told OPEC its output rose to 10.563mn bpd from 8.372mn bpd in September. OPEC’s secondary sources, the outside estimates the group uses to track members, put it lower at about 9.19mn bpd.
On demand, OPEC left its growth forecasts unchanged at 180,000 bpd this year and 2.55mn bpd in 2027. In my view, the near-term problem is that more barrels are returning while this year’s demand barely grows.
Natural Gas Price Forecast
Every new Natural Gas analysis as it publishes, today's technical signal and key levels, live price — on one page.
See all Natural Gas forecastsWTI: A Big Stock Build
US crude stocks rose by 9mn barrels last week, according to market sources citing American Petroleum Institute data. In my view, a build that large is a near-term headwind for WTI. Official EIA figures in the Weekly Petroleum Status Report are due on Thursday, delayed a day by the Veterans Day holiday.
Natural Gas: Cold Hopes Meet Heavy Shorts
US natural gas prices reached their highest level in four weeks on Tuesday on cooler forecasts, record LNG export flows and lower output, Trading Economics reported. Lower 48 production averaged 112.1bn cubic feet per day so far in November, down from 113.4bn in October.
Positioning adds fuel. In late October, hedge funds built their largest short position in Henry Hub futures since CFTC records began in 2013, Bloomberg reported. Short positions are bets on falling prices. In my view, if cold weather arrives, those traders may have to buy back quickly, which can push prices up sharply. The EIA’s next storage report moves to Friday, November 13.
Brent Crude Oil Technical Analysis: Oil Tests Falling Channel Top as $94.81 Caps the Rebound
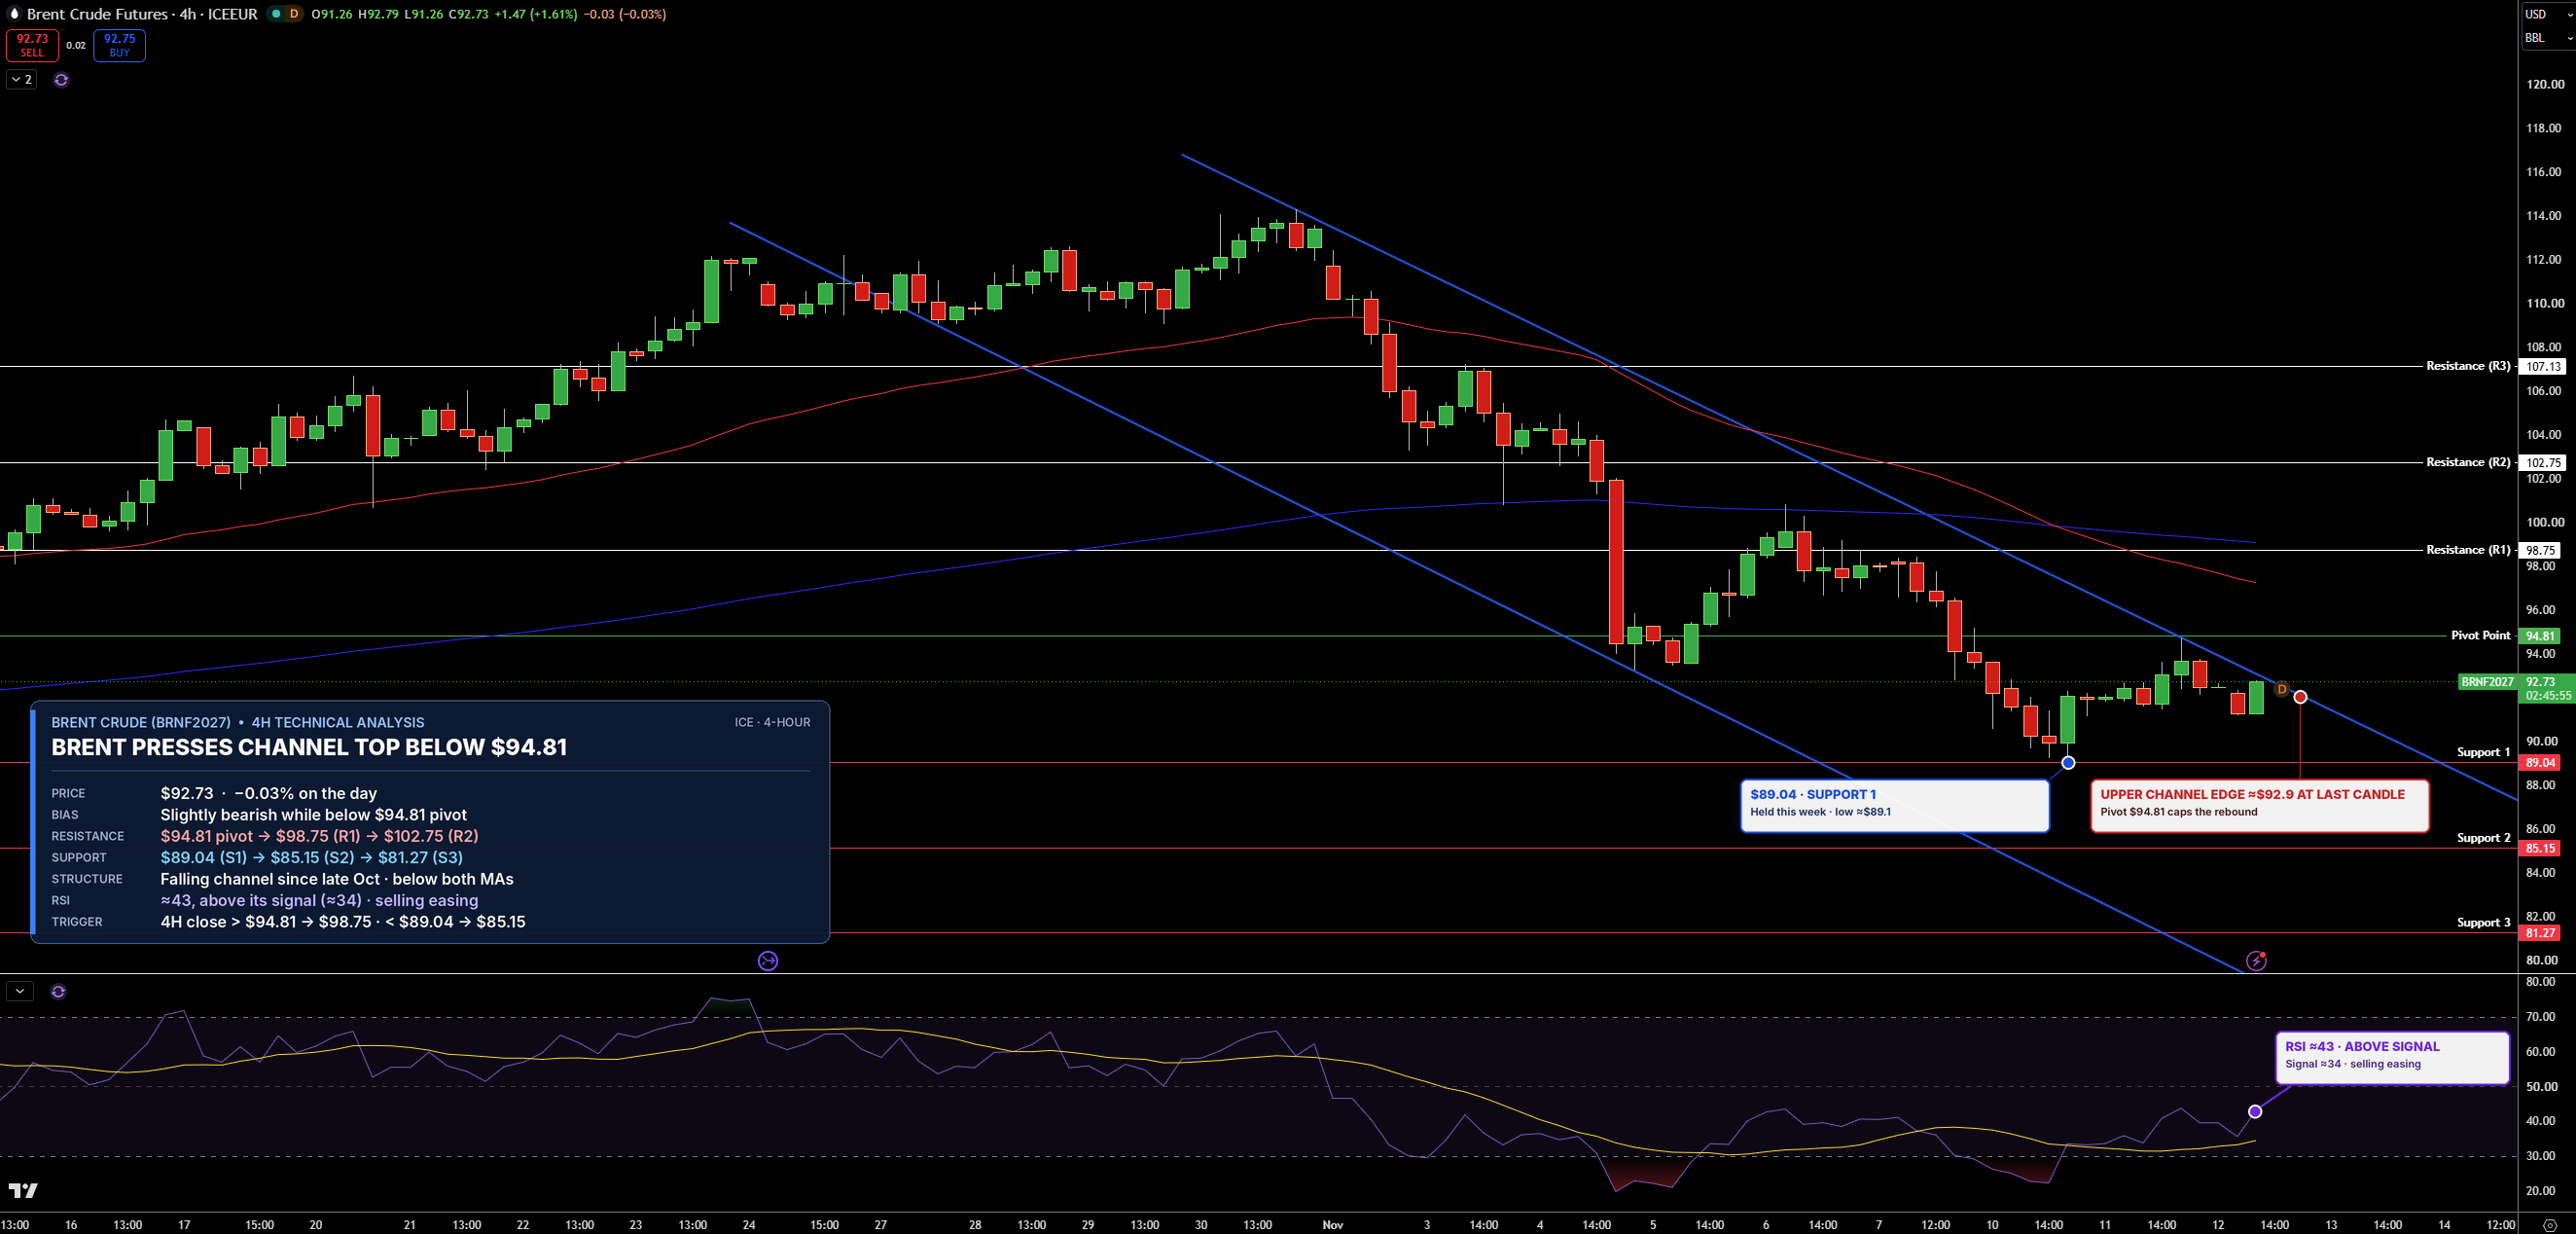
January Brent futures are trading near $92.73 on the 4-hour chart, inside a falling channel, the parallel lines that have guided prices lower since late October. Buyers stepped in above $89.04 this week, and prices are pressing against the top of that channel. Brent remains below $94.81, the pivot point, a level calculated from the previous period’s high, low and close that traders use to judge direction.
Resistance, where sellers may return, is $94.81, then $98.75. Support, where buyers may step in, is $89.04, then $85.15. RSI, a 0 to 100 gauge of buying and selling strength, has risen to about 43 and sits above its signal line, a slower average of RSI, so selling is easing. I lean slightly bearish while Brent stays below $94.81. A close above it would confirm a channel breakout and open $98.75.
Natural Gas Technical Analysis: NG Holds $3.23 Pivot After $3.40 Rejection
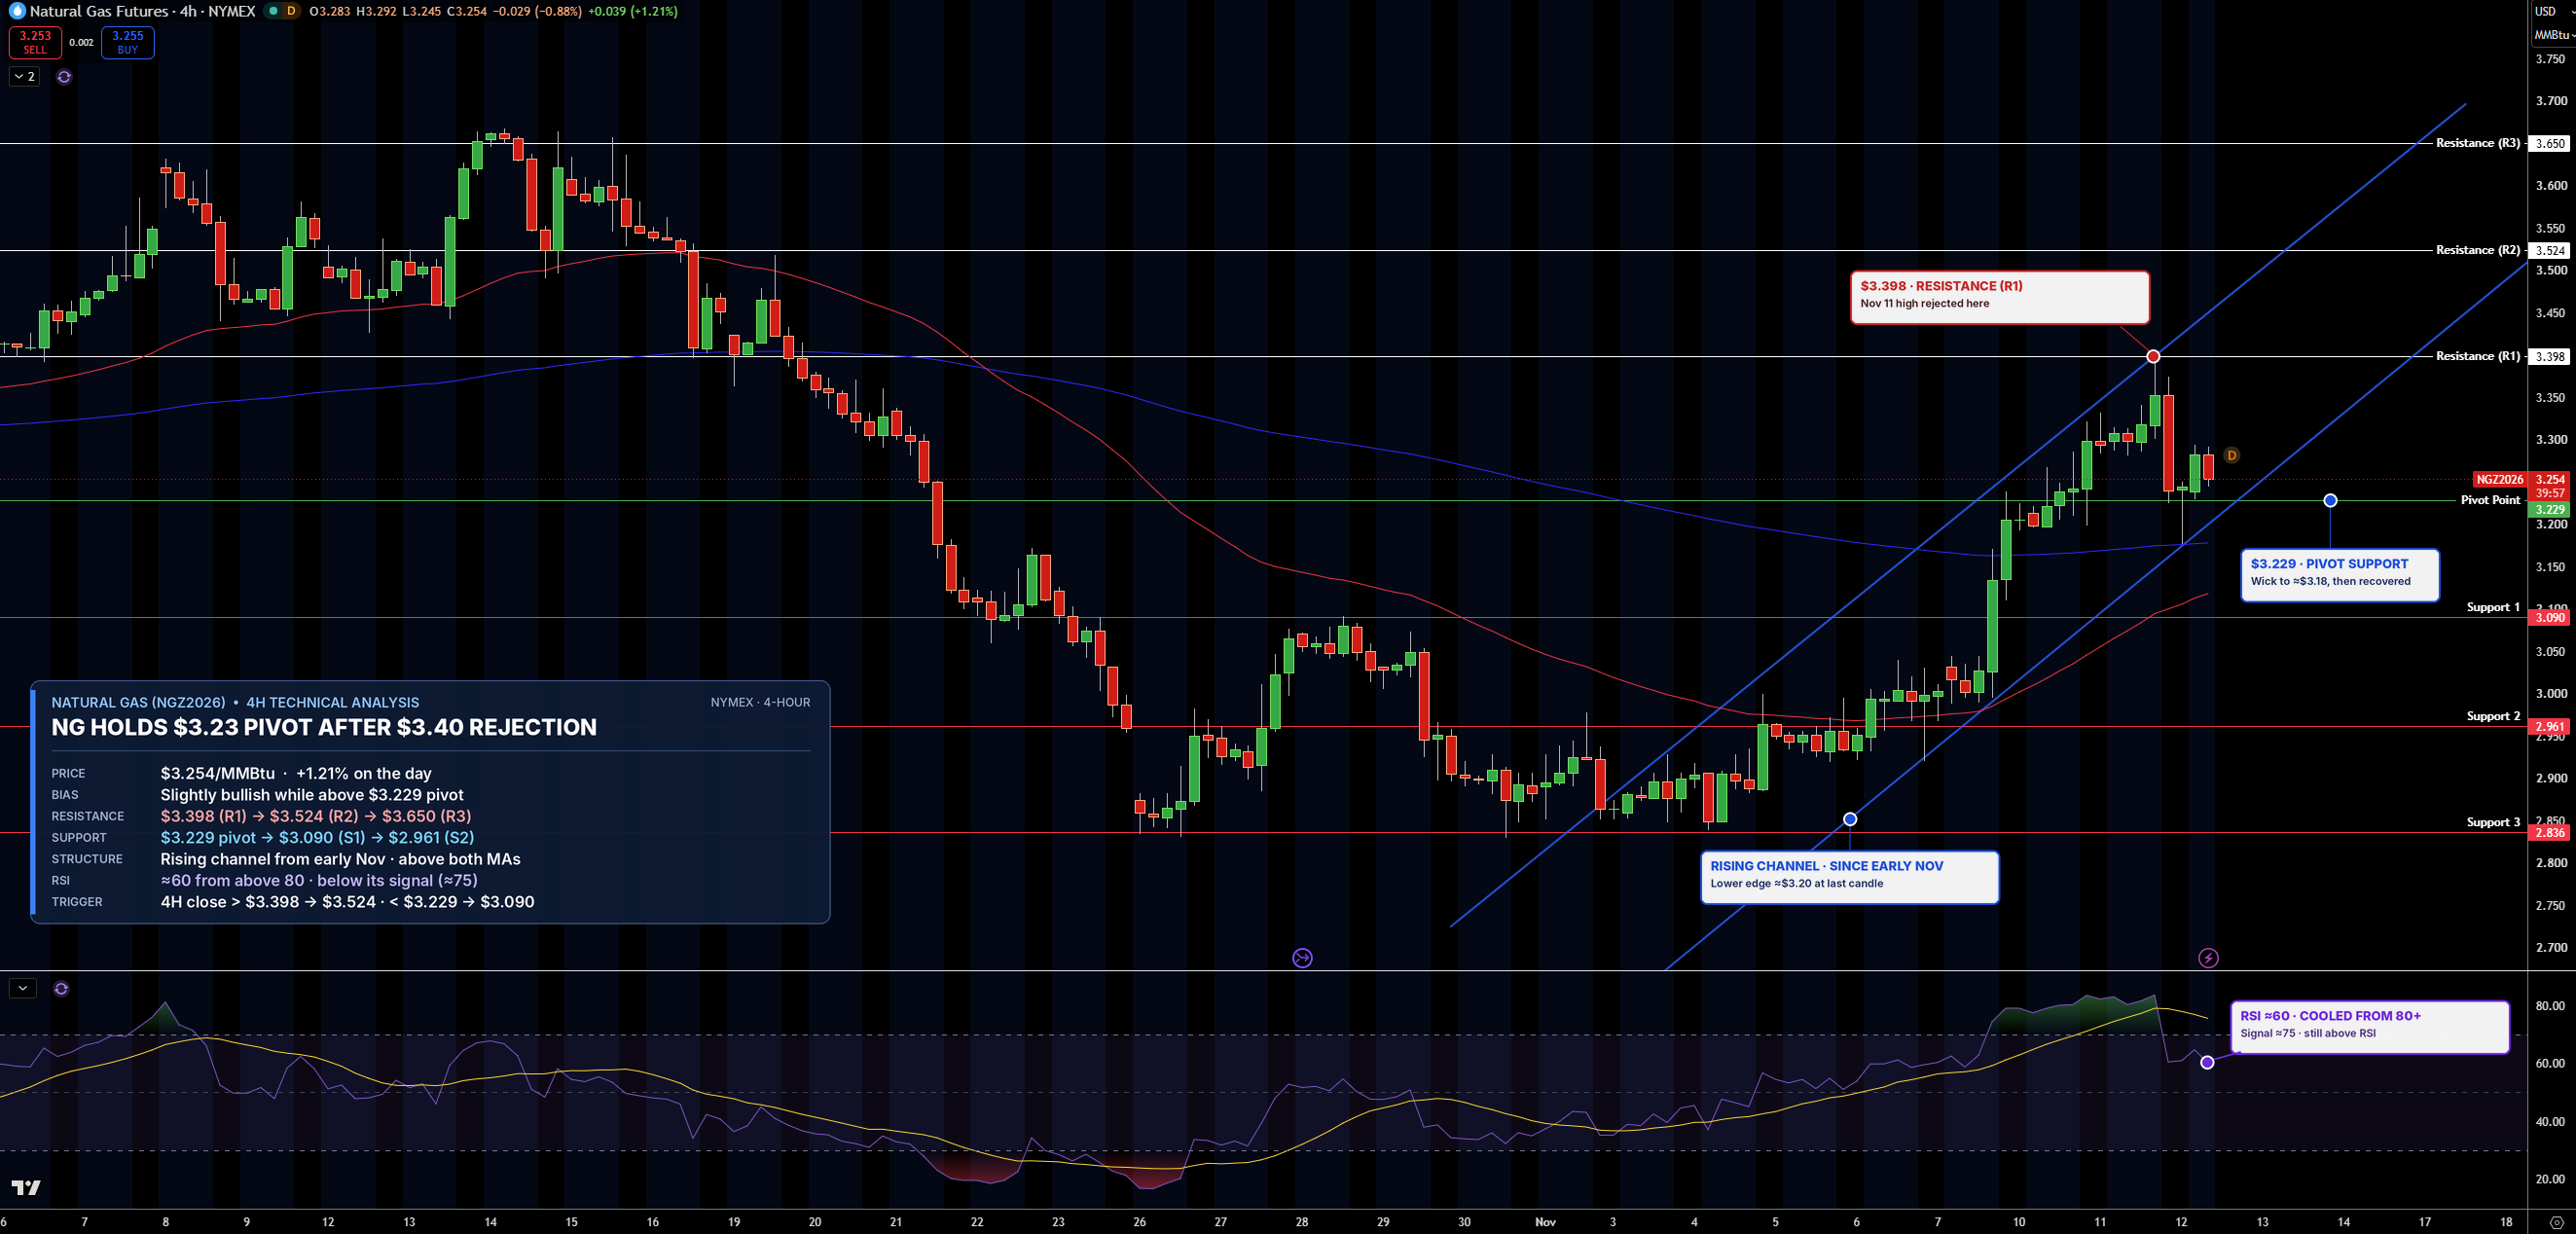
December natural gas is trading near $3.25/MMBtu, or per million British thermal units, on the 4-hour chart, still inside a rising channel from early November. Sellers stopped the rally near $3.40, but buyers pushed prices back above $3.23, the pivot point, after a brief dip to about $3.18. Gas remains above both moving averages, which track average prices over time.
Resistance is $3.40, then $3.52. Support is $3.23, then $3.09. RSI has cooled to about 60 from overbought, so the earlier rush has eased without breaking the trend. The bias is a slight bullish lean while gas holds $3.23, and a close above $3.40 would open $3.52.
WTI Crude Oil Technical Analysis: Oil Tests $85.22 Pivot After Channel Breakdown
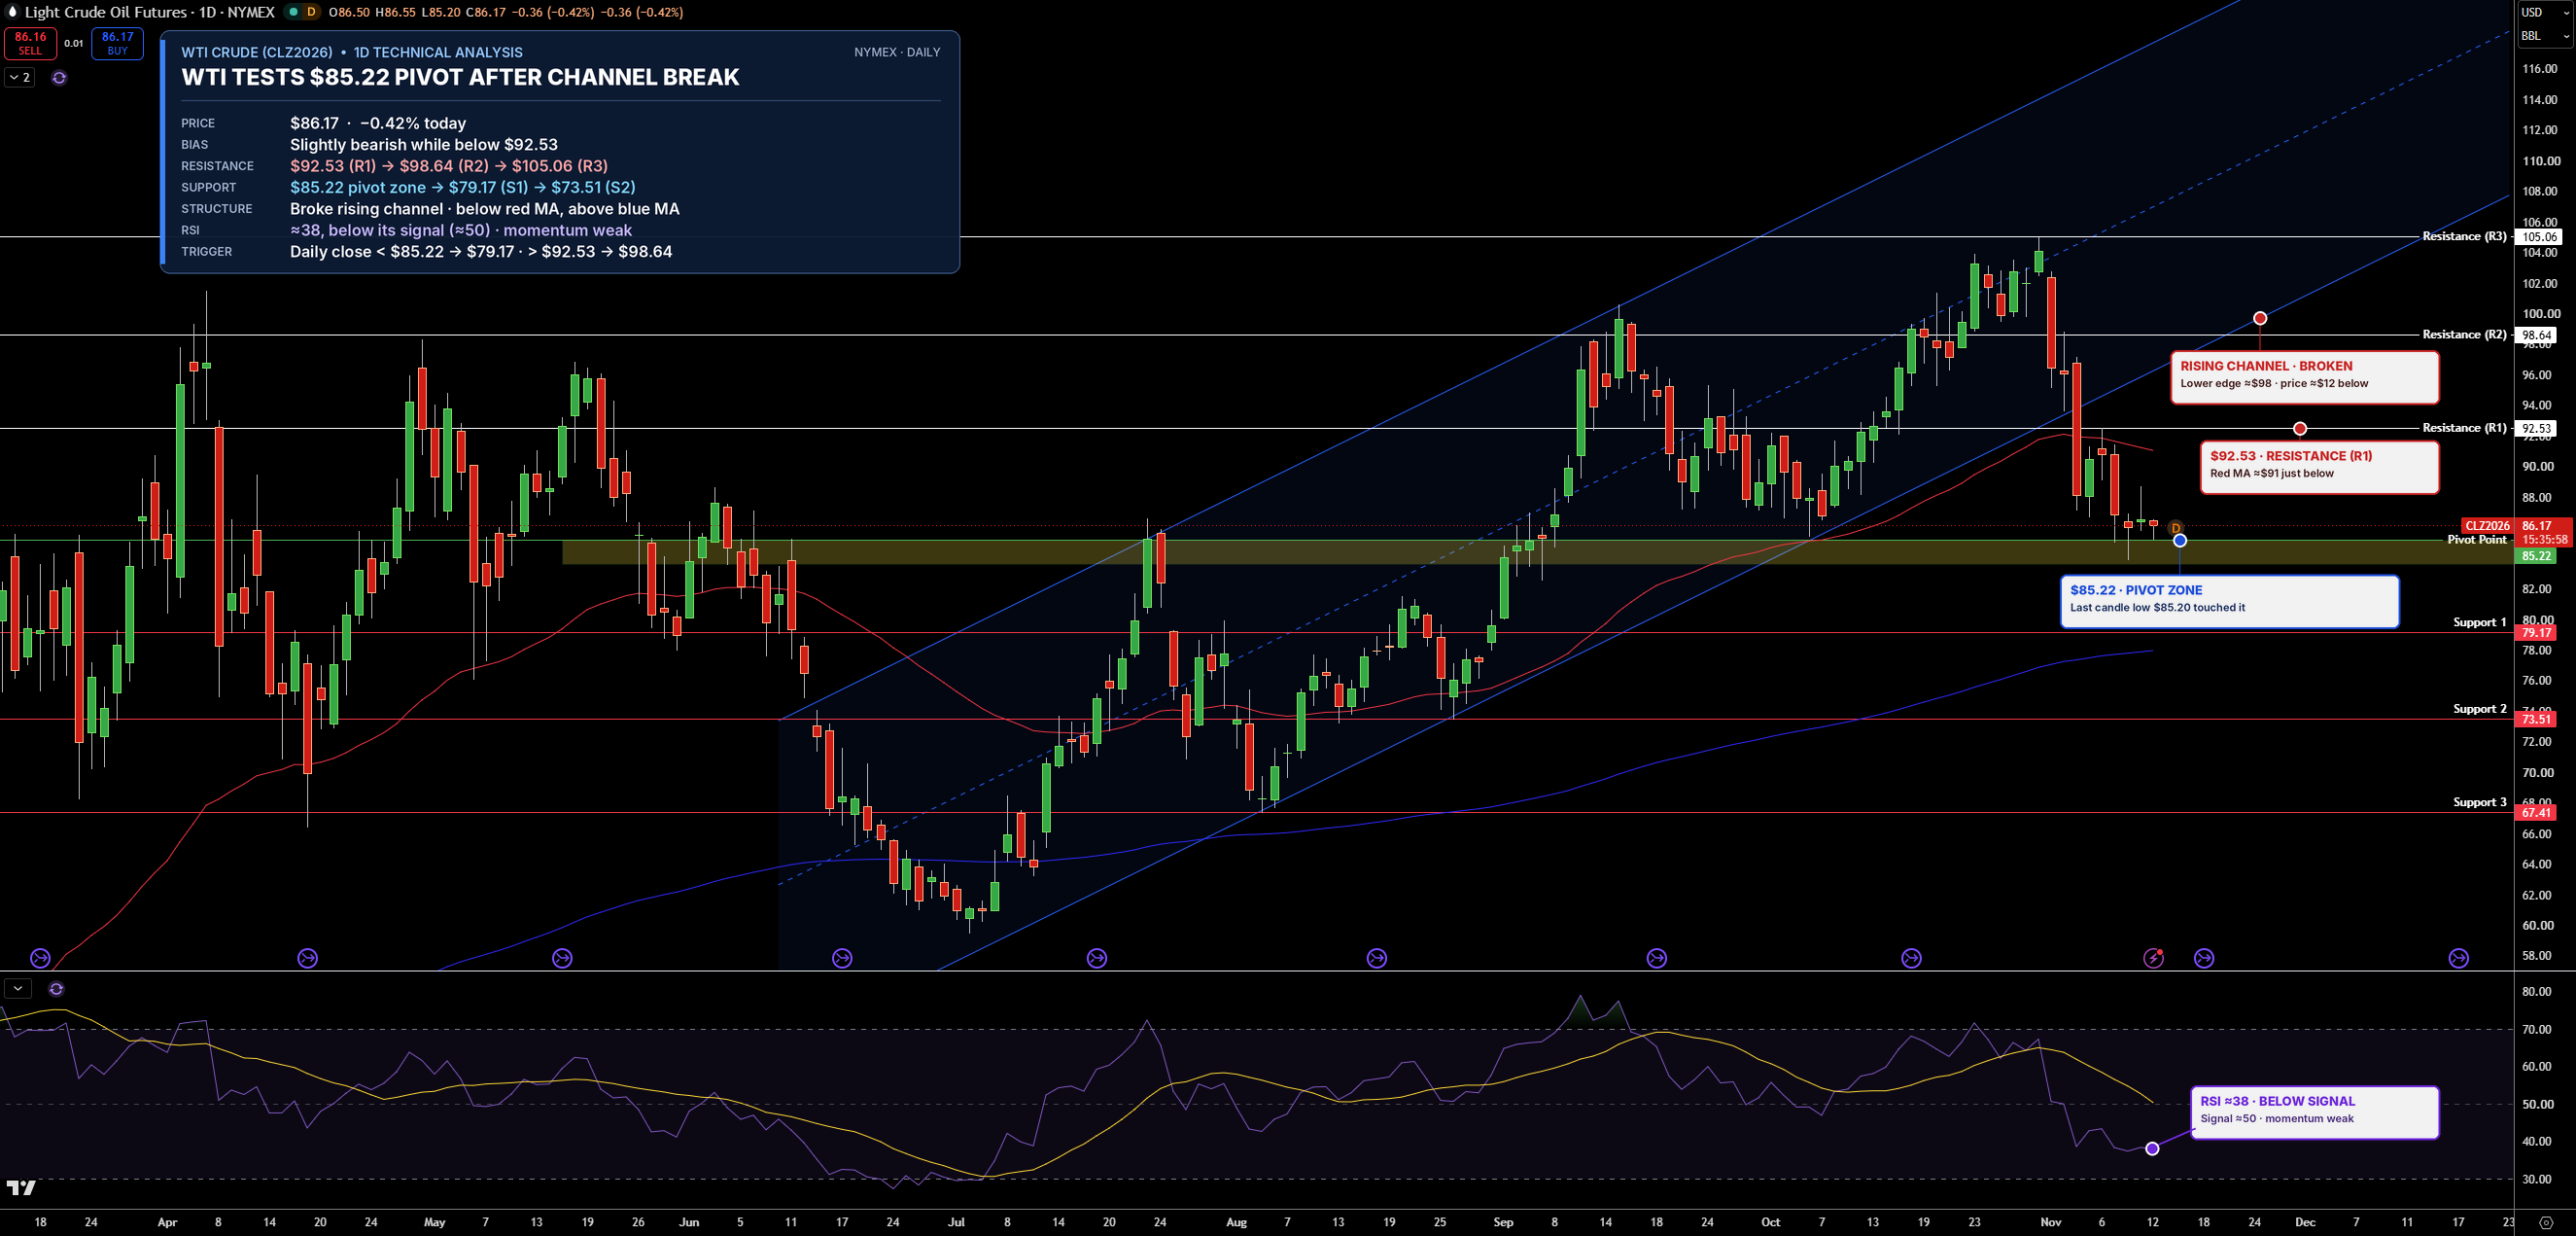
December WTI is trading near $86.17 on the daily chart after breaking below its rising channel from July. It is now resting on the $85.22 pivot zone. WTI sits below the faster moving average but above the slower one.
Support is $85.22, then $79.17. Resistance is $92.53, then $98.64. RSI is near 38 and below its signal line. My bias is a slight bearish lean while WTI stays below $92.53. A daily close below $85.22 would open $79.17.