Advertisement
Advertisement

Natural Gas and Oil Forecast: Record Heat and Hurricanes to Spike Prices?

By: 
Arslan Ali
Natural Gas and Oil Forecast: Record Heat and Hurricanes to Spike Prices?

Key Points:

  • Record heat and hurricanes challenge U.S. refiners, causing potential fuel price volatility.
  • Government forecasts up to seven major hurricanes, risking fuel supply disruptions and price spikes.
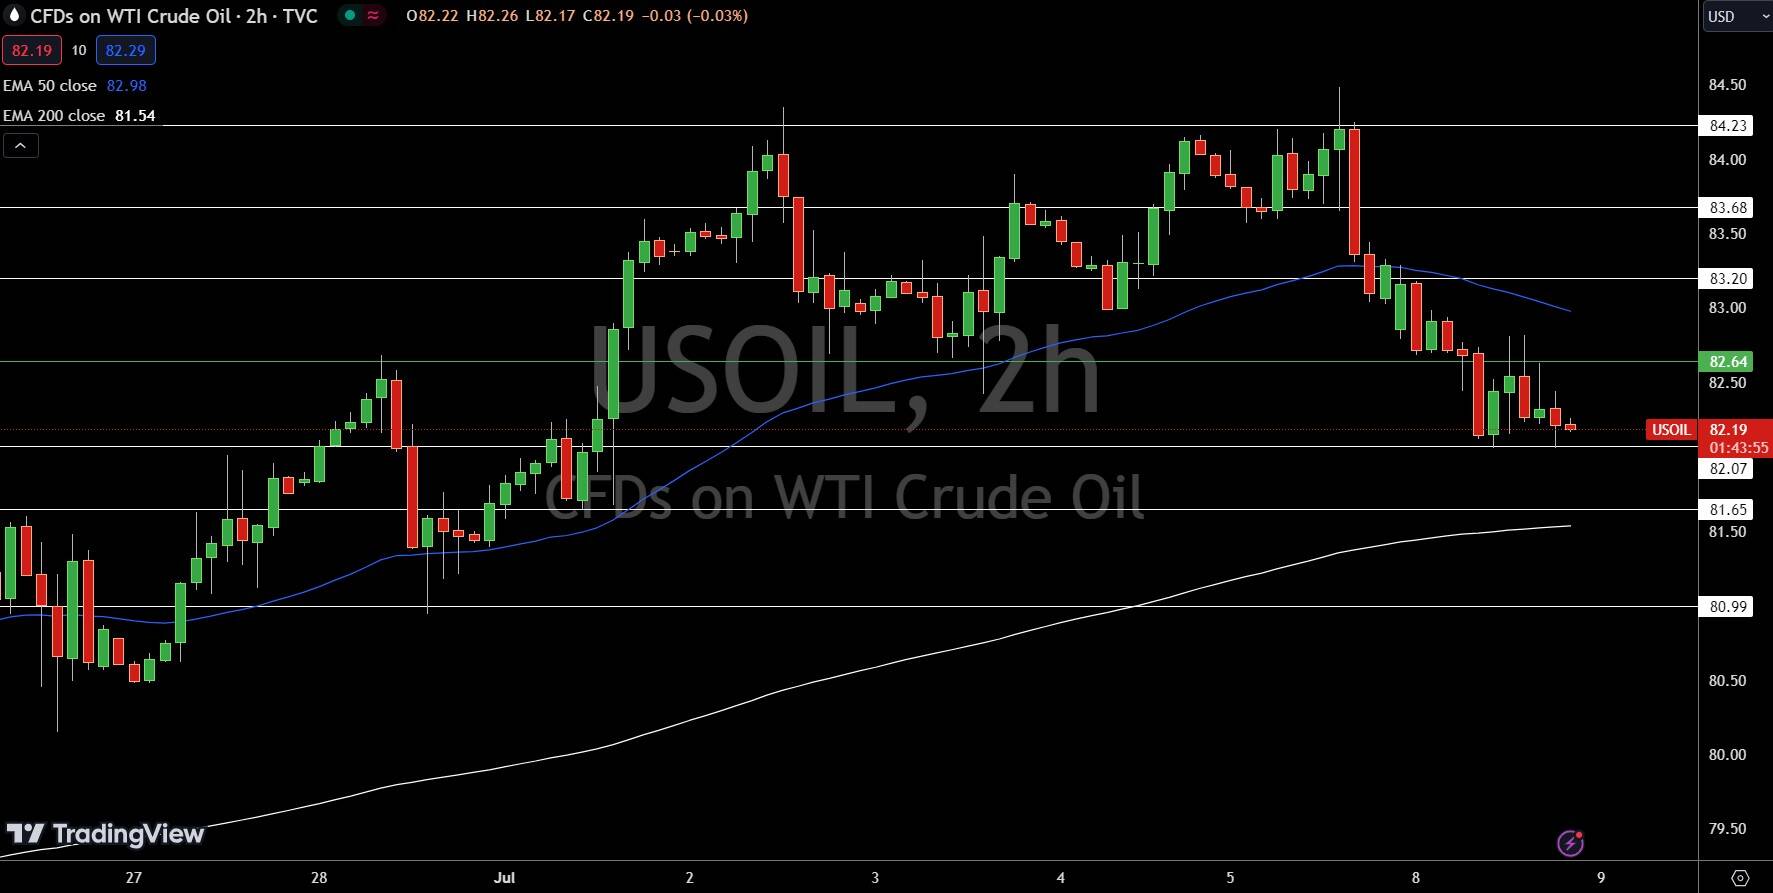
  • WTI Crude Oil is priced at $82.19; pivot point at $82.64, bearish outlook below this level.

Market Overview

Record heat and an active hurricane season pose significant challenges for U.S. refiners, potentially causing volatile fuel prices. The Atlantic hurricane season threatens refineries along the Gulf Coast, which accounts for half of the U.S.’s refining capacity.

Government forecasts predict up to seven major hurricanes, potentially disrupting fuel supplies and causing price spikes. Tropical Storm Beryl has already prompted operational cuts at Citgo’s Corpus Christi refinery.

Additionally, excessive summer heat can impair refinery operations, as seen with Phillips 66’s Wood River refinery. These conditions could impact natural gas and oil forecasts by driving price volatility and supply disruptions.

Natural Gas Price Forecast
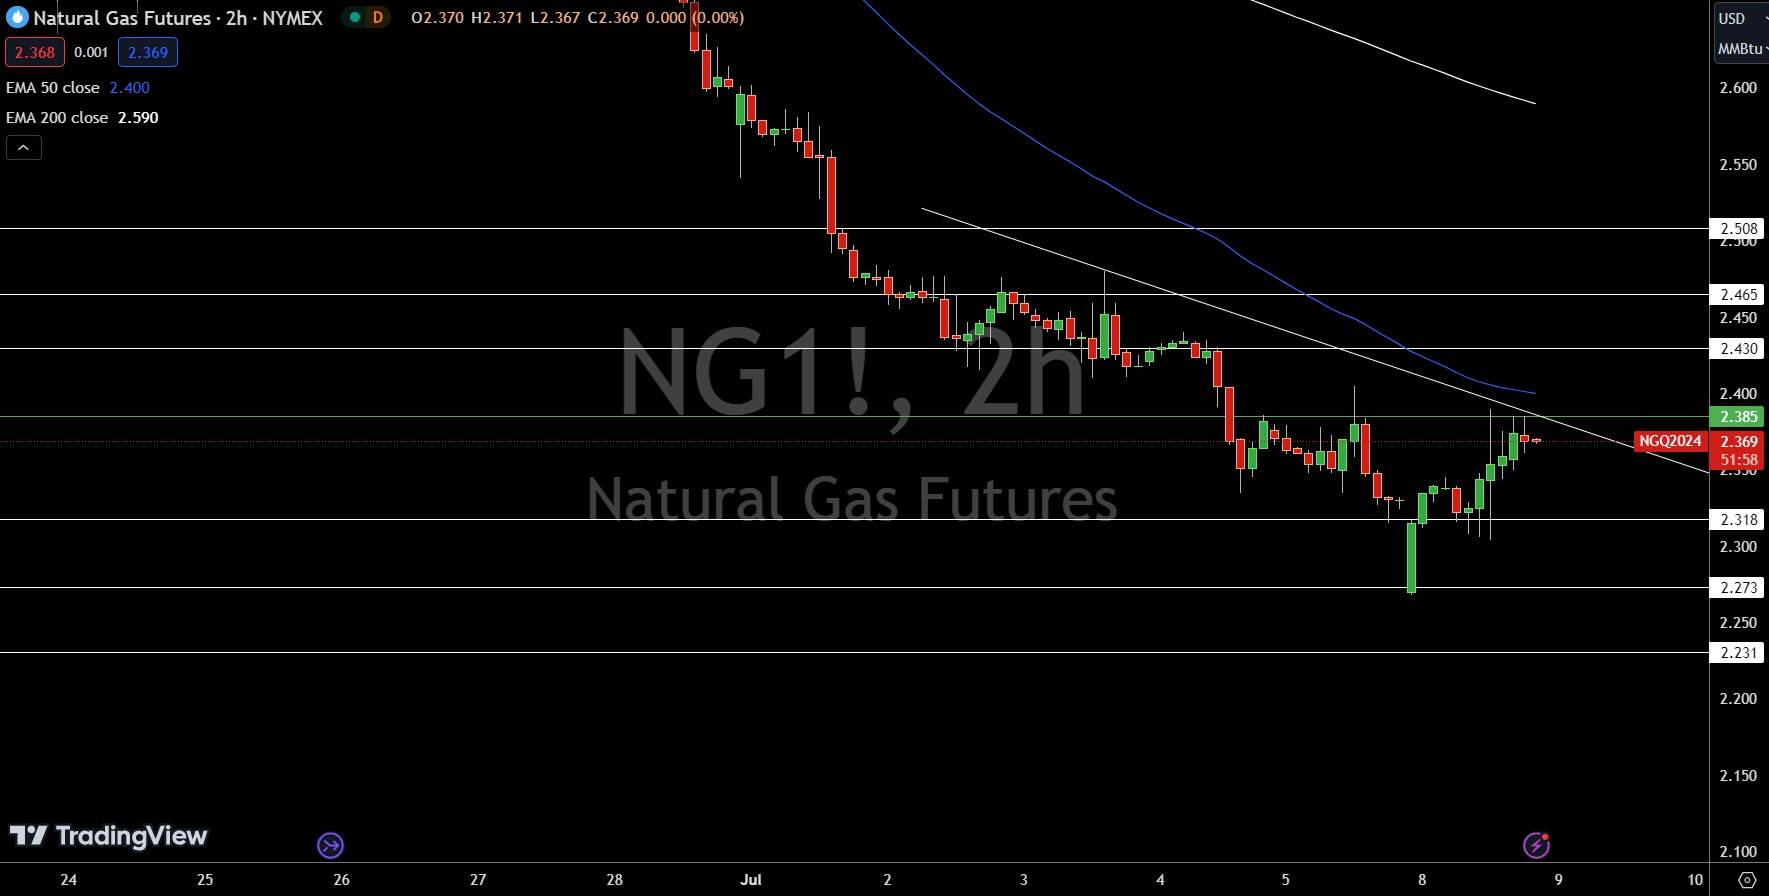
Natural Gas (NG) Price Chart
WTI Price Chart
WTI Price Chart

WTI Crude Oil (USOIL) is currently priced at $82.19 on the 2-hour chart. The pivot point is at $82.64. Immediate resistance is at $83.20, followed by $83.68 and $84.23.

On the downside, immediate support is at $82.07, with further support at $81.65 and $80.99. The 50-day EMA is positioned at $82.98, while the 200-day EMA is at $81.54.

A double bottom breakout below $82.64 could lead to significant selling pressure, provided that WTI Crude Oil remains below this level.

Brent Oil Price Forecast

Natural Gas Price Forecast

Every new Natural Gas analysis as it publishes, today's technical signal and key levels, live price — on one page.

See all Natural Gas forecasts
Brent Price Chart
Brent Price Chart

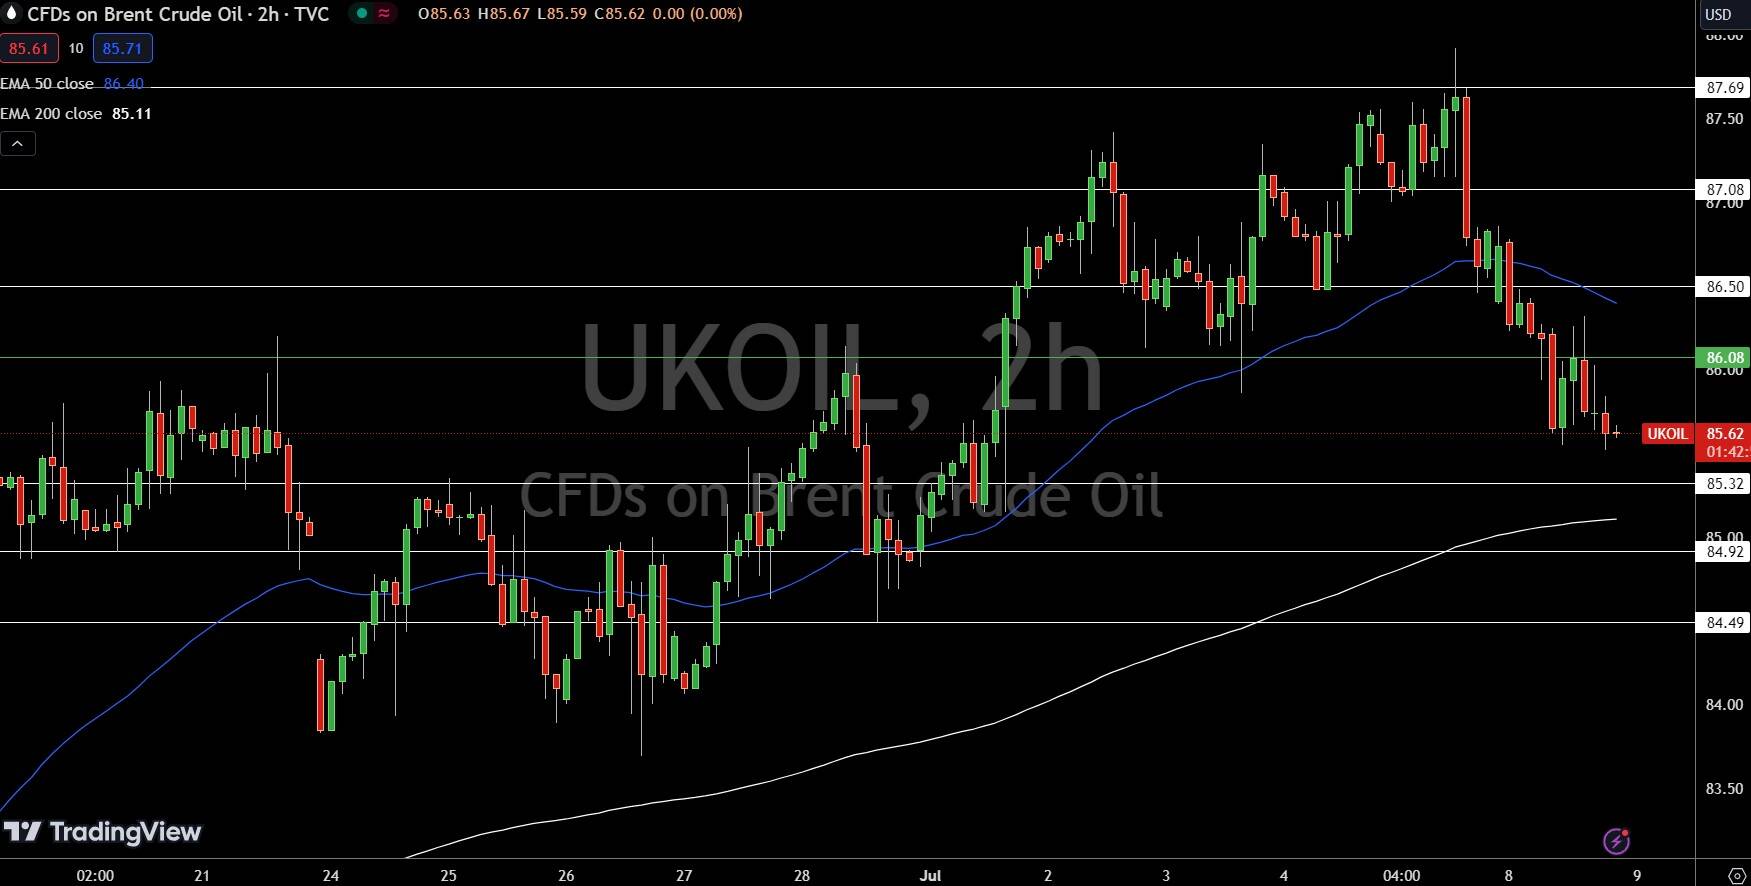
Brent Oil (UKOIL) is currently priced at $85.62 on the 2-hour chart. The pivot point is at $86.08. Immediate resistance is at $86.50, followed by $87.08 and $87.69.

Immediate support is at $85.32, with further support at $84.92 and $84.49. The 50-day EMA stands at $86.40, while the 200-day EMA is at $85.11.

The outlook is bearish below $86.08, suggesting selling pressure as long as Brent remains under this level.

About the Author

Arslan AliTechnical Analysis Expert

Arslan is a finance MBA and also holds an MPhil degree in behavioral finance. An expert in financial analysis and investor psychology, Arslan uses his academic background to bring valuable insights about market sentiment and whether instruments are likely to be overbought or oversold.

Advertisement