
Analyst Tina Teng noted the oil price surge was driven by optimistic demand outlooks and reduced U.S. inventories. However, concerns about high interest rates potentially limiting fuel consumption and economic growth remain.
The market is also watching U.S. personal consumption expenditures data for clues on Federal Reserve rate decisions. Additionally, geopolitical tensions, including Ukrainian attacks on Russian oil infrastructure and EU sanctions on Russia, support oil prices.
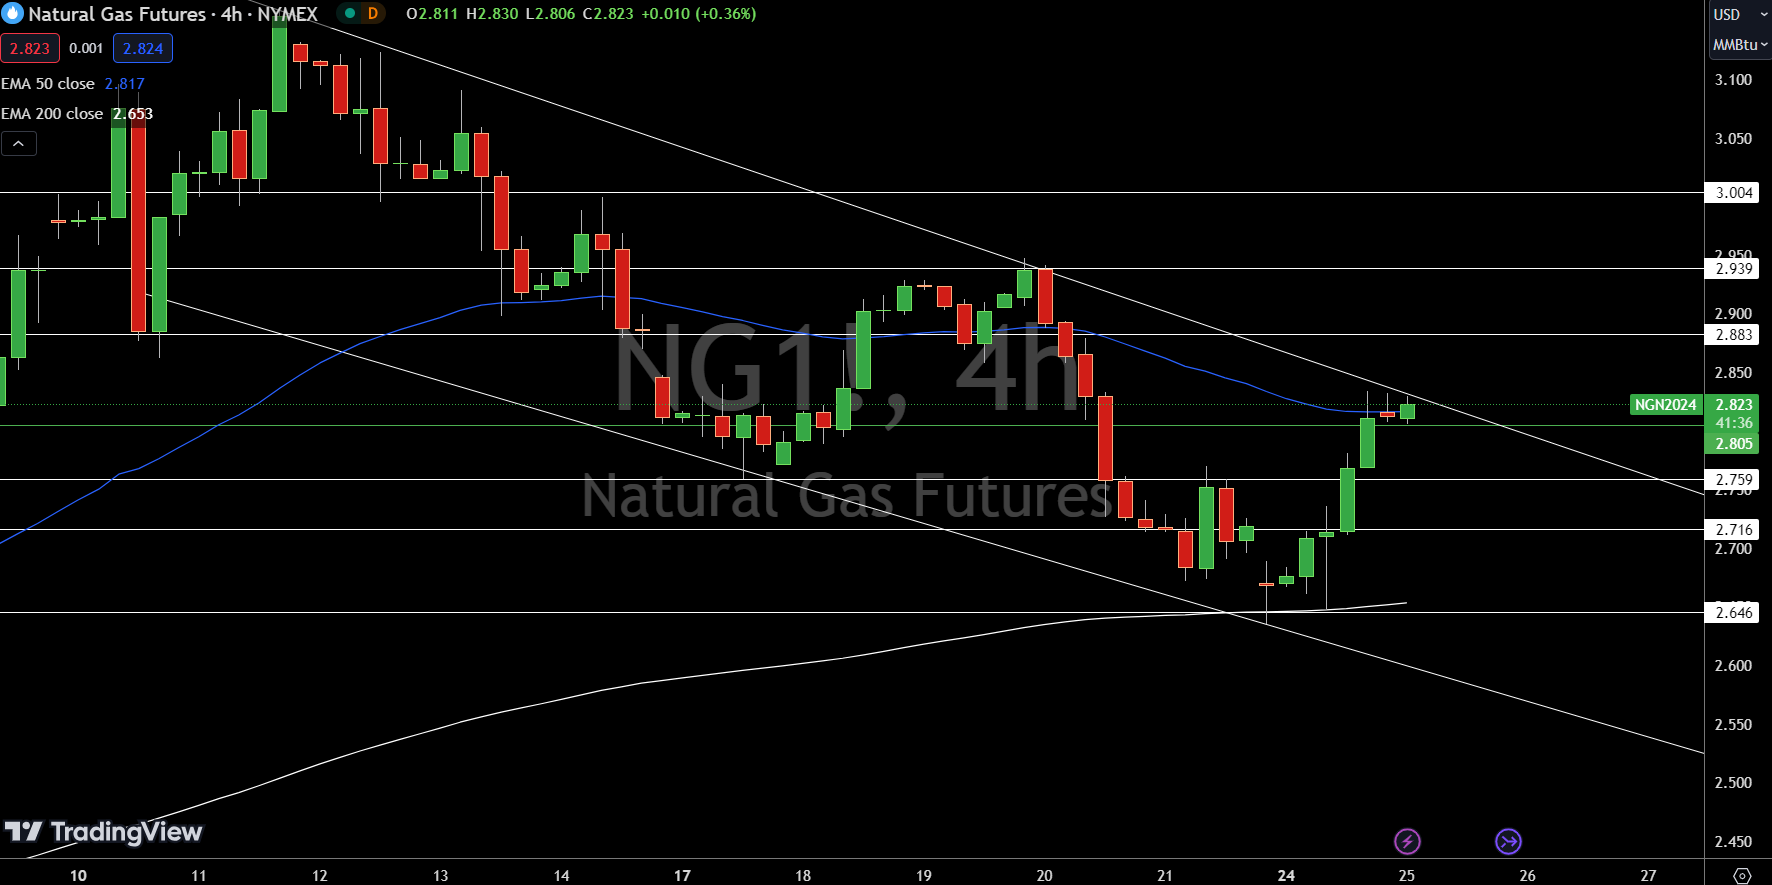
Natural Gas (NG) is trading at $2.823, down 0.07%. The pivot point is at $2.81. Immediate resistance levels are $2.88, $2.94, and $3.00. Support levels are $2.76, $2.72, and $2.65.The 50-day Exponential Moving Average (EMA) is at $2.82, and the 200-day EMA is at $2.65, suggesting a bullish trend above these levels.
In conclusion, NG remains bullish above $2.81. A break below this level could trigger a sharp selling trend, so traders should monitor these key levels closely for informed decisions.
WTI Oil Price Forecast
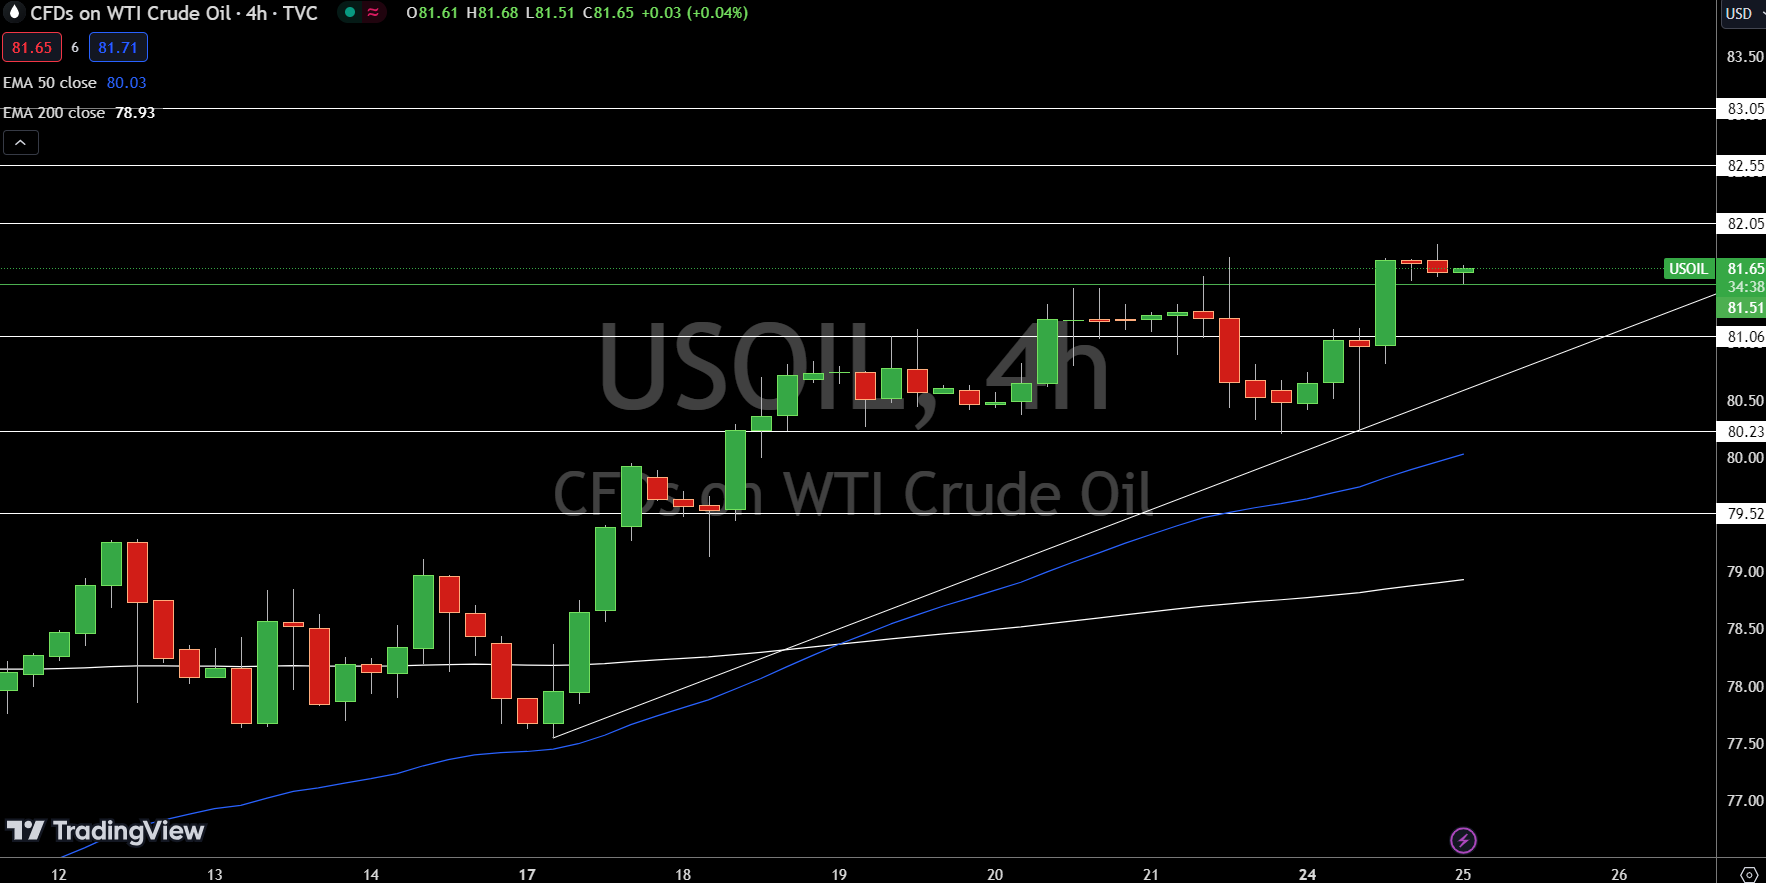
USOIL is trading at $81.65, down 0.07%. Key levels to watch include the pivot point at $81.51. Immediate resistance is at $82.06, $82.55, and $83.05. Support levels are $81.06, $80.23, and $79.52.
The 50-day Exponential Moving Average (EMA) is at $80.03, and the 200-day EMA is at $78.93, suggesting a bullish trend above these levels.
In conclusion, USOIL remains bullish above $81.51. A break below this level could trigger a sharp selling trend, so traders should monitor these key levels closely for informed decisions.
Brent Oil Price Forecast
Natural Gas Price Forecast
Every new Natural Gas analysis as it publishes, today's technical signal and key levels, live price — on one page.
See all Natural Gas forecasts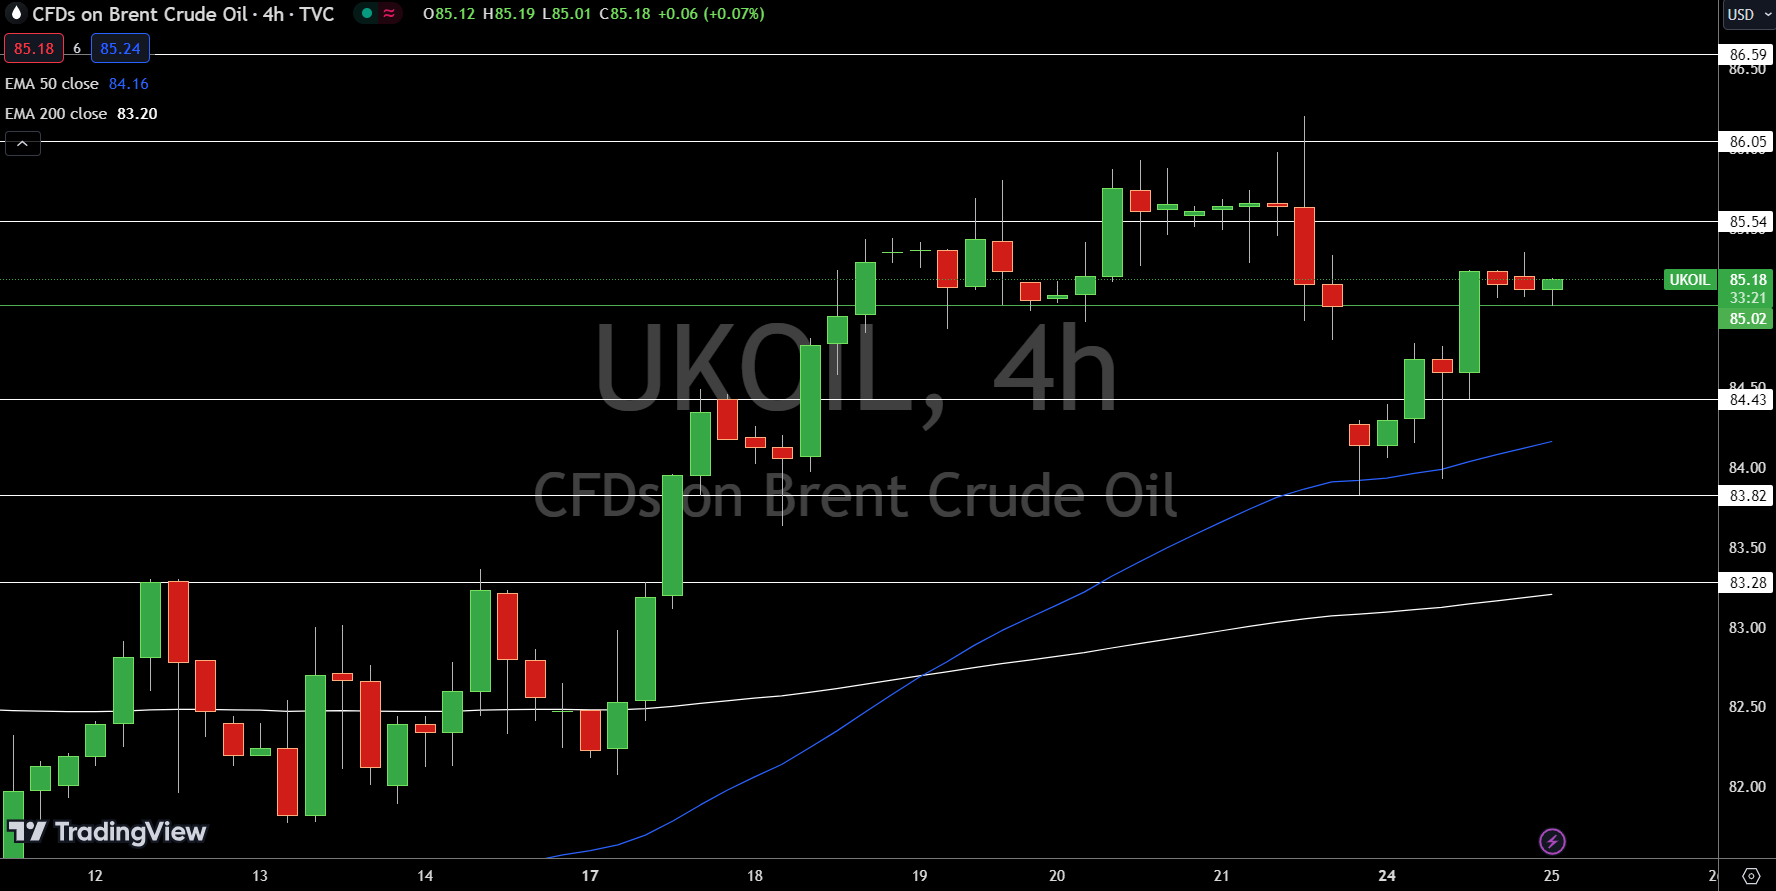
UKOIL is trading at $85.18, down 0.01%. The pivot point is at $85.02. Immediate resistance levels are $85.54, $86.05, and $86.59. Support levels are $84.43, $83.82, and $83.28.
The 50-day Exponential Moving Average (EMA) is at $84.16, and the 200-day EMA is at $83.20, suggesting a bullish trend above these levels.

In conclusion, UKOIL remains bullish above $85.02. A break below this level could trigger a sharp selling trend, so traders should monitor these key levels closely for informed decisions.